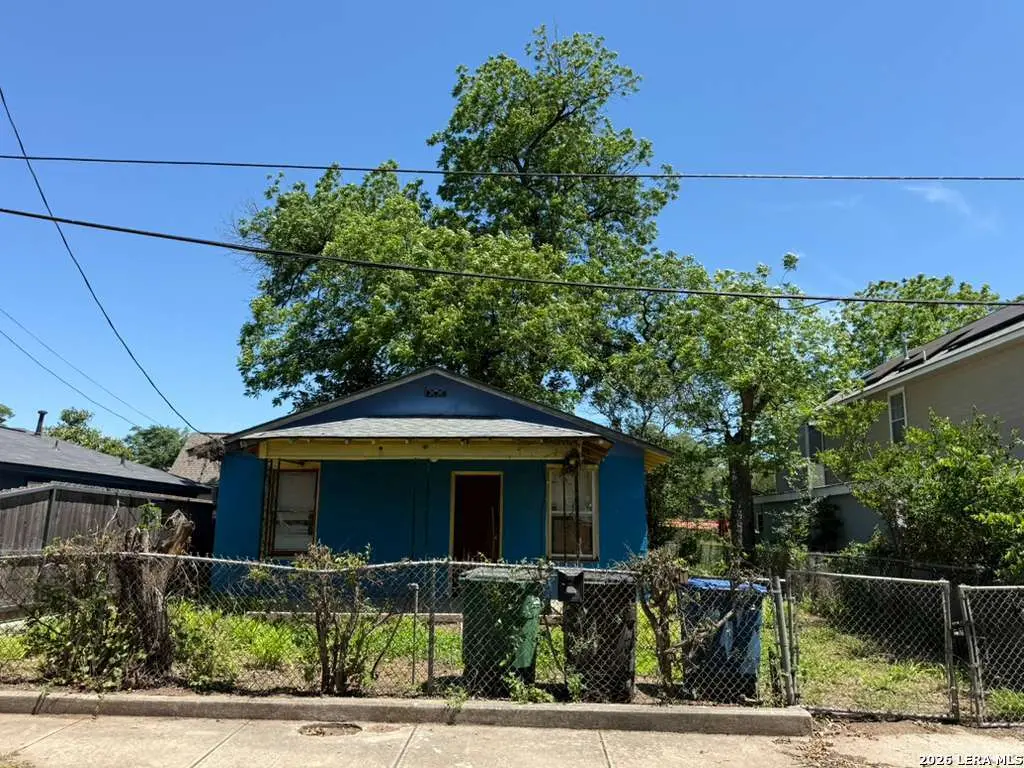
111 Huerta St · San Antonio, TX
Flood risk 1/10 · Minimal
- FEMA flood zone
- X (unshaded)
- Chance of flooding over 30 yrs
- 0.0%
- Est. flood insurance / yr
- $507 – $1,088
Fire risk 1/10 · Minimal
- Est. fire insurance / yr
- $1,222 – $2,270
Heat risk 8/10 · Major
- Hot days now (above 109°F)
- 7 days/yr
- Hot days in 30 yrs
- 22 days/yr
Wind risk 8/10 · Major
- Chance of severe wind over 30 yrs
- 80.0%
Air-quality risk 2/10 · Minimal
- Unhealthy air days now
- 1 days/yr
- Unhealthy air days in 30 yrs
- 2 days/yr
Risk factors via First Street. Map © Google.
Why this score? — see what drove the A- grade
The composite is a weighted blend of 9 inputs, each scored 0–100. Each bar is that input's sub-score; the figure is the points it added to the 100-point composite (weight × sub-score).
- Cash flow +27.4/30.0
- ARV discount +15.0/15.0
- Appreciation +10.0/10.0
- DSCR +9.6/10.0
- 1% rule +8.5/10.0
- Rent growth +4.4/5.0
- Livability +4.0/5.0
- Condition / age +2.5/5.0
- Schools +1.4/10.0
$75,000
🖨 Deal sheet (PDF) 📄 Offer letter ✓ Due diligence
Listing remarks
Calling all Investors that seek potential properties! This property is ready for a complete transformation. Selling AS-IS. Has a mature tree in the backyard for natural shade. Located less than five miles from Downtown and many attractions.
Key facts
- Backyard
- Downtown
- Attractions
Tags
Property features AI
Finance
- Other: Possession at closing/funding; For sale (not a short sale)
- HOA & community: Subdivision: S LAREDO SE TO FRIO CITY RD SA
Exterior
- Parking: Side entry parking
- Utilities: City water/sewer
- Home design: Pre-owned property; Approximately 74 years old
- Construction: Slab foundation; Composition roof
- Exterior features: Brick exterior
Interior
- Kitchen: Kitchen approximately 10 x 11
- Bedrooms: Master bedroom approximately 16 x 11
- Flooring: Other flooring (see remarks)
- Bathrooms: 1 full bathroom
- Heating & cooling: Natural gas heat
- Interior features: Natural gas heating
Neighborhood map
What this means for you Summary
Snapshot
- This is a 1-bed/1.0-bath single-family listed at $75k.
Deal economics
- At list price, monthly cash flow is $220 ($3k/yr) — positive.
- The deal already cash-flows at list — no discount required.
- Meets the 1% rule at list price ($1k rent vs $75k).
- Recommended offer: $73k (3.0% below list) — sets the bar for market timing.
- Cap rate 9.8% vs local median 3.8% in San Antonio — top-decile yield for the area; either an underpriced asset or a hidden risk that comps aren't pricing in. Stress-test before assuming the spread holds.
Location & tenants
- Location reads 80/100 on livability (#31 in TX, #1,616 nationally) — a professional / high-income tenant draw. Strengths: amenities A+, commute A+, cost of living A+; Watch: crime F.
- San Antonio ISD (urban): math 12% / reading 22% proficiency, ranked #805 of 826 in TX (top 98%) — low school quality limits family demand, transient renter base, plan for 1-2y turnover; 80% free/reduced lunch — lower-income household profile, screen leases tightly.
- Zoned schools: Collins Garden El (math 8% / reading 12%, grade F, #4,259 of 4,322 statewide, top 99%, 426 students, 95% FRL); Burbank H S (math 9% / reading 20%, grade F, #1,522 of 1,632 statewide, top 94%, 1,319 students, 90% FRL, charter).
- Market conditions: Rents rising fast (+7.7%/yr); 165 active listings in the ZIP; 28 comparable units currently listed for rent nearby; rentals at typical pace (median 17d on market — plan ~3-4 weeks tenant-placement turnaround); lower-income renter base — watch delinquency; 8,308 units permitted in Bexar County in 2024 (2,506 in 5+ unit buildings).
- This rent runs 37% of the median local income ($32k/yr) — at the standard rent-burdened threshold; future hikes will face affordability resistance.
Forward outlook
- In year one you build about $8k of equity ($519 loan paydown + $8k appreciation (10.0% local appreciation)).
- Bexar County population projected at +50% by 2050 — long-run rental-demand tailwind backs the buy-and-hold thesis.
- At projected returns (10.0% appreciation + 7.7% rent growth), your $21k cash investment doubles in ~2 years — after that, you're playing with house money.
- By year 5, paydown + projected appreciation supports a ~$37k cash-out refi (75% LTV) — recoverable capital for the next deal without selling this one.
Negotiation context
- It's been on market 34 days — a 3% lower offer ($73k) is reasonable based on typical stale-listing flexibility.
Risks & watch-outs
- Watch-outs: property tax is 2.5% of price; built in 1952 — expect roof / HVAC / electrical / plumbing capex.
- Climate carrying-cost: severe wind risk, 80% chance of damaging wind over 30y; extreme-heat days projected 7→22/yr by 2055 (HVAC capex compounding) — expect insurance premiums to compound above CPI over the hold.
Questions for the listing agent
- It's been on market 34 days. Have you received any prior offers? Is the seller open to a 3% concession, seller financing, or rate buy-down credit?
- Built in 1952 — when were the roof, HVAC, electrical panel, plumbing, and water heater last replaced?
- Property tax is high relative to price — has the assessment been appealed recently, and will the sale trigger a re-assessment?
- Is there a deadline driving the sale (1031 exchange, divorce, estate, relocation)? That informs how much negotiation room exists.
- Crime grade is F in this area — have there been break-ins, vandalism, or insurance claims at this property in the last 3 years? What carrier currently insures it and at what premium?
- What's the average days-on-market for RENTAL listings here right now (not sales)? A rising rental-DOM trend means longer vacancies and softer asking-rent achievability than the comps imply.
- What's the recent tenant-quality profile in this submarket — average credit score on applications, eviction rate, late-payment / NSF rate, and stable-employment percentage? A property-management company in the area should have these aggregated.
- How much new for-sale + rental construction is in the pipeline within 1–3 miles? Heavy new supply typically softens prices + rents 12–24 months out; constrained supply supports both.
Investment metrics
- 1% rule
- 1.35% ✓
- Cap rate
- 9.82%
- Cash-on-cash
- 12.58%
- DSCR
- 1.56
- GRM
- 6.2
CMA / ARV
- ARV (on-the-fly)
- $90,720
- Comps found
- 11
Show comp detail 11 sales within ~0.75 mi
| Address | Dist | Beds/Ba | Sqft | Sold | Price | $/sf | Match |
|---|---|---|---|---|---|---|---|
| 102 Noria | 0.14mi | 2/1.0 (+1) | 694 (-4%) | 2mo | $49,900 | $72 | 81 |
| 227 Noria St | 0.15mi | 2/1.0 (+1) | 696 (-3%) | 4mo | $55,000 | $79 | 79 |
| 410 Ceralvo | 0.16mi | 2/1.0 (+1) | 672 (-7%) | 7mo | $84,999 | $126 | 71 |
| 350 Madero | 0.25mi | 2/1.0 (+1) | 674 (-6%) | 10mo | $39,900 | $59 | 64 |
| 206 Mercedes | 0.22mi | 2/1.0 (+1) | 809 (+12%) | 2mo | $87,500 | $108 | 63 |
| 360 Madero St | 0.26mi | 2/1.0 (+1) | 680 (-6%) | 13mo | $100,000 | $147 | 63 |
| 530 Ceralvo | 0.25mi | 2/1.0 (+1) | 676 (-6%) | 16mo | $65,000 | $96 | 60 |
| 557 Barrett | 0.66mi | 2/1.0 (+1) | 748 (+4%) | 8mo | $129,900 | $174 | 51 |
| 209-211 Pendleton | 0.60mi | 1/1.0 | 672 (-7%) | 14mo | $150,000 | $223 | 50 |
| 231 Madero St | 0.12mi | 2/1.0 (+1) | 823 (+14%) | 24mo | $135,000 | $164 | 46 |
| 553 Barrett | 0.66mi | 2/1.0 (+1) | 660 (-8%) | 13mo | $138,900 | $210 | 40 |
Match score weights: distance 35% · size 25% · config 20% · recency 20%. Top-matched comps best support the ARV.
Projected returns pro-forma
10.0% appreciation · 7.73% rent growth · sell at horizon
- IRR
- 36.0%
- Equity multiple
- 3.86×
- Total profit
- $59,978
- Equity at exit
- $67,566
- IRR
- 32.8%
- Equity multiple
- 9.48×
- Total profit
- $178,101
- Equity at exit
- $145,709
Cash invested: $21,000 (down + closing). Projections, not guarantees.
Landlord ↔ Tenant lean methodology
- Overall (STATE)
- 87 Strongly Landlord-Friendly
- State Texas
- 87 Strongly Landlord-Friendly · R+5
- County
- — inherits STATE
- City
- — inherits STATE
ZIP-level market 78207
- Home prices YoY
- 15.2%
- Rents YoY
- 7.7%
- Active inventory
- 165
- Price-to-rent
- 6.2×
Monthly cashflow live
- Estimated rent
- $1,014 high interval (Pro) →
- Mortgage (P&I)
- −$393
- Tax from tax record
- −$156 /mo · $1,877/yr
- Insurance
- −$31
- HOA
- −$0
- Vacancy / Maint / Mgmt
- −$213
- Net cashflow
- $220
Break-even live
Sensitivity live
| Price | -10% $263 | -5% $241 | +0% $220 | +5% $199 | +10% $178 |
|---|---|---|---|---|---|
| Rent | -10% $140 | -5% $180 | +0% $220 | +5% $260 | +10% $300 |
| Rate | -1.0pp $258 | -0.5pp $239 | base $220 | +0.5pp $201 | +1.0pp $181 |
UW: 25.0% down · 7.5% · 30yr · 1.5% tax · 5.0% vac · 8.0% maint · 8.0% mgmt
Financing live
Cash to close
- Down payment
- $18,750
- Closing costs
- $2,250
- Reserves months
- —
- Total cash needed
- —
Loan-product check · same deal, 3 products live
Conventional
25% down · 7.5% · 30yr
- Down + closing
- —
- Monthly P&I
- —
- Monthly cashflow
- —
- DSCR
- —
- Eligible?
- —
Personal DTI + credit; lowest rate.
DSCR
20% down · 8.5% · 30yr
- Down + closing
- —
- Monthly P&I
- —
- Monthly cashflow
- —
- DSCR
- —
- Eligible?
- —
No personal income docs; deal must DSCR.
Hard money
10% down · 12.0% · 12mo
- Down + closing
- —
- Monthly P&I
- —
- Monthly cashflow
- —
- DSCR
- —
- Eligible?
- —
Short-term bridge; refi at stabilization.
Rent comps 28 comps
| Address | Beds | Baths | Sqft | Rent | $/sqft | DOM | Units | Dist |
|---|---|---|---|---|---|---|---|---|
| 1938 S Zarzamora St Unit 610 San Antonio, TX | 1.0 | 1.0 | 744 | $915 | $1.23 | 4d | 1 | 0.36mi |
| 2003 S Zarzamora St San Antonio, TX | 1.0–4.0 | 1.0–2.0 | 1028 | $982 | $0.96 | 24d | 1 | 0.39mi |
| 350 Barrett Pl San Antonio, TX | 2.0 | 1.0 | 616 | $1,225 | $1.99 | 5d | 1 | 0.65mi |
| 330 Barrett Pl San Antonio, TX | 1.0 | 1.0 | 400 | $900 | $2.25 | 13d | 1 | 0.67mi |
| 1901 S San Marcos Unit 610 San Antonio, TX | 1.0 | 1.0 | 750 | $962 | $1.28 | 4d | 1 | 0.73mi |
| 815 Ripford St San Antonio, TX | 2.0 | 1.0 | 728 | $1,300 | $1.79 | 5d | 1 | 0.92mi |
| 205 W Lambert St San Antonio, TX | 2.0 | 1.0 | 550 | $995 | $1.81 | 18d | 1 | 1.09mi |
| 218 Tampico St San Antonio, TX | 2.0 | 1.0–2.0 | 808 | $1,204 | $1.49 | 3d | 28 | 1.12mi |
| 1606 El Paso St San Antonio, TX | — | 1.0 | 445 | $788 | $1.77 | 2d | 1 | 1.14mi |
| 131 Klein St #1 San Antonio, TX | 2.0 | 1.0 | 653 | $1,395 | $2.14 | 45d | 1 | 1.14mi |
| 125 Forrest Ave San Antonio, TX | 2.0 | 1.0 | 616 | $1,275 | $2.07 | 17d | 1 | 1.18mi |
| 2721 Colima St San Antonio, TX | 2.0 | 1.0 | 700 | $1,250 | $1.79 | 15d | 1 | 1.20mi |
| 1102 El Paso St San Antonio, TX | 1.0–3.0 | 1.0–2.0 | 888 | $795 | $0.90 | 4d | 1 | 1.26mi |
| 302 W Cevallos Unit 2 San Antonio, TX | 1.0 | 1.0 | 400 | $1,250 | $3.12 | 44d | 1 | 1.26mi |
| 520 Prado St Unit 1 San Antonio, TX | 2.0 | 1.0 | 620 | $799 | $1.29 | 44d | 1 | 1.30mi |
| 3017 Colima St San Antonio, TX | 1.0 | 1.0 | 480 | $800 | $1.67 | 44d | 1 | 1.32mi |
| 128 Saint Francis Ave Unit 3 San Antonio, TX | 1.0 | 1.0 | 528 | $775 | $1.47 | 24d | 1 | 1.32mi |
| 2600 S Flores St San Antonio, TX | 2.0 | 1.0 | 705 | $875 | $1.24 | 24d | 3 | 1.33mi |
| 150 Bank St San Antonio, TX | 1.0 | 1.0 | 700 | $795 | $1.14 | 44d | 1 | 1.36mi |
| 150 Bank St Unit C San Antonio, TX | 1.0 | 1.0 | 600 | $749 | $1.25 | 21d | 1 | 1.36mi |
| 939 S Frio St Unit 1294 San Antonio, TX | 1.0 | 1.0 | 630 | $977 | $1.55 | 4d | 1 | 1.37mi |
| 939 S Frio St Unit 294 San Antonio, TX | 1.0 | 1.0 | 664 | $1,009 | $1.52 | 11d | 1 | 1.37mi |
| 1011 S Frio St San Antonio, TX | 3.0 | 1.0–3.0 | 1121 | $1,445 | $1.29 | 2d | 32 | 1.40mi |
| 1401 S Flores St #300 San Antonio, TX | 1.0 | 1.0 | 728 | $1,750 | $2.40 | 17d | 1 | 1.42mi |
| 515 Humble Ave San Antonio, TX | 1.0 | 1.0 | 700 | $810 | $1.16 | 44d | 1 | 1.42mi |
| 112 Oelkers San Antonio, TX | 1.0 | 1.0 | 420 | $1,100 | $2.62 | 4d | 1 | 1.43mi |
| 112 Oelkers St Unit 2 San Antonio, TX | 1.0 | 1.0 | 375 | $950 | $2.53 | 44d | 1 | 1.43mi |
| 416 Collingsworth Unit 2 San Antonio, TX | 2.0 | 1.0 | 570 | $1,100 | $1.93 | 44d | 1 | 1.43mi |
Listing history 15 events
-
2026-06-21days on market $75,000 Active 34 DOM
-
2026-06-18days on market $75,000 Active 31 DOM
-
2026-06-17days on market $75,000 Active 30 DOM
-
2026-06-16days on market $75,000 Active 29 DOM
-
2026-06-15days on market $75,000 Active 28 DOM
-
2026-06-13days on market $75,000 Active 26 DOM
-
2026-06-09days on market $75,000 Active 22 DOM
-
2026-06-08days on market $75,000 Active 21 DOM
-
2026-06-07days on market $75,000 Active 20 DOM
-
2026-06-04days on market $75,000 Active 17 DOM
-
2026-06-03days on market $75,000 Active 16 DOM
-
2026-06-02days on market $75,000 Active 15 DOM
-
2026-06-01days on market $75,000 Active 14 DOM
-
2026-05-31days on market $75,000 Active 13 DOM
-
2026-05-18$75,000 New
ⓘ Source: listings_history table (triggers on properties + properties_extension) + one-shot
backfill from property_details.listing_events for pre-trigger history.
Tax reassessment forecast TX · Resets to sale price
- Current annual tax
- $1,877 · $156/mo
- Projected year-2 tax
- $1,877 · $156/mo
- Expected delta
- $0/yr ($0/mo · 0.0%)
ⓘ Screening estimate from a state-policy table — verify with the county assessor before closing.
Climate risk First Street
- Flood 1/10 Low FEMA zone X (unshaded) · 0% chance over 30 yrs
- Wildfire 1/10 Low
- Heat 8/10 Severe 7 d/yr ≥109°F today · 22 d/yr by 30 yrs out
- Wind 8/10 Severe 80% chance of damaging wind over 30 yrs
- Air quality 2/10 Low 1 unhealthy d/yr today · 2 by 30 yrs out
Nearby sold comps map
Loading sold comps map…
Walkable amenities ~0.75 mi
Loading nearby amenities…
Taxation est. · year 1
- Rental income
- $12,168
- − Mortgage interest
- −$4,201
- − Property taxes
- −$1,877
- − Insurance
- −$375
- − Repairs & maintenance
- −$973
- − Management
- −$973
- − Depreciation
- −$2,182
- Taxable income
- $1,587
- Est. tax owed @ 24.0%
- −$381
- After-tax cash flow
- $2,261/yr
For passive investors: Depreciation is non-cash, so a rental often shows a tax loss while cash-flowing — sheltering income. Rental losses are passive: they offset passive income freely, and up to $25,000/yr can offset ordinary (W-2) income if you actively participate and your MAGI is under $100k (phasing out to $0 by $150k); unused losses carry forward. On sale, claimed depreciation is recaptured at up to 25%, and gains may owe capital-gains tax (a 1031 exchange can defer both). Figures are a year-1 estimate at your 24.0% rate — not tax advice; consult a CPA.
Schools (NCES district)
- District
- San Antonio ISD
- NCES district ID
- 4838730
- Math proficiency
- 12% ▼ -21.00%
- Reading proficiency
- 22% ▼ -7.00%
- Median HH income
- $30,952
- Composite
- 13.57/100
- National rank
- #9512
- State rank
- #805 of 826 in TX
Livability — San Antonio
- Score
- 80/100
- State rank
- #31
- US rank
- #1616
Category grades
Schools grade is shown separately in the Schools card above.
Census & demographics
- Census place
- San Antonio, TX
- County
- Bexar County · 1,990,555 people
- City population
- 1,806,925
- Metro
- San Antonio-New Braunfels, TX
- Population (ZIP)
- 55,474
- Household income
- $32,472
- Rent vs Own
- Severe rent burden
- 2789.0
Population outlook (Bexar County) Hauer SSP2
- Today (2025)
- 2,336,851 people
- By 2030
- 2,560,728 · +9.6%
- By 2040
- 3,020,569 · +29.3%
- By 2050
- 3,493,522 · +49.5%
- By 2075
- 4,668,459 · +99.8%
- By 2100
- 5,533,242 · +136.8%
Race, ethnicity, and origin ACS 2023
- Neighborhood character
- Predominantly Hispanic (88%)
- Race & ethnicity
- Hispanic / Latino 88% Two or more races 41% White 6% Black 5% Native American 2%
- Hispanic origin (detail)
- Mexican 79%
- Foreign-born
- 19% · Canada
- Languages at home
- 39% English-only · Spanish 60%
Political lean MEDSL · Bexar
- 2024 margin
- Lean D (+9.8) · D 54.3% · R 44.6% · Other 1.1%
- 2008→2024 swing
- +4.2pp toward D · 2008: 5.6pp · 2024: 9.8pp
- All cycles
- 2024: D+9.8 2020: D+18.2 2016: D+13.5 2012: D+4.6 2008: D+5.6
Not yet ingested
- Civics
- —
Market trends
- HPI YoY
- ▲ 34.92%
- Current HPI
- 264.7559
- Rent YoY
- ▲ 7.73%
- Metro
- San Antonio-New Braunfels, TX
- State GDP YoY
- ▲ 3.95%
- F500 in state
- 110
Industry mix (Fortune 500 HQ in TX)
| Industry | F500 HQs | Revenue |
|---|---|---|
| Energy | 16 | $1,198B |
|
||
| Technology | 5 | $198B |
|
||
| Engineering / Construction | 4 | $72B |
|
||
| Energy Services | 3 | $60B |
|
||
| Utilities | 3 | $41B |
|
||
| Healthcare | 2 | $330B |
|
||
Price history
1 event — show timeline
- 2026-05-18 Listed $75,000 LERA
Property tax history
+7.8%/yrLatest (2025): $1,877 · +0.0% YoY. Source: county tax records.
Cash-flow waterfall
monthlySold comps — $/sqft
last 12 mo · ≤1 miLoading sold comps…