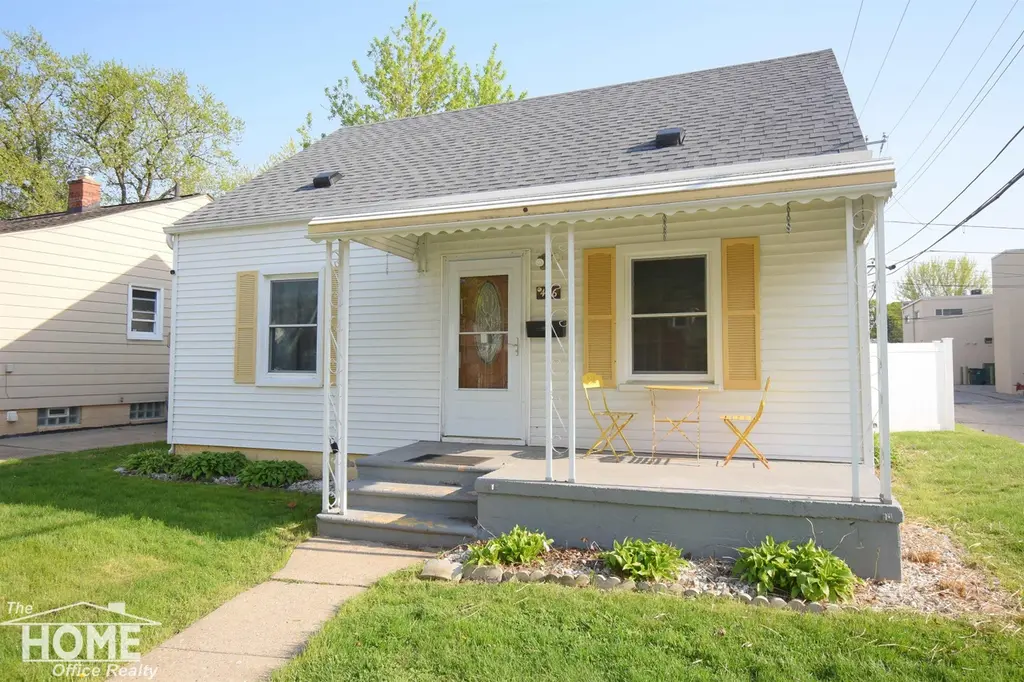
426 E Webster St · Ferndale, MI
Flood risk 6/10 · Moderate
- FEMA flood zone
- X (unshaded)
- Chance of flooding over 30 yrs
- 0.69%
- Est. flood insurance / yr
- $507 – $1,088
Fire risk 1/10 · Minimal
- Est. fire insurance / yr
- $784 – $1,456
Heat risk 2/10 · Minimal
- Hot days now (above 97°F)
- 7 days/yr
- Hot days in 30 yrs
- 14 days/yr
Wind risk 2/10 · Minimal
- Chance of severe wind over 30 yrs
- —
Air-quality risk 4/10 · Minor
- Unhealthy air days now
- 4 days/yr
- Unhealthy air days in 30 yrs
- 6 days/yr
Risk factors via First Street. Map © Google.
Why this score? — see what drove the D grade
The composite is a weighted blend of 9 inputs, each scored 0–100. Each bar is that input's sub-score; the figure is the points it added to the 100-point composite (weight × sub-score).
- ARV discount +13.2/15.0
- Cash flow +10.7/30.0
- Livability +4.5/5.0
- Rent growth +4.1/5.0
- 1% rule +3.6/10.0
- DSCR +3.1/10.0
- Schools +2.5/10.0
- Condition / age +2.5/5.0
- Appreciation +0.0/10.0
$200,000
🖨 Deal sheet (PDF) 📄 Offer letter ✓ Due diligence
Listing remarks MLS
Fabulous Ferndale 3-bedroom bungalow! Covered porch welcomes you into the living room with hardwood floors and coved ceilings. Archway to dining room opens to kitchen with appliances included. Two bedrooms on the main level, plus large upper-level bedroom with cedar closet and built-in shelves! Laundry room off the kitchen has access to the backyard with patio and vinyl privacy fence! New roof 2025! New water heater 2024! Broker owned.
Key facts
- Covered porch
- Cedar closet
- Coved ceilings
Tags
Property features AI
Finance
- HOA & community: Homeowners association present
Exterior
- Utilities: Public water; Public sewer
- Home design: Single-family residence; One and one-half stories; Vinyl siding
- Construction: Vinyl siding construction; Crawl space foundation; Built area above grade approximately 1,000 (finished)
- Exterior features: Patio; Porch; Shed(s); Paved road frontage; Lot approximately 45 x 110
Interior
- Kitchen: Dishwasher; Microwave; Oven; Range; Refrigerator
- Flooring: Hardwood
- Bathrooms: 1 full bathroom
- Heating & cooling: Natural gas heating; Steam heating; Ceiling fans; Wall/window air conditioning
- Interior features: Hardwood flooring; Disposal
- Laundry & utility: Washer; Dryer
Neighborhood map
What this means for you Summary
Snapshot
- This is a 3-bed/1.0-bath single-family listed at $200k.
Deal economics
- At list price, monthly cash flow is $-96 ($-1k/yr) — negative.
- To cash-flow at today's rent, offer at most $183k (8.5% below list).
- To meet the 1% rule (rent ≥ 1% of price), the offer needs to be $171k (14.4% below list).
- Recommended offer: $171k (14.4% below list) — sets the bar for 1% rule.
- Cap rate 5.7% vs local median 4.5% in Ferndale — meaningfully above typical; check what's discounted (condition, days-on-market, listing class) to confirm the premium yield is real.
Location & tenants
- Location reads 90/100 on livability (#8 in MI, #103 nationally) — a professional / high-income tenant draw. Strengths: amenities A+, commute A+, employment A+.
- Ferndale Public Schools (suburban): math 18% / reading 39% proficiency, ranked #366 of 540 in MI (top 68%) — low school quality limits family demand, transient renter base, plan for 1-2y turnover.
- Zoned schools: Ferndale Lower Elementary Campus (476 students, 53% FRL); Ferndale Middle School (math 13% / reading 35%, grade F, #396 of 493 statewide, top 81%, 540 students, 62% FRL); Ferndale High School (math 32% / reading 57%, grade F, #214 of 713 statewide, top 36%, 712 students, 58% FRL).
- Market conditions: Rents rising fast (+6.2%/yr); 179 active listings in the ZIP; 33 comparable units currently listed for rent nearby; rentals at typical pace (median 24d on market — plan ~3-4 weeks tenant-placement turnaround); solid renter incomes; 2,614 units permitted in Oakland County in 2024 (721 in 5+ unit buildings).
Forward outlook
- Local home prices are declining (-3.0%/yr); year-one equity from $1k of loan paydown is wiped out by about $6k of value loss. Plan a longer hold.
- Oakland County population projected at +10% by 2050 — modest demand growth; plan on rents tracking national, not racing it.
Negotiation context
- It's been on market 16 days — a 2% lower offer ($197k) is reasonable based on typical stale-listing flexibility.
- 7 sale attempts since 23y ago with the ask held roughly flat each time — persistent listings suggest the price (not the market) is what's stuck; bring a comps-based counter.
- Current owner paid $150k; 33% above their basis — modest negotiation headroom, anchor on the comps not their cost.
Risks & watch-outs
- Watch-outs: built in 1938 — expect roof / HVAC / electrical / plumbing capex.
- Climate carrying-cost: major flood risk — expect insurance premiums to compound above CPI over the hold.
Questions for the listing agent
- What do current leases actually rent for vs. the listed asking? Can we see a recent rent roll and the last 12 months of T-12 income?
- Built in 1938 — when were the roof, HVAC, electrical panel, plumbing, and water heater last replaced?
- Is there a deadline driving the sale (1031 exchange, divorce, estate, relocation)? That informs how much negotiation room exists.
- Schools are D-rated, which usually means shorter tenancies and higher turnover. Who's the typical renter profile here, and what's been the actual vacancy rate?
- The area grade is low — what's the realistic commute time and amenity access for the typical tenant pool here? Any planned neighborhood developments (good or bad) we should know about?
- What's the average days-on-market for RENTAL listings here right now (not sales)? A rising rental-DOM trend means longer vacancies and softer asking-rent achievability than the comps imply.
- What's the recent tenant-quality profile in this submarket — average credit score on applications, eviction rate, late-payment / NSF rate, and stable-employment percentage? A property-management company in the area should have these aggregated.
- How much new for-sale + rental construction is in the pipeline within 1–3 miles? Heavy new supply typically softens prices + rents 12–24 months out; constrained supply supports both.
Investment metrics
- 1% rule
- 0.86% ✗
- Cap rate
- 5.72%
- Cash-on-cash
- -2.06%
- DSCR
- 0.91
- GRM
- 9.7
CMA / ARV
- ARV (median comp)
- $229,068
- List price
- $200,000
- Delta
- -15.00%
- Verdict
- UNDERPRICED
- Comps
- 20 within 1.0 mi
Show comp detail 12 sales within ~0.75 mi
| Address | Dist | Beds/Ba | Sqft | Sold | Price | $/sf | Match |
|---|---|---|---|---|---|---|---|
| 384 E Chesterfield St | 0.11mi | 3/2.0 | 1,006 (+8%) | 2mo | $252,500 | $251 | 76 |
| 791 Wordsworth St | 0.31mi | 3/1.0 | 1,006 (+8%) | 2mo | $240,000 | $239 | 70 |
| 1491 E Webster St | 0.54mi | 3/1.0 | 908 (-2%) | 2mo | $180,000 | $198 | 70 |
| 321 E Webster St | 0.09mi | 3/2.0 | 1,057 (+14%) | 1mo | $315,000 | $298 | 68 |
| 1448 E Webster St | 0.52mi | 3/1.0 | 985 (+6%) | 0mo | $205,000 | $208 | 65 |
| 404 W Chesterfield St | 0.41mi | 2/1.0 (-1) | 857 (-8%) | 1mo | $215,000 | $251 | 62 |
| 207 W Hazelhurst St | 0.68mi | 2/1.0 (-1) | 974 (+5%) | 5mo | $190,000 | $195 | 51 |
| 486 University St | 0.47mi | 3/2.0 | 1,054 (+14%) | 1mo | $307,000 | $291 | 51 |
| 207 Saint Louis St | 0.62mi | 3/2.0 | 1,014 (+9%) | 2mo | $255,000 | $251 | 50 |
| 292 W Marshall St | 0.72mi | 3/1.0 | 1,000 (+8%) | 5mo | $250,000 | $250 | 50 |
| 918 Saint Louis St | 0.67mi | 2/1.0 (-1) | 1,007 (+8%) | 3mo | $140,000 | $139 | 47 |
| 808 Laprairie St | 0.74mi | 2/1.0 (-1) | 1,050 (+13%) | 2mo | $210,000 | $200 | 37 |
Match score weights: distance 35% · size 25% · config 20% · recency 20%. Top-matched comps best support the ARV.
Projected returns pro-forma
-3.0% appreciation · 6.24% rent growth · sell at horizon
- IRR
- -15.9%
- Equity multiple
- 0.42×
- Total profit
- $-32,701
- Equity at exit
- $29,821
- IRR
- -2.5%
- Equity multiple
- 0.81×
- Total profit
- $-10,821
- Equity at exit
- $17,292
Cash invested: $56,000 (down + closing). Projections, not guarantees.
Landlord ↔ Tenant lean methodology
- Overall (STATE)
- 62 Landlord-Friendly
- State Michigan
- 62 Landlord-Friendly · EVEN
- County
- — inherits STATE
- City
- — inherits STATE
ZIP-level market 48220
- Rents YoY
- 6.2%
- Active inventory
- 179
- Price-to-rent
- 9.7×
Monthly cashflow live
- Estimated rent
- $1,711 high interval (Pro) →
- Mortgage (P&I)
- −$1,049
- Tax from tax record
- −$316 /mo · $3,791/yr
- Insurance
- −$83
- HOA
- −$0
- Vacancy / Maint / Mgmt
- −$359
- Net cashflow
- $-96
Break-even live
Sensitivity live
| Price | -10% $17 | -5% $-39 | +0% $-96 | +5% $-153 | +10% $-209 |
|---|---|---|---|---|---|
| Rent | -10% $-231 | -5% $-164 | +0% $-96 | +5% $-28 | +10% $39 |
| Rate | -1.0pp $5 | -0.5pp $-45 | base $-96 | +0.5pp $-148 | +1.0pp $-201 |
UW: 25.0% down · 7.5% · 30yr · 1.5% tax · 5.0% vac · 8.0% maint · 8.0% mgmt
Financing live
Cash to close
- Down payment
- $50,000
- Closing costs
- $6,000
- Reserves months
- —
- Total cash needed
- —
Loan-product check · same deal, 3 products live
Conventional
25% down · 7.5% · 30yr
- Down + closing
- —
- Monthly P&I
- —
- Monthly cashflow
- —
- DSCR
- —
- Eligible?
- —
Personal DTI + credit; lowest rate.
DSCR
20% down · 8.5% · 30yr
- Down + closing
- —
- Monthly P&I
- —
- Monthly cashflow
- —
- DSCR
- —
- Eligible?
- —
No personal income docs; deal must DSCR.
Hard money
10% down · 12.0% · 12mo
- Down + closing
- —
- Monthly P&I
- —
- Monthly cashflow
- —
- DSCR
- —
- Eligible?
- —
Short-term bridge; refi at stabilization.
Rent comps 33 comps
| Address | Beds | Baths | Sqft | Rent | $/sqft | DOM | Units | Dist |
|---|---|---|---|---|---|---|---|---|
| 790 Jewell St Ferndale, MI | 2.0 | 1.0 | 800 | $1,445 | $1.81 | 26d | 1 | 0.21mi |
| 224 Fielding St Ferndale, MI | 2.0 | 1.0 | 1000 | $1,800 | $1.80 | 26d | 1 | 0.34mi |
| 226 Fielding St Ferndale, MI | 2.0 | 1.0 | 1000 | $1,500 | $1.50 | 26d | 1 | 0.35mi |
| 353 W Webster St Ferndale, MI | 2.0 | 1.0 | 900 | $1,525 | $1.69 | 18d | 1 | 0.46mi |
| 1561 E Webster St Ferndale, MI | 2.0 | 1.0 | 939 | $1,600 | $1.70 | 26d | 1 | 0.58mi |
| 1291 W State Fair Ave Detroit, MI | 1.0–2.0 | 1.0 | 700 | $950 | $1.36 | 14d | 2 | 0.71mi |
| 901 Saint Louis St Unit 901-02 Ferndale, MI | 2.0 | 1.0 | 800 | $1,395 | $1.74 | 26d | 1 | 0.71mi |
| 901 Saint Louis St Ferndale, MI | 2.0 | 1.0 | 800 | $1,395 | $1.74 | 45d | 1 | 0.71mi |
| 22111 Woodward Ave Ferndale, MI | 2.0 | 1.0 | 816 | $3,355 | $4.11 | 18d | 1 | 0.71mi |
| 552 E Saratoga St Unit Upper Unit Ferndale, MI | 2.0 | 1.0 | 700 | $1,300 | $1.86 | 26d | 1 | 0.74mi |
| 20643 Stratford Rd Unit 1 Detroit, MI | 2.0 | 1.5 | 1000 | $1,250 | $1.25 | 45d | 1 | 0.79mi |
| 155 W George Ave Hazel Park, MI | 2.0 | 1.0 | 725 | $1,000 | $1.38 | 26d | 1 | 0.82mi |
| 20129 Stratford Rd Unit 2 Detroit, MI | 2.0 | 1.0 | 1100 | $1,223 | $1.11 | 26d | 1 | 0.89mi |
| 2023 Ardmore Dr Ferndale, MI | 2.0 | 1.0 | 771 | $1,250 | $1.62 | 26d | 1 | 0.91mi |
| 425 Vester St Unit A Ferndale, MI | 2.0 | 1.0 | 525 | $1,349 | $2.57 | 7d | 1 | 0.92mi |
| 90 W Meyers Ave Hazel Park, MI | 2.0 | 1.0 | 831 | $1,800 | $2.17 | 26d | 1 | 0.95mi |
| 851 Gardendale St Ferndale, MI | 2.0 | 1.0 | 933 | $1,625 | $1.74 | 26d | 1 | 0.97mi |
| 501 E Breckenridge St Ferndale, MI | 3.0 | 1.0 | 946 | $1,800 | $1.90 | 26d | 1 | 1.01mi |
| 266 W Goulson Ave Hazel Park, MI | 3.0 | 1.0 | 942 | $1,600 | $1.70 | 23d | 1 | 1.08mi |
| 453 E Cambourne St Unit 1 Ferndale, MI | 2.0 | 1.0 | 1000 | $2,500 | $2.50 | 4d | 1 | 1.08mi |
| 2033 Wrenson St Ferndale, MI | 3.0 | 1.0 | 816 | $1,675 | $2.05 | 0d | 1 | 1.09mi |
| 400 E Cambourne St Unit 1 Ferndale, MI | 2.0 | 1.0 | 1000 | $1,400 | $1.40 | 12d | 1 | 1.09mi |
| 407 E Hayes Ave Hazel Park, MI | 3.0 | 1.0 | 1000 | $1,750 | $1.75 | 26d | 1 | 1.09mi |
| 455 E Cambourne St Unit 2 Ferndale, MI | 2.0 | 1.0 | 900 | $2,400 | $2.67 | 4d | 1 | 1.09mi |
| 695 Livernois St Unit 2 Ferndale, MI | 2.0 | 1.0 | 950 | $2,350 | $2.47 | 6d | 1 | 1.09mi |
| 429 E Milton Ave Hazel Park, MI | 3.0 | 2.0 | 1075 | $1,595 | $1.48 | 1d | 1 | 1.11mi |
| 510 Stratford Rd Ferndale, MI | 2.0 | 1.0 | 965 | $1,750 | $1.81 | 45d | 1 | 1.11mi |
| 578 Kensington Ave Ferndale, MI | 2.0 | 1.0 | 860 | $1,600 | $1.86 | 7d | 1 | 1.17mi |
| 430 W 9 Mile Rd Ferndale, MI | 1.0–2.0 | 2.0 | 826 | $2,827 | $3.42 | 0d | 2 | 1.21mi |
| 20038 Santa Rosa Dr Detroit, MI | 3.0 | 1.0 | 927 | $1,300 | $1.40 | 19d | 1 | 1.25mi |
| 19703 Keating St Highland Park, MI | 3.0 | 1.0 | 1000 | $1,200 | $1.20 | 18d | 1 | 1.30mi |
| 1019 E Hayes Ave Unit 1032331P Hazel Park, MI | 3.0 | 1.0 | 1033 | $5,281 | $5.11 | 0d | 1 | 1.44mi |
| 1800 Browning St Ferndale, MI | 2.0 | 1.0 | 809 | $1,600 | $1.98 | 7d | 1 | 1.49mi |
Listing history 27 events
-
2026-06-21days on market $200,000 Active 16 DOM
-
2026-06-18days on market $200,000 Active 13 DOM
-
2026-06-17days on market $200,000 Active 12 DOM
-
2026-06-16days on market $200,000 Active 11 DOM
-
2026-06-15days on market $200,000 Active 10 DOM
-
2026-06-13days on market $200,000 Active 8 DOM
-
2026-06-13days on market $200,000 Active 7 DOM
-
2026-06-09days on market $200,000 Active 4 DOM
-
2026-06-08days on market $200,000 Active 3 DOM
-
2026-06-07remarks 442-char remark
-
2026-06-07pricestatusdays on market $200,000 Active 2 DOM
-
2026-04-28$194,711 Active 451-char remark
-
2026-04-28$194,711 Active 451-char remark
-
2021-04-30soldstatus $150,000 Sold
-
2021-04-30soldstatus $150,000 Closed
-
2021-03-28status Pending
-
2021-03-28status Pending
-
2021-03-25$139,900 Active
-
2021-03-25$139,900 Active
-
2021-03-18historical $139,900
-
2021-03-18historical $139,900
-
2003-12-29soldstatus $94,000
-
2003-10-24soldstatus $94,000
-
2003-10-22historical
-
2003-08-18$95,000
-
1988-05-01soldstatus $33,500
-
1978-09-01soldstatus $19,900
ⓘ Source: listings_history table (triggers on properties + properties_extension) + one-shot
backfill from property_details.listing_events for pre-trigger history.
Tax reassessment forecast MI · Partial reset (capped growth)
- Current annual tax
- $3,791 · $316/mo
- Projected year-2 tax
- $3,791 · $316/mo
- Expected delta
- $0/yr ($0/mo · 0.0%)
ⓘ Screening estimate from a state-policy table — verify with the county assessor before closing.
Climate risk First Street
- Flood 6/10 Major FEMA zone X (unshaded) · 69% chance over 30 yrs
- Wildfire 1/10 Low
- Heat 2/10 Low 7 d/yr ≥97°F today · 14 d/yr by 30 yrs out
- Wind 2/10 Low
- Air quality 4/10 Moderate 4 unhealthy d/yr today · 6 by 30 yrs out
Nearby sold comps map
Loading sold comps map…
Walkable amenities ~0.75 mi
Loading nearby amenities…
Taxation est. · year 1
- Rental income
- $20,536
- − Mortgage interest
- −$11,203
- − Property taxes
- −$3,791
- − Insurance
- −$1,000
- − Repairs & maintenance
- −$1,643
- − Management
- −$1,643
- − Depreciation
- −$5,818
- Taxable loss
- −$4,562
- Est. tax savings @ 24.0%
- +$1,095
- After-tax cash flow
- $-58/yr
For passive investors: Depreciation is non-cash, so a rental often shows a tax loss while cash-flowing — sheltering income. Rental losses are passive: they offset passive income freely, and up to $25,000/yr can offset ordinary (W-2) income if you actively participate and your MAGI is under $100k (phasing out to $0 by $150k); unused losses carry forward. On sale, claimed depreciation is recaptured at up to 25%, and gains may owe capital-gains tax (a 1031 exchange can defer both). Figures are a year-1 estimate at your 24.0% rate — not tax advice; consult a CPA.
Schools (NCES district)
- District
- Ferndale Public Schools
- NCES district ID
- 2614280
- Math proficiency
- 18% ▼ -3.00%
- Reading proficiency
- 39% ▲ 5.00%
- Median HH income
- $56,069
- Composite
- 25.46/100
- National rank
- #7449
- State rank
- #366 of 540 in MI
Livability — Ferndale
- Score
- 90/100
- State rank
- #8
- US rank
- #103
Category grades
Schools grade is shown separately in the Schools card above.
Census & demographics
- Census place
- Ferndale, MI
- County
- Oakland County · 1,009,092 people
- City population
- 21,527
- Metro
- Detroit-Warren-Dearborn, MI
- Population (ZIP)
- 21,527
- Household income
- $89,881
- Rent vs Own
- Severe rent burden
- 670.0
Population outlook (Oakland County) Hauer SSP2
- Today (2025)
- 1,335,747 people
- By 2030
- 1,375,100 · +2.9%
- By 2040
- 1,435,385 · +7.5%
- By 2050
- 1,469,250 · +10.0%
- By 2075
- 1,531,946 · +14.7%
- By 2100
- 1,450,485 · +8.6%
Race, ethnicity, and origin ACS 2023
- Neighborhood character
- Predominantly White (72%)
- Race & ethnicity
- White 72% Black 15% Two or more races 6% Hispanic / Latino 5% Asian 3%
- Common ancestry
- Romanian 11% Lithuanian 6% Slovak 3%
- Foreign-born
- 4% · Canada, South Korea
- Languages at home
- 95% English-only · Spanish 2% Other Indo-European 1% German/W. Germanic 1%
Political lean MEDSL · Oakland
- 2024 margin
- D (+10.6) · D 54.4% · R 43.8% · Other 1.9%
- 2008→2024 swing
- -3.9pp toward R · 2008: 14.5pp · 2024: 10.6pp
- All cycles
- 2024: D+10.6 2020: D+14.1 2016: D+8.1 2012: D+8.1 2008: D+14.5
Not yet ingested
- Civics
- —
Market trends
- HPI YoY
- ▼ -394.92%
- Current HPI
- 273.0986
- Rent YoY
- ▲ 6.24%
- Metro
- Detroit-Warren-Dearborn, MI
- State GDP YoY
- ▲ 1.37%
- F500 in state
- 28
Industry mix (Fortune 500 HQ in MI)
| Industry | F500 HQs | Revenue |
|---|---|---|
| Automotive Parts | 3 | $48B |
|
||
| Automotive | 2 | $372B |
|
||
| Chemicals | 1 | $45B |
|
||
| Automotive Retail | 1 | $29B |
|
||
| Healthcare / Medical Devices | 1 | $23B |
|
||
| Automotive Technology | 1 | $20B |
|
||
Price history
+905.0% since first listed20 events — show timeline
- 2026-06-05 Listed $200,000 MiRealSource-MiMLS
- 2026-06-05 Listed $200,000 REALCOMP
- 2026-05-23 Listing Removed — REALCOMP
- 2026-05-23 Listing Removed — MiRealSource-MiMLS
- 2026-04-28 Listed $194,711 REALCOMP
- 2026-04-28 Listed $194,711 MiRealSource-MiMLS
- 2021-04-30 Sold (MLS) $150,000 MiRealSource-MiMLS
- 2021-04-30 Sold (MLS) $150,000 REALCOMP
- 2021-03-28 Pending — MiRealSource-MiMLS
- 2021-03-28 Pending — REALCOMP
- 2021-03-25 Listed $139,900 MiRealSource-MiMLS
- 2021-03-25 Listed $139,900 REALCOMP
- 2021-03-18 Coming Soon $139,900 MiRealSource-MiMLS
- 2021-03-18 Coming Soon $139,900 REALCOMP
- 2003-12-29 Sold (Public Records) $94,000 Public Records
- 2003-10-24 Sold (MLS) $94,000 MiRealSource-MiMLS
- 2003-10-22 Listing Removed — MiRealSource-MiMLS
- 2003-08-18 Listed $95,000 MiRealSource-MiMLS
- 1988-05-01 Sold (Public Records) $33,500 Public Records
- 1978-09-01 Sold (Public Records) $19,900 Public Records
Property tax history
+9.1%/yrLatest (2025): $3,791 · +1.4% YoY. Source: county tax records.
Cash-flow waterfall
monthlySold comps — $/sqft
last 12 mo · ≤1 miLoading sold comps…