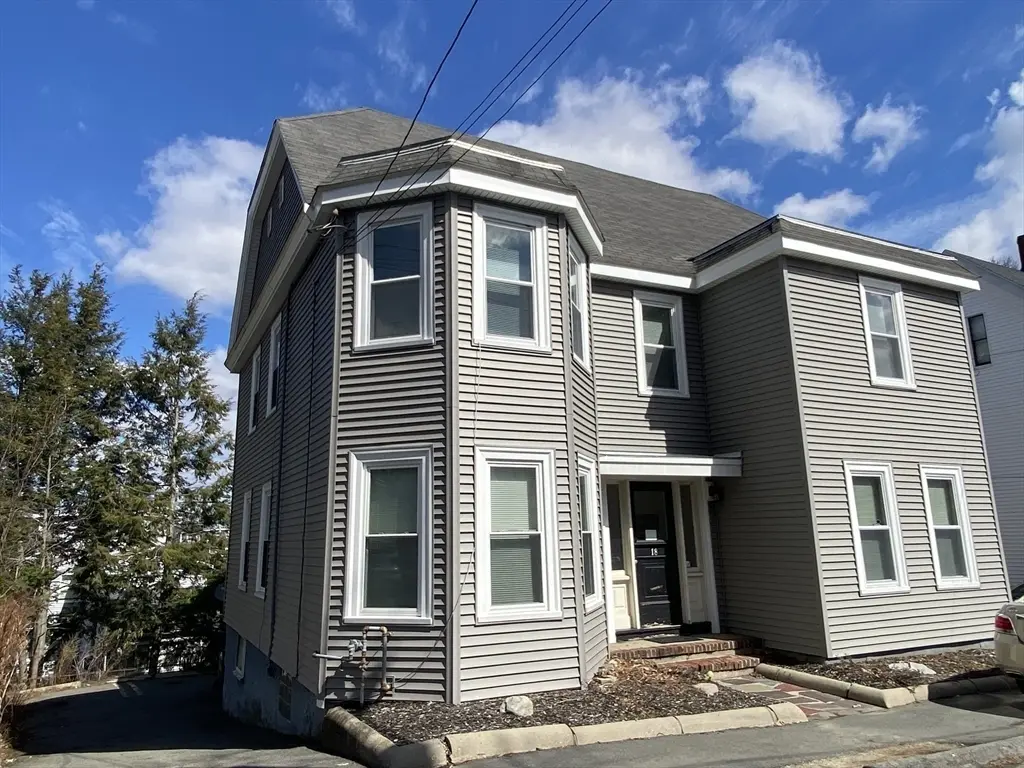
 Fourplex
18-20 North High St · Melrose, MA
Flood risk 1/10 · Minimal
- FEMA flood zone
- X (unshaded)
- Chance of flooding over 30 yrs
- 0.0%
- Est. flood insurance / yr
- $473 – $860
Fire risk 2/10 · Minimal
- Est. fire insurance / yr
- $915 – $1,699
Heat risk 6/10 · Moderate
- Hot days now (above 96°F)
- 7 days/yr
- Hot days in 30 yrs
- 15 days/yr
Wind risk 6/10 · Moderate
- Chance of severe wind over 30 yrs
- 60.0%
Air-quality risk 3/10 · Minor
- Unhealthy air days now
- 2 days/yr
- Unhealthy air days in 30 yrs
- 3 days/yr
Risk factors via First Street. Map © Google.
Why this score? — see what drove the F grade
The composite is a weighted blend of 9 inputs, each scored 0–100. Each bar is that input's sub-score; the figure is the points it added to the 100-point composite (weight × sub-score).
- ARV discount +7.5/15.0
- Cash flow +7.0/30.0
- Schools +5.3/10.0
- Livability +4.5/5.0
- Condition / age +4.0/5.0
- Rent growth +3.2/5.0
- 1% rule +1.9/10.0
- DSCR +1.2/10.0
- Appreciation +0.0/10.0
$1,585,000
🖨 Deal sheet 📄 Offer letter ✓ Due diligence
Multi-family units
County records classify this as Multi-Family (2-4 Unit). Listing-text estimate: 4 units. confirmed
Listing remarks MLS
4 good sized units. Large rooms with high ceilings. 4200 square feet of living area. all units appear to be in decent condition. 1 car off street parking per unit. 3/10 of a mile to the train station. rents include water and sewer. all other utilities are separate for each unit. coin operated washer and dryer in basement. 1/2 mile to Main Street.
Key facts
- Utilities separated
- 4,752 sq ft lot
- 4 parking spots
Tags
Property features AI
Finance
- Financial info: Property operates as a multi-family building with four leased units
- HOA & community: Access to community amenities including public transportation, shopping, pool, tennis courts, park, medical facility, laundromat, conservation area, private and public schools; Not a senior community
Exterior
- Parking: Paved off-street parking; 4 open parking spaces
- Utilities: Public water; Public sewer
- Home design: 4-family property; 5 total stories; Approximately 4,154 sq ft building area
- Construction: Frame and stone construction; Stone foundation; Approximate year built (public records)
- Exterior features: Shingle roof; Composite deck; Deck; Gentle sloping lot; Paved public road frontage
Interior
- Kitchen: Range; Range hood; Dishwasher; Refrigerator; Disposal
- Flooring: Hardwood floors
- Bathrooms: Four full bathrooms
- Heating & cooling: Baseboard heating; Natural gas heating; Unit-controlled heating
- Interior features: Total of 17 rooms; Remodeled sections; Pantry; Built-in storage; Living room; Bathroom with tub and shower; Box/bay/bow windows
Neighborhood map
What this means for you Summary
Snapshot
- This is a 3×1bd/1.0ba + 1×3bd/1.0ba units multifamily listed at $1.58M. Condition is rated good.
Deal economics
- At list price, monthly cash flow is $-2k ($-28k/yr) — negative. Per door: $-575/mo.
- To cash-flow at today's rent, offer at most $1.25M (21.0% below list).
- To meet the 1% rule (rent ≥ 1% of price), the offer needs to be $1.10M (30.9% below list).
- Recommended offer: $1.10M (30.9% below list) — sets the bar for 1% rule.
- Cap rate 4.6% vs local median 2.3% in Melrose — top-decile yield for the area; either an underpriced asset or a hidden risk that comps aren't pricing in. Stress-test before assuming the spread holds.
Location & tenants
- Location reads 89/100 on livability (#3 in MA, #147 nationally) — a professional / high-income tenant draw. Strengths: crime A+, amenities A+, commute A+; Watch: cost of living F.
- Melrose (suburban): math 53% / reading 64% proficiency, ranked #71 of 302 in MA (top 24%) — acceptable for families but not a draw, mixed tenant base, ~2y average lease; only 13% free/reduced lunch — higher-income household profile.
- Zoned schools: Melrose High (math 61% / reading 77%, grade B, #90 of 343 statewide, top 27%, 926 students, 0% FRL).
- Market conditions: Rents rising (+2.9%/yr); 30 active listings in the ZIP; high-income renter base; 3,670 units permitted in Middlesex County in 2024 (2,611 in 5+ unit buildings).
- At $10,954/mo this rent would consume 98% of the median local household income ($134k/yr) (locally 959% of renters already pay >50% of income on rent) — very limited rent-growth headroom before tenants either downsize or default.
Forward outlook
- Local home prices are declining (-3.0%/yr); year-one equity from $11k of loan paydown is wiped out by about $48k of value loss. Plan a longer hold.
- Middlesex County population projected at +20% by 2050 — long-run rental-demand tailwind backs the buy-and-hold thesis.
Negotiation context
- Only 14 days on market — expect competitive offers; lowballing is unlikely to land.
- 4 sale attempts since 17y ago with the ask held roughly flat each time — persistent listings suggest the price (not the market) is what's stuck; bring a comps-based counter.
- Current owner paid $620k; list at $1.58M implies a 156% gain — meaningful room to come down on a strong offer.
Risks & watch-outs
- Watch-outs: built in 1900 — expect roof / HVAC / electrical / plumbing capex.
- Climate carrying-cost: major wind risk, 60% chance of damaging wind over 30y; extreme-heat days projected 7→15/yr by 2055 (HVAC capex compounding) — expect insurance premiums to compound above CPI over the hold.
Questions for the listing agent
- What do current leases actually rent for vs. the listed asking? Can we see a recent rent roll and the last 12 months of T-12 income?
- Can we see the unit-by-unit rent roll, current vacancy, and any below-market leases? What's the average tenancy length?
- What capital expenditures (roof, boiler, parking lot, exteriors) have been made in the last 5 years, and what's planned in the next 2?
- Built in 1900 — when were the roof, HVAC, electrical panel, plumbing, and water heater last replaced?
- Is there a deadline driving the sale (1031 exchange, divorce, estate, relocation)? That informs how much negotiation room exists.
- Schools are A-rated — typically a magnet for longer-tenancy family renters. What's the average tenant stay here, and is there a school-zone premium baked into asking?
- The area grade is low — what's the realistic commute time and amenity access for the typical tenant pool here? Any planned neighborhood developments (good or bad) we should know about?
- What's the average days-on-market for RENTAL listings here right now (not sales)? A rising rental-DOM trend means longer vacancies and softer asking-rent achievability than the comps imply.
- What's the recent tenant-quality profile in this submarket — average credit score on applications, eviction rate, late-payment / NSF rate, and stable-employment percentage? A property-management company in the area should have these aggregated.
- How much new apartment / multifamily construction is in the pipeline within 1–3 miles? Heavy new supply (>2% of stock underway) typically softens rents 12–24 months out; light construction supports rent growth.
Investment metrics
- 1% rule
- 0.69% ✗
- Cap rate
- 4.55%
- Cash-on-cash
- -6.22%
- DSCR
- 0.72
- GRM
- 12.1
CMA / ARV
No comps found within radius.
Projected returns pro-forma
-3.0% appreciation · 2.94% rent growth · sell at horizon
- IRR
- -27.1%
- Equity multiple
- 0.09×
- Total profit
- $-403,817
- Equity at exit
- $236,329
- IRR
- -25.0%
- Equity multiple
- -0.22×
- Total profit
- $-542,294
- Equity at exit
- $137,042
Cash invested: $443,800 (down + closing). Projections, not guarantees.
Landlord ↔ Tenant lean methodology
- Overall (STATE)
- 20 Strongly Tenant-Friendly
- State Massachusetts
- 20 Strongly Tenant-Friendly · D+15
- County
- — inherits STATE
- City
- — inherits STATE
ZIP-level market 02176
- Rents YoY
- 2.9%
- Active inventory
- 30
- Price-to-rent
- 49.9×
Monthly cashflow live
- Estimated rent
- $10,954 high interval (Pro) →
- Mortgage (P&I)
- −$8,312
- Tax est. 1.5%
- −$1,981 /mo · $23,775/yr
- Insurance
- −$660
- HOA
- −$0
- Vacancy / Maint / Mgmt
- −$2,300
- Net cashflow
- $-2,300
Break-even live
4-unit breakdown (identical units grouped — click to expand)
| Units | Beds | Baths | Est. rent |
|---|---|---|---|
| 3× units | 1 | 1 | $7,938 |
| #1 | 1 | 1 | $2,646 |
| #2 | 1 | 1 | $2,646 |
| #3 | 1 | 1 | $2,646 |
| 1× unit | 3 | 1 | $3,016 |
| Total (4 units) | $10,954 | ||
UW: 25.0% down · 7.5% · 30yr · 1.5% tax · 5.0% vac · 8.0% maint · 8.0% mgmt
Financing live
Cash to close
- Down payment
- $396,250
- Closing costs
- $47,550
- Reserves months
- —
- Total cash needed
- —
Loan-product check · same deal, 3 products live
Conventional
25% down · 7.5% · 30yr
- Down + closing
- —
- Monthly P&I
- —
- Monthly cashflow
- —
- DSCR
- —
- Eligible?
- —
Personal DTI + credit; lowest rate.
DSCR
20% down · 8.5% · 30yr
- Down + closing
- —
- Monthly P&I
- —
- Monthly cashflow
- —
- DSCR
- —
- Eligible?
- —
No personal income docs; deal must DSCR.
Hard money
10% down · 12.0% · 12mo
- Down + closing
- —
- Monthly P&I
- —
- Monthly cashflow
- —
- DSCR
- —
- Eligible?
- —
Short-term bridge; refi at stabilization.
Listing history 9 events
-
2026-06-18days on market $1,585,000 Active 14 DOM
-
2026-06-17days on market $1,585,000 Active 13 DOM
-
2026-06-16days on market $1,585,000 Active 12 DOM
-
2026-06-15days on market $1,585,000 Active 11 DOM
-
2026-06-13days on market $1,585,000 Active 9 DOM
-
2026-06-09days on market $1,585,000 Active 5 DOM
-
2026-06-08statusdays on market $1,585,000 Active 4 DOM
-
2026-06-07remarks 699-char remark
-
2026-06-07$1,585,000 New 3 DOM
ⓘ Source: listings_history table (triggers on properties + properties_extension) + one-shot
backfill from property_details.listing_events for pre-trigger history.
Climate risk First Street
- Flood 1/10 Low FEMA zone X (unshaded) · 0% chance over 30 yrs
- Wildfire 2/10 Low
- Heat 6/10 Major 7 d/yr ≥96°F today · 15 d/yr by 30 yrs out
- Wind 6/10 Major 60% chance of damaging wind over 30 yrs
- Air quality 3/10 Moderate 2 unhealthy d/yr today · 3 by 30 yrs out
Nearby sold comps map
Loading sold comps map…
Walkable amenities ~0.75 mi
Loading nearby amenities…
Taxation est. · year 1
- Rental income
- $131,448
- − Mortgage interest
- −$88,785
- − Property taxes
- −$23,775
- − Insurance
- −$7,925
- − Repairs & maintenance
- −$10,516
- − Management
- −$10,516
- − Depreciation
- −$46,109
- Taxable loss
- −$56,177
- Est. tax savings @ 24.0%
- +$13,483
- After-tax cash flow
- $-14,116/yr
For passive investors: Depreciation is non-cash, so a rental often shows a tax loss while cash-flowing — sheltering income. Rental losses are passive: they offset passive income freely, and up to $25,000/yr can offset ordinary (W-2) income if you actively participate and your MAGI is under $100k (phasing out to $0 by $150k); unused losses carry forward. On sale, claimed depreciation is recaptured at up to 25%, and gains may owe capital-gains tax (a 1031 exchange can defer both). Figures are a year-1 estimate at your 24.0% rate — not tax advice; consult a CPA.
Condition & rehab AI · 13 photos
This four-family property is in good condition with recent cosmetic upgrades, making it a solid investment opportunity.
Value-add opportunities
- Both landscaping — improve curb appeal and increase rental value
- Both exterior paint — enhance curb appeal and increase resale value
Renovation cost estimate screening
Value-add ROI direction
- Both landscaping — improve curb appeal and increase rental value ↑
- Both exterior paint — enhance curb appeal and increase resale value ↑
ⓘ Cost ranges are severity-bucket heuristics (US national rule-of-thumb). Get contractor quotes + a written scope before underwriting a rehab budget.
Schools (NCES district)
- District
- Melrose
- NCES district ID
- 2507620
- Math proficiency
- 53% ▼ -13.00%
- Reading proficiency
- 64% ▼ -10.00%
- Median HH income
- $86,560
- Composite
- 53.29/100
- National rank
- #1485
- State rank
- #71 of 302 in MA
Livability — Melrose
- Score
- 89/100
- State rank
- #3
- US rank
- #147
Category grades
Schools grade is shown separately in the Schools card above.
Census & demographics
- Census place
- Melrose, MA
- County
- Middlesex County · 1,437,704 people
- City population
- 29,650
- Metro
- Boston-Cambridge-Newton, MA-NH
- Population (ZIP)
- 29,650
- Household income
- $133,953
- Rent vs Own
- Severe rent burden
- 959.0
Population outlook (Middlesex County) Hauer SSP2
- Today (2025)
- 1,740,269 people
- By 2030
- 1,817,187 · +4.4%
- By 2040
- 1,963,195 · +12.8%
- By 2050
- 2,087,461 · +20.0%
- By 2075
- 2,344,036 · +34.7%
- By 2100
- 2,383,776 · +37.0%
Race, ethnicity, and origin ACS 2023
- Neighborhood character
- Predominantly White (77%)
- Race & ethnicity
- White 77% Asian 10% Two or more races 7% Hispanic / Latino 6% Black 2%
- Hispanic origin (detail)
- Common ancestry
- Romanian 4% Lithuanian 2% Slovak 2%
- Foreign-born
- 16% · Canada, China, Jamaica
- Languages at home
- 79% English-only · Spanish 5% Other Indo-European 5% Chinese 3%
Political lean MEDSL · Middlesex
- 2024 margin
- Solid D (+39.5) · D 68.5% · R 29.0% · Other 2.5%
- 2008→2024 swing
- +9.3pp toward D · 2008: 30.1pp · 2024: 39.5pp
- All cycles
- 2024: D+39.5 2020: D+45.2 2016: D+38.1 2012: D+26.9 2008: D+30.1
Not yet ingested
- Civics
- —
Market trends
- HPI YoY
- ▼ -489.80%
- Current HPI
- 321.0232
- Rent YoY
- ▲ 2.94%
- Metro
- Boston-Cambridge-Newton, MA-NH
- State GDP YoY
- ▲ 2.28%
- F500 in state
- 38
Industry mix (Fortune 500 HQ in MA)
| Industry | F500 HQs | Revenue |
|---|---|---|
| Technology | 3 | $17B |
|
||
| Insurance | 2 | $84B |
|
||
| Retail | 2 | $76B |
|
||
| Life Sciences | 1 | $43B |
|
||
| Energy Technology | 1 | $31B |
|
||
| Aerospace / Defense | 1 | $18B |
|
||
Price history
+230.3% since first listed10 events — show timeline
- 2026-06-04 Listed $1,585,000 MLS PIN
- 2026-04-13 Rental Removed $2,050 LISTANZA
- 2026-03-12 Listed for Rent $2,050 LISTANZA
- 2015-07-10 Sold (MLS) $620,000 MLS PIN
- 2015-05-14 Pending — MLS PIN
- 2015-05-06 Listed $640,000 MLS PIN
- 2009-04-16 Listing Removed — MLS PIN
- 2009-04-15 Sold (MLS) $460,000 MLS PIN
- 2009-03-14 Contingent — MLS PIN
- 2009-02-10 Listed $479,900 MLS PIN
Cash-flow waterfall
monthlySold comps — $/sqft
last 12 mo · ≤1 miLoading sold comps…