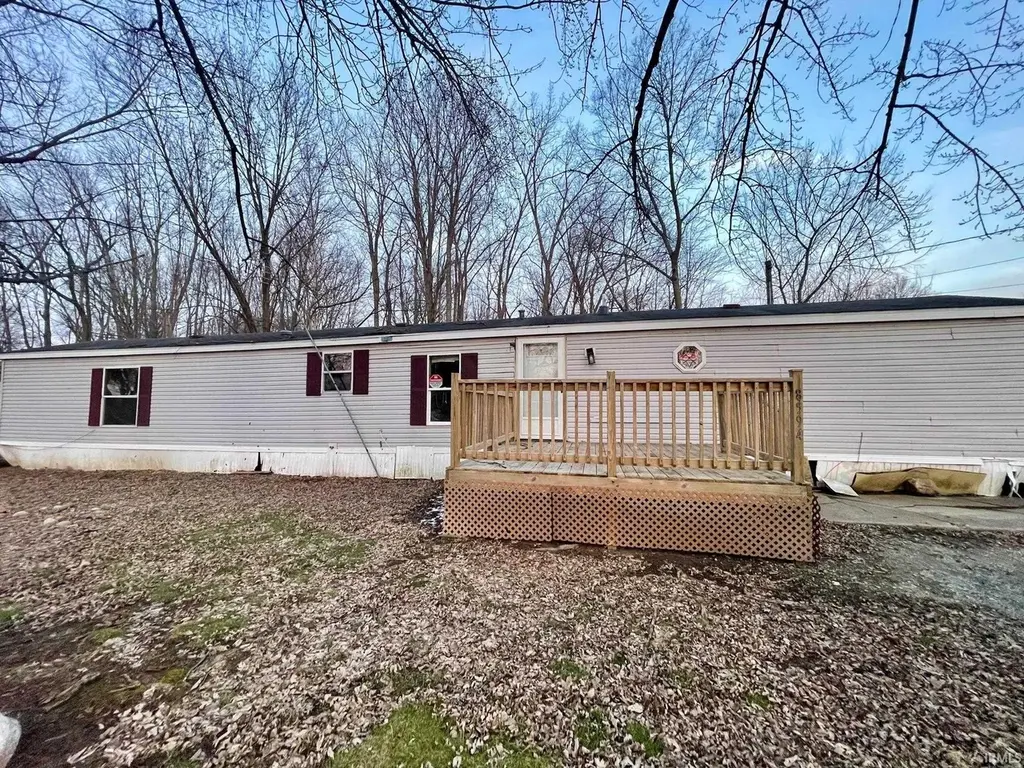
8594 S Yellow View Ln · Beaver Dam, IN
Flood risk 1/10 · Minimal
- FEMA flood zone
- X (unshaded)
- Chance of flooding over 30 yrs
- 0.0%
- Est. flood insurance / yr
- $507 – $1,088
Fire risk 1/10 · Minimal
- Est. fire insurance / yr
- $717 – $1,331
Heat risk 2/10 · Minimal
- Hot days now (above 100°F)
- 7 days/yr
- Hot days in 30 yrs
- 16 days/yr
Wind risk 2/10 · Minimal
- Chance of severe wind over 30 yrs
- —
Air-quality risk 3/10 · Minor
- Unhealthy air days now
- 2 days/yr
- Unhealthy air days in 30 yrs
- 3 days/yr
Risk factors via First Street. Map © Google.
Why this score? — see what drove the B+ grade
The composite is a weighted blend of 9 inputs, each scored 0–100. Each bar is that input's sub-score; the figure is the points it added to the 100-point composite (weight × sub-score).
- Cash flow +30.0/30.0
- 1% rule +10.0/10.0
- DSCR +10.0/10.0
- Appreciation +10.0/10.0
- ARV discount +7.5/15.0
- Schools +3.5/10.0
- Rent growth +2.5/5.0
- Livability +2.5/5.0
- Condition / age +2.5/5.0
$69,000
🖨 Deal sheet (PDF) 📄 Offer letter ✓ Due diligence
Listing remarks
Located in the heart of Claypool. 3 bedroom, 2 bathroom home offers small-town charm, a functional layout, and convenient access to Yellow Creek Lake- All at a price that leaves room to make it your own. This home has solid bones and generous living spaces, and it's ready for someone with vision to bring the updates and personal style. Practical floorplan. Natural lighting. Spacious bedrooms. Ideal for everyday living or a weekend retreat. This home is waiting for you to customize it and make it yours. Yellow Creek Lake is approx. 155 acres. 31-67 ft depth, excellent fishing (bluegill, largemouth bass, black crappie, yellow perch, and more), quiet boating, kayaking, peaceful natural views.
Key facts
- Yellow creek lake
- Quiet boating
- Excellent fishing
Tags
Property features AI
Exterior
- Utilities: Private well water; Septic tank
- Home design: Manufactured home (residential); Vinyl siding
- Construction: Vinyl siding construction; Above-grade finished living area of 1,216
- Exterior features: Lake privileges on Yellow Creek Lake
Interior
- Bathrooms: Two full bathrooms; Both full bathrooms are on the main level
- Heating & cooling: Forced-air heating; No cooling
- Interior features: Gas water heater
- Laundry & utility: Laundry on the main level
Neighborhood map
What this means for you Summary
Snapshot
- This is a 3-bed/2.0-bath manufactured listed at $69k.
Deal economics
- At list price, monthly cash flow is $533 ($6k/yr) — positive.
- The deal already cash-flows at list — no discount required.
- Meets the 1% rule at list price ($1k rent vs $69k).
- Recommended offer: $67k (3.0% below list) — sets the bar for market timing.
Location & tenants
- Location reads: area grade B — affects rentability + tenant quality, not the cash-flow math above.
- Tippecanoe Valley School Corporation (rural): math 40% / reading 42% proficiency, ranked #126 of 301 in IN (top 42%) — families likely to look elsewhere, expect single-tenant / working-renter base with shorter leases.
- Zoned schools: Mentone Elementary School (math 52% / reading 37%, grade F, #379 of 994 statewide, top 41%, 440 students, 54% FRL).
- Market conditions: 10 active listings in the ZIP; 261 units permitted in Kosciusko County in 2024 (10 in 5+ unit buildings).
Forward outlook
- In year one you build about $7k of equity ($477 loan paydown + $7k appreciation (10.0% local appreciation)).
- Kosciusko County population projected at +3% by 2050 — modest demand growth; plan on rents tracking national, not racing it.
- At projected returns (10.0% appreciation + 3.0% rent growth), your $19k cash investment doubles in ~2 years — after that, you're playing with house money.
- By year 5, paydown + projected appreciation supports a ~$34k cash-out refi (75% LTV) — recoverable capital for the next deal without selling this one.
Negotiation context
- It's been on market 41 days — a 3% lower offer ($67k) is reasonable based on typical stale-listing flexibility.
Questions for the listing agent
- It's been on market 41 days. Have you received any prior offers? Is the seller open to a 3% concession, seller financing, or rate buy-down credit?
- Is there a deadline driving the sale (1031 exchange, divorce, estate, relocation)? That informs how much negotiation room exists.
- What's the average days-on-market for RENTAL listings here right now (not sales)? A rising rental-DOM trend means longer vacancies and softer asking-rent achievability than the comps imply.
- What's the recent tenant-quality profile in this submarket — average credit score on applications, eviction rate, late-payment / NSF rate, and stable-employment percentage? A property-management company in the area should have these aggregated.
- How much new for-sale + rental construction is in the pipeline within 1–3 miles? Heavy new supply typically softens prices + rents 12–24 months out; constrained supply supports both.
Investment metrics
- 1% rule
- 1.85% ✓
- Cap rate
- 15.56%
- Cash-on-cash
- 33.11%
- DSCR
- 2.47
- GRM
- 4.5
CMA / ARV
No comps found within radius.
Projected returns pro-forma
10.0% appreciation · 3.0% rent growth · sell at horizon
- IRR
- 49.6%
- Equity multiple
- 4.70×
- Total profit
- $71,551
- Equity at exit
- $62,161
- IRR
- 43.3%
- Equity multiple
- 10.53×
- Total profit
- $184,045
- Equity at exit
- $134,052
Cash invested: $19,320 (down + closing). Projections, not guarantees.
Landlord ↔ Tenant lean methodology
- Overall (STATE)
- 90 Strongly Landlord-Friendly
- State Indiana
- 90 Strongly Landlord-Friendly · R+11
- County
- — inherits STATE
- City
- — inherits STATE
ZIP-level market 46539
- Home prices YoY
- 12.4%
- Active inventory
- 10
- Price-to-rent
- 4.5×
Monthly cashflow live
- Estimated rent
- $1,278 medium interval (Pro) →
- Mortgage (P&I)
- −$362
- Tax est. 1.5%
- −$86 /mo · $1,035/yr
- Insurance
- −$29
- HOA
- −$0
- Vacancy / Maint / Mgmt
- −$268
- Net cashflow
- $533
Break-even live
Sensitivity live
| Price | -10% $581 | -5% $557 | +0% $533 | +5% $509 | +10% $485 |
|---|---|---|---|---|---|
| Rent | -10% $432 | -5% $483 | +0% $533 | +5% $584 | +10% $634 |
| Rate | -1.0pp $568 | -0.5pp $551 | base $533 | +0.5pp $515 | +1.0pp $497 |
UW: 25.0% down · 7.5% · 30yr · 1.5% tax · 5.0% vac · 8.0% maint · 8.0% mgmt
Financing live
Cash to close
- Down payment
- $17,250
- Closing costs
- $2,070
- Reserves months
- —
- Total cash needed
- —
Loan-product check · same deal, 3 products live
Conventional
25% down · 7.5% · 30yr
- Down + closing
- —
- Monthly P&I
- —
- Monthly cashflow
- —
- DSCR
- —
- Eligible?
- —
Personal DTI + credit; lowest rate.
DSCR
20% down · 8.5% · 30yr
- Down + closing
- —
- Monthly P&I
- —
- Monthly cashflow
- —
- DSCR
- —
- Eligible?
- —
No personal income docs; deal must DSCR.
Hard money
10% down · 12.0% · 12mo
- Down + closing
- —
- Monthly P&I
- —
- Monthly cashflow
- —
- DSCR
- —
- Eligible?
- —
Short-term bridge; refi at stabilization.
Listing history 10 events
-
2026-06-12statusdays on market $69,000 Pending 41 DOM
-
2026-06-09days on market $69,000 Active 39 DOM
-
2026-06-08days on market $69,000 Active 38 DOM
-
2026-06-07days on market $69,000 Active 37 DOM
-
2026-06-05days on market $69,000 Active 34 DOM
-
2026-06-02days on market $69,000 Active 32 DOM
-
2026-06-01days on market $69,000 Active 31 DOM
-
2026-05-31days on market $69,000 Active 30 DOM
-
2026-05-30days on market $69,000 Active 29 DOM
-
2026-05-01$69,000 Active 750-char remark
ⓘ Source: listings_history table (triggers on properties + properties_extension) + one-shot
backfill from property_details.listing_events for pre-trigger history.
Climate risk First Street
- Flood 1/10 Low FEMA zone X (unshaded) · 0% chance over 30 yrs
- Wildfire 1/10 Low
- Heat 2/10 Low 7 d/yr ≥100°F today · 16 d/yr by 30 yrs out
- Wind 2/10 Low
- Air quality 3/10 Moderate 2 unhealthy d/yr today · 3 by 30 yrs out
Nearby sold comps map
Loading sold comps map…
Walkable amenities ~0.75 mi
Loading nearby amenities…
Taxation est. · year 1
- Rental income
- $15,341
- − Mortgage interest
- −$3,865
- − Property taxes
- −$1,035
- − Insurance
- −$345
- − Repairs & maintenance
- −$1,227
- − Management
- −$1,227
- − Depreciation
- −$2,007
- Taxable income
- $5,634
- Est. tax owed @ 24.0%
- −$1,352
- After-tax cash flow
- $5,045/yr
For passive investors: Depreciation is non-cash, so a rental often shows a tax loss while cash-flowing — sheltering income. Rental losses are passive: they offset passive income freely, and up to $25,000/yr can offset ordinary (W-2) income if you actively participate and your MAGI is under $100k (phasing out to $0 by $150k); unused losses carry forward. On sale, claimed depreciation is recaptured at up to 25%, and gains may owe capital-gains tax (a 1031 exchange can defer both). Figures are a year-1 estimate at your 24.0% rate — not tax advice; consult a CPA.
Schools (NCES district)
- District
- Tippecanoe Valley School Corporation
- NCES district ID
- 1811370
- Math proficiency
- 40% ▼ -9.00%
- Reading proficiency
- 42% ▼ -5.00%
- Median HH income
- $49,697
- Composite
- 35.29/100
- National rank
- #4969
- State rank
- #126 of 301 in IN
Livability — Beaver Dam
No livability data for this city. (Only ~50 U.S. cities are tracked.)
Census & demographics
- Population (ZIP)
- 2,570
Population outlook (Kosciusko County) Hauer SSP2
- Today (2025)
- 81,747 people
- By 2030
- 82,878 · +1.4%
- By 2040
- 84,270 · +3.1%
- By 2050
- 84,191 · +3.0%
- By 2075
- 82,918 · +1.4%
- By 2100
- 74,808 · -8.5%
Race, ethnicity, and origin ACS 2023
- Neighborhood character
- Predominantly White (91%)
- Race & ethnicity
- White 91% Hispanic / Latino 8% Two or more races 1%
- Hispanic origin (detail)
- Mexican 7%
- Common ancestry
- Slovak 7% Romanian 4% Iranian 2%
- Foreign-born
- 2% · Canada
- Languages at home
- 96% English-only · Spanish 3%
Political lean MEDSL · Kosciusko
- 2024 margin
- Solid R (+52.3) · D 22.9% · R 75.2% · Other 1.9%
- 2008→2024 swing
- -14.9pp toward R · 2008: -37.3pp · 2024: -52.3pp
- All cycles
- 2024: R+52.3 2020: R+50.7 2016: R+55.1 2012: R+52.2 2008: R+37.3
Not yet ingested
- Civics
- —
Market trends
- HPI YoY
- ▲ 35.39%
- Current HPI
- 320.2829
- Rent YoY
- —
- Metro
- —
- State GDP YoY
- ▲ 2.90%
- F500 in state
- 18
Industry mix (Fortune 500 HQ in IN)
| Industry | F500 HQs | Revenue |
|---|---|---|
| Industrial Machinery | 2 | $37B |
|
||
| Healthcare | 1 | $177B |
|
||
| Pharmaceuticals | 1 | $45B |
|
||
| Metals / Steel | 1 | $18B |
|
||
| Agriculture | 1 | $17B |
|
||
| Packaging | 1 | $12B |
|
||
Price history
2 events — show timeline
- 2026-06-11 Pending — IRMLS
- 2026-05-01 Listed $69,000 IRMLS
Property tax history
-15.0%/yrLatest (2020): $25 · +0.0% YoY. Source: county tax records.
Cash-flow waterfall
monthlySold comps — $/sqft
last 12 mo · ≤1 miLoading sold comps…