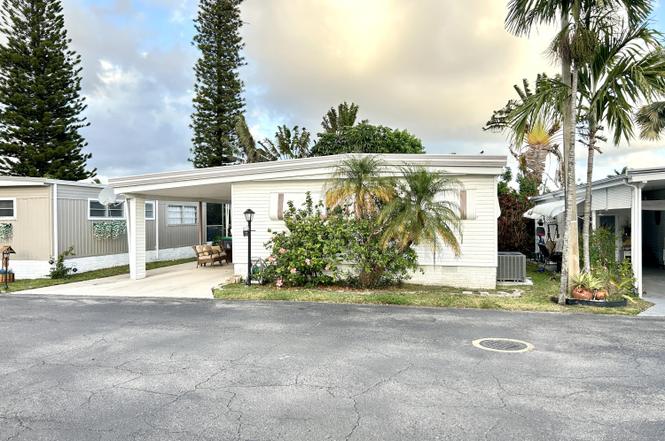
1541 S 32nd Ave · Hollywood, FL
Flood risk 3/10 · Minor
- FEMA flood zone
- X (unshaded)
- Chance of flooding over 30 yrs
- 0.12%
- Est. flood insurance / yr
- $507 – $1,088
Fire risk 1/10 · Minimal
- Est. fire insurance / yr
- $947 – $1,759
Heat risk 10/10 · Severe
- Hot days now (above 105°F)
- 5 days/yr
- Hot days in 30 yrs
- 19 days/yr
Wind risk 10/10 · Severe
- Chance of severe wind over 30 yrs
- 99.0%
Air-quality risk 2/10 · Minimal
- Unhealthy air days now
- 2 days/yr
- Unhealthy air days in 30 yrs
- 2 days/yr
Risk factors via First Street. Map © Google.
Why this score? — see what drove the B grade
The composite is a weighted blend of 9 inputs, each scored 0–100. Each bar is that input's sub-score; the figure is the points it added to the 100-point composite (weight × sub-score).
- Cash flow +30.0/30.0
- 1% rule +10.0/10.0
- DSCR +10.0/10.0
- ARV discount +7.5/15.0
- Schools +4.1/10.0
- Livability +3.8/5.0
- Rent growth +3.1/5.0
- Condition / age +2.5/5.0
- Appreciation +0.0/10.0
$124,900
🖨 Deal sheet 📄 Offer letter ✓ Due diligence
Listing remarks
Beautiful home located in the desirable Orangebrook Harbor community, set directly on the golf course. Residents enjoy the unique privilege of playing the course and using their own golf cart throughout the community. Rare on the market, this property offers two bedrooms and one and a half bathrooms, along with an additional room that can easily be converted into a home office or workspace. The home features in-unit washer and dryer, a garage for storage, and dedicated space for golf cart parking. The living area has been tastefully renovated and offers a comfortable and inviting space filled with natural light. Ideally located close to all amenities, this property is being sold furnished a
Key facts
- Golf cart parking
- Golf course
- Home office
Tags
Property features AI
Finance
- Financial info: Pets not allowed
- HOA & community: Land-lease community (monthly land lease); Land lease $1350 monthly (expires 2027-03-01); Senior community
Exterior
- Parking: Attached carport; Carport with 1 covered space; 1 open parking space
- Utilities: Public water; Public sewer; Sewer and water available
- Home design: Mobile Home; Single-story; Faces west; Resale condition
- Construction: Modular construction; Metal roof
- Exterior features: Covered patio; Patio
Interior
- Kitchen: Dishwasher; Electric range; Microwave; Refrigerator
- Bedrooms: 2 main-level bedrooms
- Flooring: Wood flooring
- Bathrooms: 1 full bathroom; 1 half bathroom
- Heating & cooling: Central heating; Central air conditioning
- Interior features: Furnished; Covered patio
- Laundry & utility: Laundry inside
Neighborhood map
What this means for you Summary
Snapshot
- This is a 2-bed/1.5-bath manufactured listed at $125k.
Deal economics
- At list price, monthly cash flow is $1k ($16k/yr) — positive.
- The deal already cash-flows at list — no discount required.
- Meets the 1% rule at list price ($3k rent vs $125k).
- Recommended offer: $114k (9.0% below list) — sets the bar for market timing.
- Cap rate 19.3% vs local median 3.2% in Hollywood — top-decile yield for the area; either an underpriced asset or a hidden risk that comps aren't pricing in. Stress-test before assuming the spread holds.
Location & tenants
- Location reads 76/100 on livability (#232 in FL, #3,548 nationally) — a middle-class / working-renter tenant base. Strengths: commute A+, housing A+, crime B+; Watch: amenities D.
- Broward (suburban): math 42% / reading 53% proficiency, ranked #46 of 73 in FL (top 63%) — families likely to look elsewhere, expect single-tenant / working-renter base with shorter leases.
- Zoned schools: Colbert Elementary School (math 35% / reading 29%, grade F, #1,797 of 2,144 statewide, top 86%, 611 students, 82% FRL); Apollo Middle School (math 35% / reading 47%, grade F, #353 of 571 statewide, top 63%, 1,168 students, 71% FRL); Hallandale High School (math 10% / reading 24%, grade F, #597 of 667 statewide, top 90%, 1,104 students, 70% FRL) — zoned schools average 74% FRL vs 51% district-wide (23 pts higher); higher-poverty schools than district average — tighter screening recommended.
- Zoned-school proficiency averages 30% at this address vs 48% district-wide (-18 pts) — the specific schools serving this property underperform the Broward average; the district grade overstates school quality for this exact location.
- Market conditions: Rents rising (+2.4%/yr); 529 active listings in the ZIP; 40 comparable units currently listed for rent nearby; rentals at typical pace (median 19d on market — plan ~3-4 weeks tenant-placement turnaround); 2,111 units permitted in Broward County in 2024 (1,265 in 5+ unit buildings).
- At $2,808/mo this rent would consume 47% of the median local household income ($71k/yr) (locally 2151% of renters already pay >50% of income on rent) — very limited rent-growth headroom before tenants either downsize or default.
Forward outlook
- Local home prices are declining (-3.0%/yr); year-one equity from $864 of loan paydown is wiped out by about $4k of value loss. Plan a longer hold.
- Broward County population projected at +34% by 2050 — long-run rental-demand tailwind backs the buy-and-hold thesis.
- At projected returns (-3.0% appreciation + 2.4% rent growth), your $35k cash investment doubles in ~3 years — after that, you're playing with house money.
Negotiation context
- It's been on market 104 days — a 9% lower offer ($114k) is reasonable based on typical stale-listing flexibility.
Risks & watch-outs
- Climate carrying-cost: severe wind risk, 99% chance of damaging wind over 30y; extreme-heat days projected 5→19/yr by 2055 (HVAC capex compounding) — expect insurance premiums to compound above CPI over the hold.
Questions for the listing agent
- It's been on market 104 days. Have you received any prior offers? Is the seller open to a 9% concession, seller financing, or rate buy-down credit?
- Built in 1969 — when were the roof, HVAC, electrical panel, plumbing, and water heater last replaced?
- Why hasn't it sold? Are there any deal-killer items the seller is aware of (foundation, flood, title, zoning, code violations)?
- Is there a deadline driving the sale (1031 exchange, divorce, estate, relocation)? That informs how much negotiation room exists.
- What's the average days-on-market for RENTAL listings here right now (not sales)? A rising rental-DOM trend means longer vacancies and softer asking-rent achievability than the comps imply.
- What's the recent tenant-quality profile in this submarket — average credit score on applications, eviction rate, late-payment / NSF rate, and stable-employment percentage? A property-management company in the area should have these aggregated.
- How much new for-sale + rental construction is in the pipeline within 1–3 miles? Heavy new supply typically softens prices + rents 12–24 months out; constrained supply supports both.
Investment metrics
- 1% rule
- 2.25% ✓
- Cap rate
- 19.31%
- Cash-on-cash
- 46.50%
- DSCR
- 3.07
- GRM
- 3.7
CMA / ARV
No comps found within radius.
Projected returns pro-forma
-3.0% appreciation · 2.41% rent growth · sell at horizon
- IRR
- 43.1%
- Equity multiple
- 2.84×
- Total profit
- $64,458
- Equity at exit
- $18,623
- IRR
- 48.9%
- Equity multiple
- 5.60×
- Total profit
- $160,721
- Equity at exit
- $10,799
Cash invested: $34,972 (down + closing). Projections, not guarantees.
Landlord ↔ Tenant lean methodology
- Overall (STATE)
- 87 Strongly Landlord-Friendly
- State Florida
- 87 Strongly Landlord-Friendly · R+3
- County
- — inherits STATE
- City
- — inherits STATE
ZIP-level market 33021
- Rents YoY
- 2.4%
- Active inventory
- 529
- Price-to-rent
- 3.7×
Monthly cashflow live
- Estimated rent
- $2,808 high interval (Pro) →
- Mortgage (P&I)
- −$655
- Tax est. 1.5%
- −$156 /mo · $1,874/yr
- Insurance
- −$52
- HOA
- −$0
- Vacancy / Maint / Mgmt
- −$590
- Net cashflow
- $1,355
Break-even live
UW: 25.0% down · 7.5% · 30yr · 1.5% tax · 5.0% vac · 8.0% maint · 8.0% mgmt
Financing live
Cash to close
- Down payment
- $31,225
- Closing costs
- $3,747
- Reserves months
- —
- Total cash needed
- —
Loan-product check · same deal, 3 products live
Conventional
25% down · 7.5% · 30yr
- Down + closing
- —
- Monthly P&I
- —
- Monthly cashflow
- —
- DSCR
- —
- Eligible?
- —
Personal DTI + credit; lowest rate.
DSCR
20% down · 8.5% · 30yr
- Down + closing
- —
- Monthly P&I
- —
- Monthly cashflow
- —
- DSCR
- —
- Eligible?
- —
No personal income docs; deal must DSCR.
Hard money
10% down · 12.0% · 12mo
- Down + closing
- —
- Monthly P&I
- —
- Monthly cashflow
- —
- DSCR
- —
- Eligible?
- —
Short-term bridge; refi at stabilization.
Rent comps 40 comps
| Address | Beds | Baths | Sqft | Rent | $/sqft | DOM | Units | Dist |
|---|---|---|---|---|---|---|---|---|
| 911 S Park Rd Hollywood, FL | 1.0–3.0 | 1.0–2.0 | 1123 | $2,619 | $2.33 | 1d | 24 | 0.29mi |
| 812 S Park Rd Hollywood, FL | 1.0–3.0 | 1.0–2.0 | 999 | $2,424 | $2.43 | 1d | 24 | 0.55mi |
| 2917 Plunkett St Unit 15C Hollywood, FL | 2.0 | 1.0 | 900 | $1,950 | $2.17 | 7d | 1 | 0.56mi |
| 839 S Highland Dr Hollywood, FL | 2.0 | 2.0 | 1748 | $3,000 | $1.72 | 24d | 1 | 0.56mi |
| 839 S Highland Dr Hollywood, FL | 2.0 | 2.0 | 1748 | $2,500 | $1.43 | 7d | 1 | 0.56mi |
| 1306 S 29th Ave Hollywood, FL | 3.0 | 2.0 | 1500 | $3,300 | $2.20 | 18d | 1 | 0.56mi |
| 4200 Hillcrest Dr #503 Hollywood, FL | 2.0 | 2.0 | 1132 | $2,300 | $2.03 | 24d | 1 | 0.59mi |
| 632 S Crescent Dr Unit 1533630P Hollywood, FL | 3.0 | 2.0 | 1743 | $7,380 | $4.23 | 7d | 1 | 0.64mi |
| 632 S Crescent Dr Hollywood, FL | 3.0 | 2.0 | 1744 | $6,500 | $3.73 | 24d | 1 | 0.64mi |
| 640 S Park Rd Unit 34-4 Hollywood, FL | 2.0 | 2.0 | 1060 | $2,250 | $2.12 | 24d | 1 | 0.67mi |
| 640 S Park Rd Unit 12-4 Hollywood, FL | 3.0 | 2.0 | 1236 | $2,950 | $2.39 | 24d | 1 | 0.67mi |
| 530 S Park Rd Hollywood, FL | 2.0 | 2.0 | 1060 | $2,375 | $2.24 | 18d | 1 | 0.67mi |
| 640 S Park Rd Unit 14-4 Hollywood, FL | 2.0 | 2.0 | 1060 | $2,200 | $2.08 | 16d | 1 | 0.67mi |
| 640 S Park Rd Unit 14-4 Hollywood, FL | 2.0 | 2.0 | 1060 | $2,300 | $2.17 | 24d | 1 | 0.67mi |
| 530 S Park Rd Unit 17-11 Hollywood, FL | 2.0 | 2.0 | 1060 | $2,300 | $2.17 | 22d | 1 | 0.69mi |
| 530 S Park Rd Unit 12-11 Hollywood, FL | 2.0 | 2.0 | 1060 | $2,375 | $2.24 | 15d | 1 | 0.69mi |
| 2849 Dewey St Unit 2849 Hollywood, FL | 2.0 | 2.0 | 1265 | $2,600 | $2.06 | 7d | 1 | 0.69mi |
| 2849 Dewey St Unit 2849 Hollywood, FL | 2.0 | 2.0 | 1265 | $2,600 | $2.06 | 10d | 1 | 0.69mi |
| 3932 Long Leaf Ln #1 Hollywood, FL | 3.0 | 2.5 | 1675 | $3,400 | $2.03 | 24d | 1 | 0.70mi |
| 555 S Luna Ct Hollywood, FL | 2.0 | 2.0 | 1036 | $2,120 | $2.05 | 4d | 2 | 0.71mi |
| 570 S Park Rd Unit 13-6 Hollywood, FL | 2.0 | 2.0 | 1060 | $2,400 | $2.26 | 24d | 1 | 0.72mi |
| 1101 Banyan Dr Hollywood, FL | 3.0 | 2.0 | 1768 | $4,100 | $2.32 | 24d | 1 | 0.73mi |
| 460 S Park Rd Unit 6-304 Hollywood, FL | 2.0 | 1.0 | 918 | $1,950 | $2.12 | 5d | 1 | 0.74mi |
| 450 S Park Rd Unit 5-307 Hollywood, FL | 3.0 | 2.0 | 1084 | $2,800 | $2.58 | 24d | 1 | 0.75mi |
| 470 S Park Rd Unit 7-307 Hollywood, FL | 3.0 | 2.0 | 1084 | $3,250 | $3.00 | 24d | 1 | 0.75mi |
| 3810 SW 25th St Unit 1 West Park, FL | 2.0 | 1.0 | 1826 | $2,300 | $1.26 | 24d | 1 | 0.78mi |
| 3500 Jackson St Unit 203 Hollywood, FL | 2.0 | 2.0 | 875 | $1,995 | $2.28 | 24d | 1 | 0.79mi |
| 2740 Dewey St Hollywood, FL | 3.0 | 1.0 | 1191 | $2,900 | $2.43 | 12d | 1 | 0.80mi |
| 2750 Washington St Hollywood, FL | 2.0 | 1.0 | 1053 | $3,500 | $3.32 | 14d | 1 | 0.82mi |
| 2750 Washington St Hollywood, FL | 2.0 | 1.0 | 1053 | $3,300 | $3.13 | 2d | 1 | 0.82mi |
| 3624 Jackson St Unit 21 Hollywood, FL | 2.0 | 2.0 | 1100 | $1,900 | $1.73 | 2d | 1 | 0.83mi |
| 841 NW 10th St Hallandale Beach, FL | 3.0 | 2.0 | 1485 | $3,100 | $2.09 | 7d | 1 | 0.84mi |
| 841 NW 10th St Unit 841C Hallandale Beach, FL | 3.0 | 2.0 | 1585 | $3,200 | $2.02 | 19d | 1 | 0.84mi |
| 3501 Jackson St #309 Hollywood, FL | 2.0 | 2.0 | 1170 | $2,500 | $2.14 | 24d | 1 | 0.84mi |
| 852 NW 8th St #852 Hallandale Beach, FL | 3.0 | 2.0 | 1170 | $2,800 | $2.39 | 22d | 1 | 0.85mi |
| 3600 Van Buren St Hollywood, FL | 1.0–2.0 | 1.0–2.0 | 1055 | $2,350 | $2.23 | 2d | 4 | 0.86mi |
| 400 S Luna Ct #2 Hollywood, FL | 2.0 | 1.0 | 960 | $2,300 | $2.40 | 24d | 1 | 0.87mi |
| 2911 Monroe St Hollywood, FL | 3.0 | 2.0 | 1645 | $5,200 | $3.16 | 24d | 1 | 0.89mi |
| 4209 Jefferson St Unit 4209 Hollywood, FL | 3.0 | 2.0 | 1697 | $7,200 | $4.24 | 1d | 1 | 0.90mi |
| 3601 Van Buren St Hollywood, FL | 1.0–2.0 | 1.0–2.0 | 941 | $2,195 | $2.33 | 3d | 3 | 0.92mi |
Listing history 13 events
-
2026-06-18days on market $124,900 Active 104 DOM
-
2026-06-17days on market $124,900 Active 103 DOM
-
2026-06-16days on market $124,900 Active 102 DOM
-
2026-06-15days on market $124,900 Active 101 DOM
-
2026-06-13days on market $124,900 Active 99 DOM
-
2026-06-09days on market $124,900 Active 95 DOM
-
2026-06-07days on market $124,900 Active 93 DOM
-
2026-06-04days on market $124,900 Active 90 DOM
-
2026-06-03days on market $124,900 Active 89 DOM
-
2026-06-02days on market $124,900 Active 88 DOM
-
2026-06-01days on market $124,900 Active 87 DOM
-
2026-05-31days on market $124,900 Active 86 DOM
-
2026-03-06$124,900 Active
ⓘ Source: listings_history table (triggers on properties + properties_extension) + one-shot
backfill from property_details.listing_events for pre-trigger history.
Climate risk First Street
- Flood 3/10 Moderate FEMA zone X (unshaded) · 12% chance over 30 yrs
- Wildfire 1/10 Low
- Heat 10/10 Extreme 5 d/yr ≥105°F today · 19 d/yr by 30 yrs out
- Wind 10/10 Extreme 99% chance of damaging wind over 30 yrs
- Air quality 2/10 Low 2 unhealthy d/yr today · 2 by 30 yrs out
Nearby sold comps map
Loading sold comps map…
Walkable amenities ~0.75 mi
Loading nearby amenities…
Taxation est. · year 1
- Rental income
- $33,696
- − Mortgage interest
- −$6,996
- − Property taxes
- −$1,874
- − Insurance
- −$624
- − Repairs & maintenance
- −$2,696
- − Management
- −$2,696
- − Depreciation
- −$3,633
- Taxable income
- $15,177
- Est. tax owed @ 24.0%
- −$3,642
- After-tax cash flow
- $12,620/yr
For passive investors: Depreciation is non-cash, so a rental often shows a tax loss while cash-flowing — sheltering income. Rental losses are passive: they offset passive income freely, and up to $25,000/yr can offset ordinary (W-2) income if you actively participate and your MAGI is under $100k (phasing out to $0 by $150k); unused losses carry forward. On sale, claimed depreciation is recaptured at up to 25%, and gains may owe capital-gains tax (a 1031 exchange can defer both). Figures are a year-1 estimate at your 24.0% rate — not tax advice; consult a CPA.
Schools (NCES district)
- District
- Broward
- NCES district ID
- 1200180
- Math proficiency
- 42% ▼ -18.00%
- Reading proficiency
- 53% ▼ -5.00%
- Median HH income
- $52,139
- Composite
- 40.88/100
- National rank
- #3621
- State rank
- #46 of 73 in FL
Livability — Hollywood
- Score
- 76/100
- State rank
- #232
- US rank
- #3548
Category grades
Schools grade is shown separately in the Schools card above.
Census & demographics
- Census place
- Hollywood, FL
- County
- Broward County · 1,963,430 people
- City population
- 109,079
- Metro
- Miami-Fort Lauderdale-Pompano Beach, FL
- Population (ZIP)
- 48,464
- Household income
- $71,318
- Rent vs Own
- Severe rent burden
- 2151.0
Population outlook (Broward County) Hauer SSP2
- Today (2025)
- 2,207,033 people
- By 2030
- 2,360,704 · +7.0%
- By 2040
- 2,661,208 · +20.6%
- By 2050
- 2,946,698 · +33.5%
- By 2075
- 3,602,273 · +63.2%
- By 2100
- 3,970,984 · +79.9%
Race, ethnicity, and origin ACS 2023
- Neighborhood character
- Diverse neighborhood (Simpson 0.65)
- Race & ethnicity
- White 45% Hispanic / Latino 37% Two or more races 17% Black 13% Asian 3%
- Hispanic origin (detail)
- Puerto Rican 5% Cuban 10% Dominican 2%
- Common ancestry
- Romanian 3% Scotch-Irish 2% Hispanic 2%
- Foreign-born
- 35% · Canada, Jamaica, Dominican Republic
- Languages at home
- 53% English-only · Spanish 33% French/Haitian/Cajun 4% Russian/Polish/Slavic 2%
Political lean MEDSL · Broward
- 2024 margin
- D (+17.0) · D 58.0% · R 41.0%
- 2008→2024 swing
- -17.8pp toward R · 2008: 34.7pp · 2024: 17.0pp
- All cycles
- 2024: D+17.0 2020: D+29.8 2016: D+35.0 2012: D+34.9 2008: D+34.7
Not yet ingested
- Civics
- —
Market trends
- HPI YoY
- ▼ -404.28%
- Current HPI
- 429.7129
- Rent YoY
- ▲ 2.41%
- Metro
- Miami-Fort Lauderdale-Pompano Beach, FL
- State GDP YoY
- ▲ 3.28%
- F500 in state
- 36
Industry mix (Fortune 500 HQ in FL)
| Industry | F500 HQs | Revenue |
|---|---|---|
| Industrial Technology | 2 | $29B |
|
||
| Insurance | 2 | $17B |
|
||
| Retail | 1 | $60B |
|
||
| Technology Distribution | 1 | $58B |
|
||
| Homebuilding | 1 | $35B |
|
||
| Technology Manufacturing | 1 | $35B |
|
||
Price history
1 event — show timeline
- 2026-03-06 Listed $124,900 Beaches MLS
Cash-flow waterfall
monthlySold comps — $/sqft
last 12 mo · ≤1 miLoading sold comps…