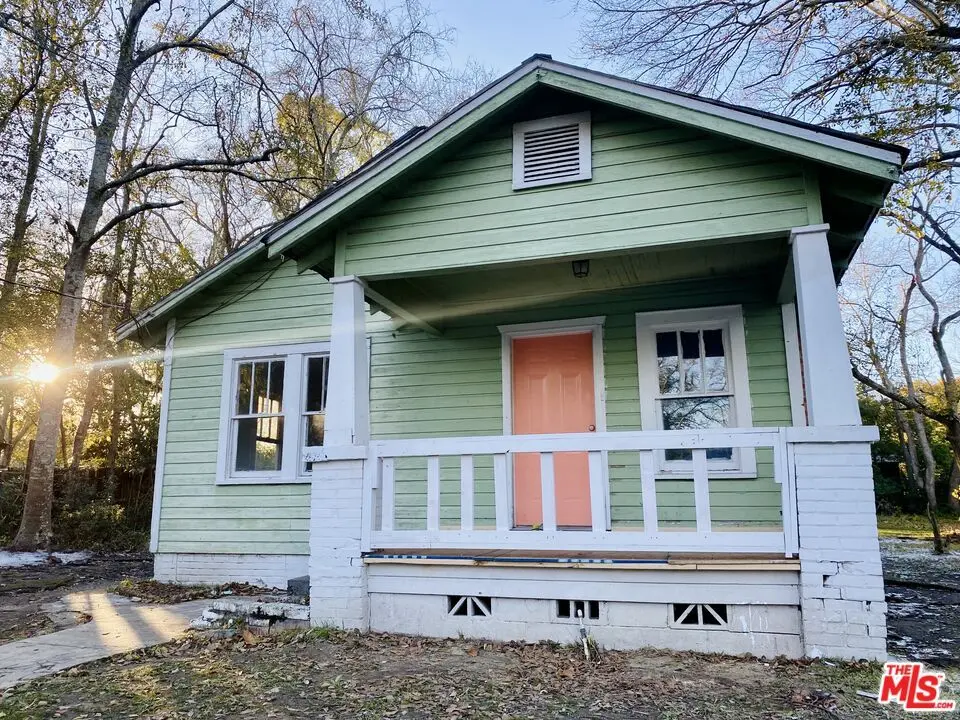
107 Martin · Mobile, AL
Flood risk 1/10 · Minimal
- FEMA flood zone
- X (unshaded)
- Chance of flooding over 30 yrs
- 0.0%
- Est. flood insurance / yr
- $507 – $1,088
Fire risk 3/10 · Minor
- Est. fire insurance / yr
- $916 – $1,700
Heat risk 9/10 · Severe
- Hot days now (above 104°F)
- 7 days/yr
- Hot days in 30 yrs
- 21 days/yr
Wind risk 9/10 · Severe
- Chance of severe wind over 30 yrs
- 99.0%
Air-quality risk 2/10 · Minimal
- Unhealthy air days now
- 1 days/yr
- Unhealthy air days in 30 yrs
- 1 days/yr
Risk factors via First Street. Map © Google.
Why this score? — see what drove the C+ grade
The composite is a weighted blend of 9 inputs, each scored 0–100. Each bar is that input's sub-score; the figure is the points it added to the 100-point composite (weight × sub-score).
- Cash flow +30.0/30.0
- 1% rule +10.0/10.0
- DSCR +10.0/10.0
- ARV discount +3.9/15.0
- Livability +3.8/5.0
- Rent growth +2.5/5.0
- Condition / age +2.5/5.0
- Schools +2.3/10.0
- Appreciation +0.0/10.0
$71,000
🖨 Deal sheet 📄 Offer letter ✓ Due diligence
Listing remarks
Seller wants to make a deal! Call today! 3 bedroom 1 bathroom rented for $800.00 a month to a long term tenant who wishes to stay. Great little investment in Mobile AL! Can be delivered vacant.
Key facts
- 8,006 sq ft lot
- 3 parking spots
- Listed 44 days
Property features AI
Finance
- Financial info: Gross income: $9,600; Gross operating income: $9,600; Net operating income: $7,600; Total annual expenses: $2,000; Gross rent multiplier: 8; Unit 1 rent (actual/projected): $800
Exterior
- Parking: Driveway parking; Total of 3 parking spaces
- Home design: One-level residential income property; Single building
- Exterior features: No additional structures
Interior
- Bedrooms: Unit 1: 3 bedrooms
- Bathrooms: Unit 1: 1 bathroom
- Heating & cooling: Wall electric heat; Wall unit cooling
- Interior features: Ceiling fan; Wall unit cooling; Wall electric heat
Neighborhood map
What this means for you Summary
Snapshot
- This is a 3-bed/1.0-bath single-family listed at $71k.
Deal economics
- At list price, monthly cash flow is $657 ($8k/yr) — positive.
- The deal already cash-flows at list — no discount required.
- Meets the 1% rule at list price ($1k rent vs $71k).
- Recommended offer: $69k (3.0% below list) — sets the bar for market timing.
- Cap rate 17.4% vs local median 4.9% in Mobile — top-decile yield for the area; either an underpriced asset or a hidden risk that comps aren't pricing in. Stress-test before assuming the spread holds.
Location & tenants
- Location reads 75/100 on livability (#20 in AL, #4,262 nationally) — a middle-class / working-renter tenant base. Strengths: commute A+, cost of living A+, housing A+; Watch: schools D-, crime F, employment D-.
- Mobile County (urban): math 15% / reading 39% proficiency, ranked #81 of 129 in AL (top 63%) — low school quality limits family demand, transient renter base, plan for 1-2y turnover; 67% free/reduced lunch — lower-income household profile, screen leases tightly.
- Market conditions: 45 active listings in the ZIP; 28 comparable units currently listed for rent nearby; rentals at typical pace (median 21d on market — plan ~3-4 weeks tenant-placement turnaround); 1,678 units permitted in Mobile County in 2024 (264 in 5+ unit buildings).
Forward outlook
- Local home prices are declining (-3.0%/yr); year-one equity from $491 of loan paydown is wiped out by about $2k of value loss. Plan a longer hold.
- Mobile County population projected to shrink 8% by 2050 — rents likely to lag national; underwrite the cash flow, not the appreciation.
- At projected returns (-3.0% appreciation + 3.0% rent growth), your $20k cash investment doubles in ~3 years — after that, you're playing with house money.
Negotiation context
- It's been on market 44 days — a 3% lower offer ($69k) is reasonable based on typical stale-listing flexibility.
Risks & watch-outs
- Climate carrying-cost: severe wind risk, 99% chance of damaging wind over 30y; extreme-heat days projected 7→21/yr by 2055 (HVAC capex compounding) — expect insurance premiums to compound above CPI over the hold.
Questions for the listing agent
- It's been on market 44 days. Have you received any prior offers? Is the seller open to a 3% concession, seller financing, or rate buy-down credit?
- Is there a deadline driving the sale (1031 exchange, divorce, estate, relocation)? That informs how much negotiation room exists.
- Schools are D-rated, which usually means shorter tenancies and higher turnover. Who's the typical renter profile here, and what's been the actual vacancy rate?
- Crime grade is F in this area — have there been break-ins, vandalism, or insurance claims at this property in the last 3 years? What carrier currently insures it and at what premium?
- What's the average days-on-market for RENTAL listings here right now (not sales)? A rising rental-DOM trend means longer vacancies and softer asking-rent achievability than the comps imply.
- What's the recent tenant-quality profile in this submarket — average credit score on applications, eviction rate, late-payment / NSF rate, and stable-employment percentage? A property-management company in the area should have these aggregated.
- How much new for-sale + rental construction is in the pipeline within 1–3 miles? Heavy new supply typically softens prices + rents 12–24 months out; constrained supply supports both.
Investment metrics
- 1% rule
- 1.94% ✓
- Cap rate
- 17.39%
- Cash-on-cash
- 39.64%
- DSCR
- 2.76
- GRM
- 4.3
CMA / ARV
- ARV (median comp)
- $65,678
- List price
- $71,000
- Delta
- 8.10%
- Verdict
- FAIR
- Comps
- 20 within 1.0 mi
Show comp detail 12 sales within ~0.75 mi
| Address | Dist | Beds/Ba | Sqft | Sold | Price | $/sf | Match |
|---|---|---|---|---|---|---|---|
| 70 Picardy St | 0.38mi | 3/1.0 | 1,224 (-2%) | 2mo | $140,000 | $114 | 78 |
| 81 Lefevre St | 0.20mi | 4/1.0 (+1) | 1,207 (-3%) | 11mo | $85,000 | $70 | 70 |
| 134 Hyland Ave | 0.51mi | 2/2.0 (-1) | 1,272 (+2%) | 2mo | $227,500 | $179 | 63 |
| 2959 Nall St | 0.58mi | 3/2.0 | 1,294 (+4%) | 1mo | $190,000 | $147 | 62 |
| 2810 Pages Ln | 0.44mi | 3/2.0 | 1,212 (-3%) | 11mo | $168,500 | $139 | 61 |
| 3107 Heather St | 0.43mi | 3/1.0 | 1,064 (-15%) | 7mo | $65,000 | $61 | 49 |
| 413 Bay Shore Ave | 0.56mi | 4/2.0 (+1) | 1,300 (+4%) | 12mo | $183,000 | $141 | 48 |
| 2753 Dauphin St | 0.63mi | 3/1.0 | 1,406 (+12%) | 5mo | $137,000 | $97 | 46 |
| 2647 Weems Dr | 0.64mi | 3/2.0 | 1,124 (-10%) | 7mo | $175,000 | $156 | 43 |
| 2710 Betbeze St | 0.68mi | 3/2.0 | 1,100 (-12%) | 3mo | $110,000 | $100 | 42 |
| 292 Siena Vis | 0.66mi | 3/2.0 | 1,416 (+13%) | 10mo | $169,000 | $119 | 35 |
| 2666 Betbeze St | 0.74mi | 4/2.0 (+1) | 1,429 (+14%) | 5mo | $19,900 | $14 | 28 |
Match score weights: distance 35% · size 25% · config 20% · recency 20%. Top-matched comps best support the ARV.
Projected returns pro-forma
-3.0% appreciation · 3.0% rent growth · sell at horizon
- IRR
- 35.9%
- Equity multiple
- 2.52×
- Total profit
- $30,303
- Equity at exit
- $10,586
- IRR
- 42.6%
- Equity multiple
- 5.03×
- Total profit
- $80,183
- Equity at exit
- $6,139
Cash invested: $19,880 (down + closing). Projections, not guarantees.
Landlord ↔ Tenant lean methodology
- Overall (STATE)
- 90 Strongly Landlord-Friendly
- State Alabama
- 90 Strongly Landlord-Friendly · R+15
- County
- — inherits STATE
- City
- — inherits STATE
ZIP-level market 36607
- Active inventory
- 45
- Price-to-rent
- 4.3×
Monthly cashflow live
- Estimated rent
- $1,380 high interval (Pro) →
- Mortgage (P&I)
- −$372
- Tax from tax record
- −$32 /mo · $380/yr
- Insurance
- −$30
- HOA
- −$0
- Vacancy / Maint / Mgmt
- −$290
- Net cashflow
- $657
Break-even live
UW: 25.0% down · 7.5% · 30yr · 1.5% tax · 5.0% vac · 8.0% maint · 8.0% mgmt
Financing live
Cash to close
- Down payment
- $17,750
- Closing costs
- $2,130
- Reserves months
- —
- Total cash needed
- —
Loan-product check · same deal, 3 products live
Conventional
25% down · 7.5% · 30yr
- Down + closing
- —
- Monthly P&I
- —
- Monthly cashflow
- —
- DSCR
- —
- Eligible?
- —
Personal DTI + credit; lowest rate.
DSCR
20% down · 8.5% · 30yr
- Down + closing
- —
- Monthly P&I
- —
- Monthly cashflow
- —
- DSCR
- —
- Eligible?
- —
No personal income docs; deal must DSCR.
Hard money
10% down · 12.0% · 12mo
- Down + closing
- —
- Monthly P&I
- —
- Monthly cashflow
- —
- DSCR
- —
- Eligible?
- —
Short-term bridge; refi at stabilization.
Rent comps 28 comps
| Address | Beds | Baths | Sqft | Rent | $/sqft | DOM | Units | Dist |
|---|---|---|---|---|---|---|---|---|
| 156 Hemley Ave Mobile, AL | 3.0 | 1.0 | 936 | $1,195 | $1.28 | 43d | 1 | 0.13mi |
| 2500 Dauphinwood Dr Mobile, AL | 2.0–3.0 | 1.0–2.0 | 1250 | $1,395 | $1.12 | 13d | 19 | 0.64mi |
| 2604 Dauphin St #210 Mobile, AL | 2.0 | 1.0 | 950 | $1,150 | $1.21 | 20d | 1 | 0.73mi |
| 2604 Dauphin St Mobile, AL | 2.0 | 1.0 | 950 | $1,072 | $1.13 | 43d | 2 | 0.73mi |
| 150 Dunn Ave Mobile, AL | 3.0 | 2.0 | 1455 | $1,250 | $0.86 | 20d | 1 | 0.90mi |
| 107 Grand Blvd Mobile, AL | 2.0 | 2.0 | 1200 | $1,295 | $1.08 | 20d | 1 | 0.92mi |
| 3060 Emogene St Mobile, AL | 3.0 | 1.0 | 1200 | $1,400 | $1.17 | 13d | 1 | 0.94mi |
| 3655 Old Shell Rd Unit 3655 Mobile, AL | 2.0 | 2.0 | 1200 | $1,850 | $1.54 | 13d | 1 | 0.96mi |
| 151 Du Rhu Dr Mobile, AL | 1.0–3.0 | 1.0–2.0 | 1052 | $2,800 | $2.66 | 13d | 12 | 0.97mi |
| 168 W Collins St Mobile, AL | 3.0 | 1.0 | 968 | $725 | $0.75 | 20d | 1 | 1.01mi |
| 3252 Orleans St Mobile, AL | 2.0 | 1.0 | 900 | $850 | $0.94 | 43d | 1 | 1.03mi |
| 120 Paris Ave Mobile, AL | 2.0 | 1.0 | 1054 | $1,150 | $1.09 | 20d | 1 | 1.03mi |
| 2863 Potter Dr Unit 1043693P Mobile, AL | 4.0 | 2.0 | 1496 | $3,049 | $2.04 | 13d | 1 | 1.04mi |
| 2861 Potter Dr Unit 1043844P Mobile, AL | 3.0 | 2.0 | 1496 | $2,492 | $1.67 | 20d | 1 | 1.04mi |
| 2855 Potter Dr Mobile, AL | 2.0 | 1.0 | 1127 | $1,050 | $0.93 | 43d | 1 | 1.04mi |
| 672 Burden St Mobile, AL | 3.0 | 1.5 | 1421 | $1,300 | $0.91 | 20d | 1 | 1.07mi |
| 2861 Ralston Rd Mobile, AL | 3.0 | 2.0 | 1617 | $1,650 | $1.02 | 43d | 1 | 1.10mi |
| 708 Bond St Mobile, AL | 3.0 | 1.0 | 1100 | $1,350 | $1.23 | 20d | 1 | 1.14mi |
| 200 S Florida St Unit 101 Mobile, AL | 2.0 | 2.0 | 1150 | $1,375 | $1.20 | 20d | 1 | 1.20mi |
| 423 Devon Dr Mobile, AL | 3.0 | 1.0 | 1220 | $950 | $0.78 | 43d | 1 | 1.21mi |
| 2859 Brierwood Dr Mobile, AL | 3.0 | 1.0 | 1057 | $1,500 | $1.42 | 13d | 1 | 1.24mi |
| 2507 Taylor Ave Mobile, AL | 3.0 | 1.0 | 1230 | $1,495 | $1.22 | 13d | 1 | 1.24mi |
| 104 Ellinor St Mobile, AL | 2.0 | 1.0 | 896 | $1,275 | $1.42 | 20d | 1 | 1.28mi |
| 2503 Richard Ave Mobile, AL | 2.0 | 1.0 | 928 | $805 | $0.87 | 13d | 1 | 1.29mi |
| 2656 Pathway Pl Mobile, AL | 2.0–3.0 | 1.0 | 778 | $1,261 | $1.62 | 13d | 9 | 1.32mi |
| 186 Stanton Rd Mobile, AL | 1.0–3.0 | 1.0–2.5 | 1263 | $2,450 | $1.94 | 43d | 1 | 1.38mi |
| 402 Havens St Mobile, AL | 4.0 | 2.0 | 960 | $1,350 | $1.41 | 13d | 1 | 1.41mi |
| 315 Hadrian St Mobile, AL | 3.0 | 2.0 | 1843 | $1,800 | $0.98 | 43d | 1 | 1.42mi |
Listing history 19 events
-
2026-06-18days on market $71,000 Active 44 DOM
-
2026-06-17days on market $71,000 Active 43 DOM
-
2026-06-16days on market $71,000 Active 42 DOM
-
2026-06-15days on market $71,000 Active 41 DOM
-
2026-06-14days on market $71,000 Active 39 DOM
-
2026-06-13remarks 193-char remark
-
2026-06-13pricedays on market $71,000 Active 38 DOM
-
2026-06-10days on market $79,577 Active 36 DOM
-
2026-06-09days on market $79,577 Active 35 DOM
-
2026-06-08days on market $79,577 Active 34 DOM
-
2026-06-07days on market $79,577 Active 33 DOM
-
2026-06-05days on market $79,577 Active 30 DOM
-
2026-06-03days on market $79,577 Active 29 DOM
-
2026-06-02days on market $79,577 Active 28 DOM
-
2026-06-01days on market $79,577 Active 27 DOM
-
2026-05-31days on market $79,577 Active 26 DOM
-
2026-05-30days on market $79,577 Active 25 DOM
-
2026-05-05$79,577 Active 152-char remark
-
2020-02-27soldstatus $94,500
ⓘ Source: listings_history table (triggers on properties + properties_extension) + one-shot
backfill from property_details.listing_events for pre-trigger history.
Tax reassessment forecast AL · Resets to sale price
- Current annual tax
- $380 · $32/mo
- Projected year-2 tax
- $380 · $32/mo
- Expected delta
- $0/yr ($0/mo · 0.0%)
ⓘ Screening estimate from a state-policy table — verify with the county assessor before closing.
Climate risk First Street
- Flood 1/10 Low FEMA zone X (unshaded) · 0% chance over 30 yrs
- Wildfire 3/10 Moderate
- Heat 9/10 Extreme 7 d/yr ≥104°F today · 21 d/yr by 30 yrs out
- Wind 9/10 Extreme 99% chance of damaging wind over 30 yrs
- Air quality 2/10 Low 1 unhealthy d/yr today · 1 by 30 yrs out
Nearby sold comps map
Loading sold comps map…
Walkable amenities ~0.75 mi
Loading nearby amenities…
Taxation est. · year 1
- Rental income
- $16,560
- − Mortgage interest
- −$3,977
- − Property taxes
- −$380
- − Insurance
- −$355
- − Repairs & maintenance
- −$1,325
- − Management
- −$1,325
- − Depreciation
- −$2,065
- Taxable income
- $7,133
- Est. tax owed @ 24.0%
- −$1,712
- After-tax cash flow
- $6,168/yr
For passive investors: Depreciation is non-cash, so a rental often shows a tax loss while cash-flowing — sheltering income. Rental losses are passive: they offset passive income freely, and up to $25,000/yr can offset ordinary (W-2) income if you actively participate and your MAGI is under $100k (phasing out to $0 by $150k); unused losses carry forward. On sale, claimed depreciation is recaptured at up to 25%, and gains may owe capital-gains tax (a 1031 exchange can defer both). Figures are a year-1 estimate at your 24.0% rate — not tax advice; consult a CPA.
Schools (NCES district)
- District
- Mobile County
- NCES district ID
- 0102370
- Math proficiency
- 15% ▼ -28.00%
- Reading proficiency
- 39% ▬ 0.00%
- Median HH income
- $42,455
- Composite
- 22.9/100
- National rank
- #8002
- State rank
- #81 of 129 in AL
Livability — Mobile
- Score
- 75/100
- State rank
- #20
- US rank
- #4262
Category grades
Schools grade is shown separately in the Schools card above.
Census & demographics
- Census place
- Mobile, AL
- City population
- 205,729
- Population (ZIP)
- 5,529
Population outlook (Mobile County) Hauer SSP2
- Today (2025)
- 415,303 people
- By 2030
- 411,755 · -0.9%
- By 2040
- 399,670 · -3.8%
- By 2050
- 382,616 · -7.9%
- By 2075
- 337,353 · -18.8%
- By 2100
- 283,391 · -31.8%
Race, ethnicity, and origin ACS 2023
- Neighborhood character
- Majority Black (56%)
- Race & ethnicity
- Black 56% White 40% Two or more races 3%
- Common ancestry
- Slovak 4% Lithuanian 2% Scotch-Irish 1%
- Foreign-born
- 1%
Political lean MEDSL · Mobile
- 2024 margin
- R (+16.4) · D 41.3% · R 57.7%
- 2008→2024 swing
- -7.7pp toward R · 2008: -8.7pp · 2024: -16.4pp
- All cycles
- 2024: R+16.4 2020: R+11.9 2016: R+13.9 2012: R+9.3 2008: R+8.7
Not yet ingested
- Civics
- —
Market trends
- HPI YoY
- ▼ -155.04%
- Current HPI
- 127.0483
- Rent YoY
- —
- Metro
- —
- State GDP YoY
- ▲ 2.94%
- F500 in state
- 4
Industry mix (Fortune 500 HQ in AL)
| Industry | F500 HQs | Revenue |
|---|---|---|
| Financial Services | 1 | $8B |
|
||
| Healthcare | 1 | $5B |
|
||
Price history
-24.9% since first listed3 events — show timeline
- 2026-06-10 Price Changed $71,000 TheMLS
- 2026-05-05 Listed $79,577 TheMLS
- 2020-02-27 Sold (Public Records) $94,500 Public Records
Property tax history
+1.3%/yrLatest (2025): $380 · +14.1% YoY. Source: county tax records.
Cash-flow waterfall
monthlySold comps — $/sqft
last 12 mo · ≤1 miLoading sold comps…