 🏷️ Likely Rental
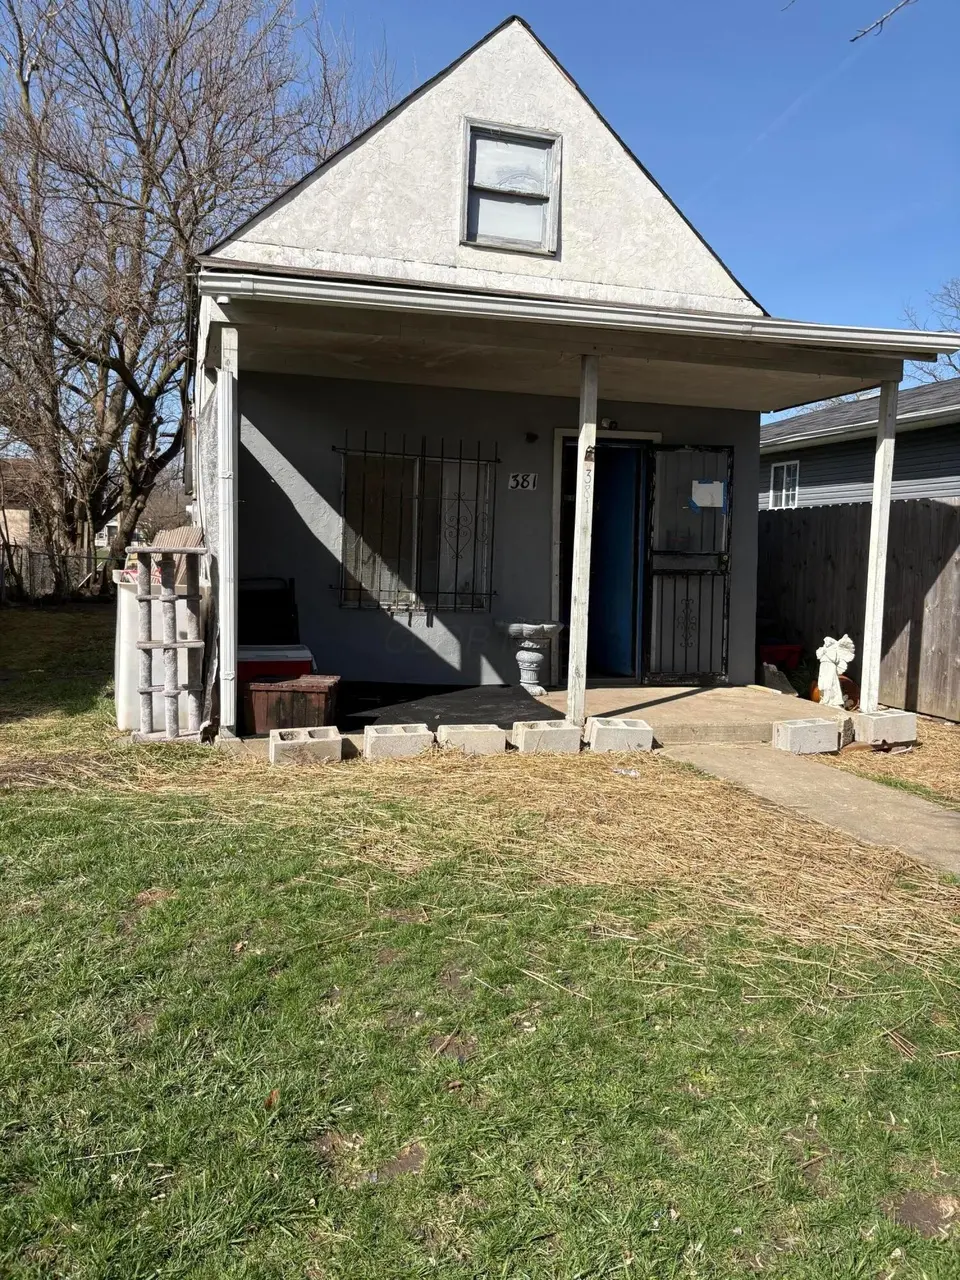
381 S Wheatland Ave · Columbus, OH
Flood risk 3/10 · Minor
- FEMA flood zone
- X (unshaded)
- Chance of flooding over 30 yrs
- 0.1%
- Est. flood insurance / yr
- $507 – $1,088
Fire risk 1/10 · Minimal
- Est. fire insurance / yr
- $713 – $1,323
Heat risk 4/10 · Minor
- Hot days now (above 100°F)
- 7 days/yr
- Hot days in 30 yrs
- 18 days/yr
Wind risk 2/10 · Minimal
- Chance of severe wind over 30 yrs
- 1.0%
Air-quality risk 2/10 · Minimal
- Unhealthy air days now
- 1 days/yr
- Unhealthy air days in 30 yrs
- 2 days/yr
Risk factors via First Street. Map © Google.
Why this score? — see what drove the B+ grade
The composite is a weighted blend of 9 inputs, each scored 0–100. Each bar is that input's sub-score; the figure is the points it added to the 100-point composite (weight × sub-score).
- Cash flow +30.0/30.0
- ARV discount +15.0/15.0
- 1% rule +10.0/10.0
- DSCR +10.0/10.0
- Livability +4.0/5.0
- Rent growth +3.6/5.0
- Condition / age +2.5/5.0
- Schools +1.7/10.0
- Appreciation +0.0/10.0
$60,000
🖨 Deal sheet 📄 Offer letter ✓ Due diligence
Listing remarks MLS
FINE HOME FOR THE PRICE! COULD BE GOOD RENTAL AT $200 PER MONTH. MONEYBACK IN JUST OVER 7 YEARS. GOOD RETURN ON INVESTMENT. EASY TO SHOW.
Key facts
- 3,920 sq ft lot
- Built 1910
- Listed 50 days
Property features AI
Finance
- Other: Standard special listing conditions
Exterior
- Utilities: Public water; Public sewer
- Home design: Single family residence; One and one half levels; No common walls
- Construction: Built in 1910; Slab foundation
- Exterior features: Fenced yard; Lot approximately 0.09 acres
Interior
- Bathrooms: 1 full bathroom
- Heating & cooling: Forced air heating; Has heating
- Interior features: Living area of 678
Neighborhood map
What this means for you Summary
Snapshot
- This is a 1-bed/1.0-bath single-family listed at $60k.
Deal economics
- At list price, monthly cash flow is $266 ($3k/yr) — positive.
- The deal already cash-flows at list — no discount required.
- Meets the 1% rule at list price ($965 rent vs $60k).
- Recommended offer: $58k (3.0% below list) — sets the bar for market timing.
- Cap rate 11.6% vs local median 3.8% in Columbus — top-decile yield for the area; either an underpriced asset or a hidden risk that comps aren't pricing in. Stress-test before assuming the spread holds.
Location & tenants
- Location reads 81/100 on livability (#97 in OH, #1,491 nationally) — a professional / high-income tenant draw. Strengths: commute A+, cost of living A+, housing A+; Watch: employment C-, crime F.
- Columbus City School District (urban): math 15% / reading 26% proficiency, ranked #626 of 656 in OH (top 95%) — low school quality limits family demand, transient renter base, plan for 1-2y turnover; 72% free/reduced lunch — lower-income household profile, screen leases tightly.
- Market conditions: Rents rising fast (+4.5%/yr); 187 active listings in the ZIP; 24 comparable units currently listed for rent nearby; rentals at typical pace (median 24d on market — plan ~3-4 weeks tenant-placement turnaround); 8,139 units permitted in Franklin County in 2024 (5,940 in 5+ unit buildings).
Forward outlook
- Local home prices are declining (-3.0%/yr); year-one equity from $415 of loan paydown is wiped out by about $2k of value loss. Plan a longer hold.
- Franklin County population projected at +34% by 2050 — long-run rental-demand tailwind backs the buy-and-hold thesis.
- At projected returns (-3.0% appreciation + 4.5% rent growth), your $17k cash investment doubles in ~6 years — after that, you're playing with house money.
Negotiation context
- It's been on market 50 days — a 3% lower offer ($58k) is reasonable based on typical stale-listing flexibility.
- 3 sale attempts since 27y ago with the ask held roughly flat each time — persistent listings suggest the price (not the market) is what's stuck; bring a comps-based counter.
- Current owner paid $15k; list at $60k implies a 300% gain — meaningful room to come down on a strong offer.
Risks & watch-outs
- Watch-outs: property tax is 3.1% of price; built in 1910 — expect roof / HVAC / electrical / plumbing capex.
Questions for the listing agent
- It's been on market 50 days. Have you received any prior offers? Is the seller open to a 3% concession, seller financing, or rate buy-down credit?
- Built in 1910 — when were the roof, HVAC, electrical panel, plumbing, and water heater last replaced?
- Property tax is high relative to price — has the assessment been appealed recently, and will the sale trigger a re-assessment?
- Is there a deadline driving the sale (1031 exchange, divorce, estate, relocation)? That informs how much negotiation room exists.
- Crime grade is F in this area — have there been break-ins, vandalism, or insurance claims at this property in the last 3 years? What carrier currently insures it and at what premium?
- What's the average days-on-market for RENTAL listings here right now (not sales)? A rising rental-DOM trend means longer vacancies and softer asking-rent achievability than the comps imply.
- What's the recent tenant-quality profile in this submarket — average credit score on applications, eviction rate, late-payment / NSF rate, and stable-employment percentage? A property-management company in the area should have these aggregated.
- How much new for-sale + rental construction is in the pipeline within 1–3 miles? Heavy new supply typically softens prices + rents 12–24 months out; constrained supply supports both.
Investment metrics
- 1% rule
- 1.61% ✓
- Cap rate
- 11.61%
- Cash-on-cash
- 18.99%
- DSCR
- 1.84
- GRM
- 5.2
CMA / ARV
- ARV (median comp)
- $95,592
- List price
- $60,000
- Delta
- -37.23%
- Verdict
- UNDERPRICED
- Comps
- 20 within 1.0 mi
Show comp detail 12 sales within ~0.75 mi
| Address | Dist | Beds/Ba | Sqft | Sold | Price | $/sf | Match |
|---|---|---|---|---|---|---|---|
| 346 S Eureka Ave | 0.17mi | 1/1.0 | 600 (-12%) | 7mo | $50,000 | $83 | 67 |
| 2239 Amherst Ave | 0.36mi | 2/1.0 (+1) | 700 (+3%) | 21mo | $106,500 | $152 | 55 |
| 2251 Amherst Ave | 0.36mi | 2/1.0 (+1) | 720 (+6%) | 16mo | $89,000 | $124 | 55 |
| 325 S Burgess Ave | 0.39mi | 1/1.0 | 624 (-8%) | 18mo | $92,500 | $148 | 54 |
| 439 S Warren Ave | 0.52mi | 2/1.0 (+1) | 720 (+6%) | 9mo | $157,000 | $218 | 53 |
| 648 Whitethorne Ave | 0.51mi | 2/1.0 (+1) | 732 (+8%) | 7mo | $80,000 | $109 | 52 |
| 911 Clarendon Ave | 0.75mi | 2/1.0 (+1) | 707 (+4%) | 2mo | $109,000 | $154 | 52 |
| 2268 Whitehead Rd | 0.62mi | 2/1.0 (+1) | 672 (-1%) | 17mo | $139,900 | $208 | 51 |
| 610 Whitethorne Ave | 0.46mi | 2/1.0 (+1) | 732 (+8%) | 14mo | $143,000 | $195 | 49 |
| 244 Wrexham Ave | 0.50mi | 2/1.0 (+1) | 748 (+10%) | 9mo | $70,000 | $94 | 48 |
| 730 S Burgess Ave | 0.60mi | 2/1.0 (+1) | 768 (+13%) | 7mo | $167,000 | $217 | 39 |
| 296 Lechner Ave | 0.51mi | 2/1.0 (+1) | 588 (-13%) | 20mo | $75,000 | $128 | 33 |
Match score weights: distance 35% · size 25% · config 20% · recency 20%. Top-matched comps best support the ARV.
Projected returns pro-forma
-3.0% appreciation · 4.49% rent growth · sell at horizon
- IRR
- 12.8%
- Equity multiple
- 1.52×
- Total profit
- $8,743
- Equity at exit
- $8,946
- IRR
- 23.0%
- Equity multiple
- 3.14×
- Total profit
- $35,893
- Equity at exit
- $5,188
Cash invested: $16,800 (down + closing). Projections, not guarantees.
Landlord ↔ Tenant lean methodology
- Overall (STATE)
- 73 Landlord-Friendly
- State Ohio
- 73 Landlord-Friendly · R+6
- County
- — inherits STATE
- City
- — inherits STATE
ZIP-level market 43204
- Rents YoY
- 4.5%
- Active inventory
- 187
- Price-to-rent
- 5.2×
Monthly cashflow live
- Estimated rent
- $965 high interval (Pro) →
- Mortgage (P&I)
- −$315
- Tax from tax record
- −$157 /mo · $1,887/yr
- Insurance
- −$25
- HOA
- −$0
- Vacancy / Maint / Mgmt
- −$203
- Net cashflow
- $266
Break-even live
UW: 25.0% down · 7.5% · 30yr · 1.5% tax · 5.0% vac · 8.0% maint · 8.0% mgmt
Financing live
Cash to close
- Down payment
- $15,000
- Closing costs
- $1,800
- Reserves months
- —
- Total cash needed
- —
Loan-product check · same deal, 3 products live
Conventional
25% down · 7.5% · 30yr
- Down + closing
- —
- Monthly P&I
- —
- Monthly cashflow
- —
- DSCR
- —
- Eligible?
- —
Personal DTI + credit; lowest rate.
DSCR
20% down · 8.5% · 30yr
- Down + closing
- —
- Monthly P&I
- —
- Monthly cashflow
- —
- DSCR
- —
- Eligible?
- —
No personal income docs; deal must DSCR.
Hard money
10% down · 12.0% · 12mo
- Down + closing
- —
- Monthly P&I
- —
- Monthly cashflow
- —
- DSCR
- —
- Eligible?
- —
Short-term bridge; refi at stabilization.
Rent comps 24 comps
| Address | Beds | Baths | Sqft | Rent | $/sqft | DOM | Units | Dist |
|---|---|---|---|---|---|---|---|---|
| 2400 Pomola St Columbus, OH | 1.0 | 1.0 | 500 | $1,175 | $2.35 | 3d | 1 | 0.37mi |
| 375 S Burgess Ave Columbus, OH | 2.0 | 1.0 | 732 | $950 | $1.30 | 3d | 1 | 0.38mi |
| 375 S Burgess Ave Columbus, OH | 2.0 | 1.0 | 732 | $950 | $1.30 | 19d | 1 | 0.38mi |
| 664 S Wheatland Ave Unit 1 Columbus, OH | 1.0 | 1.0 | 700 | $895 | $1.28 | 11d | 1 | 0.44mi |
| 366 Wrexham Ave #366 Columbus, OH | 1.0 | 1.0 | 486 | $895 | $1.84 | 23d | 1 | 0.47mi |
| 685 S Wheatland Ave Columbus, OH | 1.0 | 1.0 | 640 | $850 | $1.33 | 43d | 1 | 0.47mi |
| 2085 W Broad St Apt 209 Columbus, OH | 1.0 | 1.0 | 505 | $820 | $1.62 | 23d | 1 | 0.61mi |
| 1963 W Broad St Apt 8 Columbus, OH | 1.0 | 1.0 | 600 | $820 | $1.37 | 23d | 1 | 0.73mi |
| 2895 Sullivant Ave Unit 6 Columbus, OH | 1.0 | 1.0 | 600 | $810 | $1.35 | 23d | 1 | 0.81mi |
| 839-841 S Ogden Ave Columbus, OH | 2.0 | 1.0 | 727 | $1,000 | $1.38 | 1d | 1 | 0.83mi |
| 216 N Wheatland Ave Columbus, OH | 1.0 | 1.0 | 750 | $823 | $1.10 | 7d | 2 | 0.84mi |
| 1773 W Mound St Unit 1799 Columbus, OH | 1.0 | 1.0 | 700 | $900 | $1.29 | 43d | 1 | 0.97mi |
| 1773 W Mound St Unit 1803 Columbus, OH | 1.0 | 1.0 | 700 | $925 | $1.32 | 43d | 1 | 0.97mi |
| 264-276 N Powell Ave Apt C Columbus, OH | 2.0 | 1.0 | 750 | $975 | $1.30 | 7d | 1 | 1.17mi |
| 1231 Woodbrook Ct Columbus, OH | 1.0 | 1.0 | 718 | $925 | $1.29 | 17d | 1 | 1.26mi |
| 1485 Walsh Ave Columbus, OH | 2.0 | 1.0 | 720 | $1,450 | $2.01 | 23d | 1 | 1.26mi |
| 810 Harrisburg Pike Columbus, OH | — | 1.0 | 480 | $795 | $1.66 | 23d | 1 | 1.31mi |
| 800 Harrisburg Pike Columbus, OH | — | 1.0 | 480 | $795 | $1.66 | 43d | 1 | 1.32mi |
| 802 Harrisburg Pike Columbus, OH | — | 1.0 | 500 | $795 | $1.59 | 43d | 1 | 1.32mi |
| 65 N Brinker Ave Columbus, OH | 1.0 | 1.0 | 750 | $975 | $1.30 | 43d | 1 | 1.33mi |
| 287 S Central Ave Unit 285 Columbus, OH | 1.0 | 1.0 | 704 | $870 | $1.24 | 17d | 1 | 1.34mi |
| 120 S Central Ave Columbus, OH | 1.0–3.0 | 1.0–2.0 | 944 | $530 | $0.56 | 14d | 12 | 1.42mi |
| 1045 Binns Blvd Unit A Columbus, OH | 2.0 | 1.0 | 731 | $905 | $1.24 | 23d | 1 | 1.43mi |
| 160 N Sylvan Ave Unit 3 Columbus, OH | 1.0 | 1.0 | 442 | $795 | $1.80 | 7d | 1 | 1.47mi |
Listing history 20 events
-
2026-06-18days on market $60,000 Active 50 DOM
-
2026-06-17days on market $60,000 Active 49 DOM
-
2026-06-16days on market $60,000 Active 48 DOM
-
2026-06-15days on market $60,000 Active 47 DOM
-
2026-06-13days on market $60,000 Active 45 DOM
-
2026-06-13days on market $60,000 Active 44 DOM
-
2026-06-09days on market $60,000 Active 41 DOM
-
2026-06-08days on market $60,000 Active 40 DOM
-
2026-06-07days on market $60,000 Active 39 DOM
-
2026-06-05days on market $60,000 Active 36 DOM
-
2026-06-03days on market $60,000 Active 35 DOM
-
2026-06-02days on market $60,000 Active 34 DOM
-
2026-06-01days on market $60,000 Active 33 DOM
-
2026-05-31days on market $60,000 Active 32 DOM
-
2026-04-29$60,000 Active 72-char remark
-
2000-04-20soldstatus $15,000 137-char remark
Show marketing remark (137 chars)
FINE HOME FOR THE PRICE! COULD BE GOOD RENTAL AT $200 PER MONTH. MONEYBACK IN JUST OVER 7 YEARS. GOOD RETURN ON INVESTMENT. EASY TO SHOW.
-
2000-04-10historical 137-char remark
Show marketing remark (137 chars)
FINE HOME FOR THE PRICE! COULD BE GOOD RENTAL AT $200 PER MONTH. MONEYBACK IN JUST OVER 7 YEARS. GOOD RETURN ON INVESTMENT. EASY TO SHOW.
-
2000-02-10$17,250 137-char remark
Show marketing remark (137 chars)
FINE HOME FOR THE PRICE! COULD BE GOOD RENTAL AT $200 PER MONTH. MONEYBACK IN JUST OVER 7 YEARS. GOOD RETURN ON INVESTMENT. EASY TO SHOW.
-
1999-12-29historical
-
1999-08-11$17,499
ⓘ Source: listings_history table (triggers on properties + properties_extension) + one-shot
backfill from property_details.listing_events for pre-trigger history.
Tax reassessment forecast OH · Partial reset (capped growth)
- Current annual tax
- $1,887 · $157/mo
- Projected year-2 tax
- $1,887 · $157/mo
- Expected delta
- $0/yr ($0/mo · 0.0%)
ⓘ Screening estimate from a state-policy table — verify with the county assessor before closing.
Climate risk First Street
- Flood 3/10 Moderate FEMA zone X (unshaded) · 10% chance over 30 yrs
- Wildfire 1/10 Low
- Heat 4/10 Moderate 7 d/yr ≥100°F today · 18 d/yr by 30 yrs out
- Wind 2/10 Low 100% chance of damaging wind over 30 yrs
- Air quality 2/10 Low 1 unhealthy d/yr today · 2 by 30 yrs out
Nearby sold comps map
Loading sold comps map…
Walkable amenities ~0.75 mi
Loading nearby amenities…
Taxation est. · year 1
- Rental income
- $11,586
- − Mortgage interest
- −$3,361
- − Property taxes
- −$1,887
- − Insurance
- −$300
- − Repairs & maintenance
- −$927
- − Management
- −$927
- − Depreciation
- −$1,745
- Taxable income
- $2,439
- Est. tax owed @ 24.0%
- −$585
- After-tax cash flow
- $2,605/yr
For passive investors: Depreciation is non-cash, so a rental often shows a tax loss while cash-flowing — sheltering income. Rental losses are passive: they offset passive income freely, and up to $25,000/yr can offset ordinary (W-2) income if you actively participate and your MAGI is under $100k (phasing out to $0 by $150k); unused losses carry forward. On sale, claimed depreciation is recaptured at up to 25%, and gains may owe capital-gains tax (a 1031 exchange can defer both). Figures are a year-1 estimate at your 24.0% rate — not tax advice; consult a CPA.
Schools (NCES district)
- District
- Columbus City School District
- NCES district ID
- 3904380
- Math proficiency
- 15% ▼ -17.00%
- Reading proficiency
- 26% ▼ -12.00%
- Median HH income
- $38,483
- Composite
- 17.19/100
- National rank
- #9105
- State rank
- #626 of 656 in OH
Livability — Columbus
- Score
- 81/100
- State rank
- #97
- US rank
- #1491
Category grades
Schools grade is shown separately in the Schools card above.
Census & demographics
- Census place
- Columbus, OH
- County
- Franklin County · 1,351,780 people
- City population
- 612,189
- Metro
- Columbus, OH
- Population (ZIP)
- 42,962
- Household income
- $59,266
- Rent vs Own
- Severe rent burden
- 2290.0
Population outlook (Franklin County) Hauer SSP2
- Today (2025)
- 1,456,139 people
- By 2030
- 1,556,890 · +6.9%
- By 2040
- 1,757,349 · +20.7%
- By 2050
- 1,950,539 · +34.0%
- By 2075
- 2,376,171 · +63.2%
- By 2100
- 2,636,796 · +81.1%
Race, ethnicity, and origin ACS 2023
- Neighborhood character
- Diverse neighborhood (Simpson 0.58)
- Race & ethnicity
- White 61% Hispanic / Latino 16% Black 13% Two or more races 12% Asian 3%
- Hispanic origin (detail)
- Mexican 9%
- Common ancestry
- Lithuanian 1% Slovak 1% Romanian 1%
- Foreign-born
- 13% · Canada
- Languages at home
- 81% English-only · Spanish 13% Arabic 2% Other Asian/Pacific 1%
Political lean MEDSL · Franklin
- 2024 margin
- Strong D (+28.4) · D 63.7% · R 35.3% · Other 1.0%
- 2008→2024 swing
- +7.7pp toward D · 2008: 20.7pp · 2024: 28.4pp
- All cycles
- 2024: D+28.4 2020: D+31.4 2016: D+25.9 2012: D+21.7 2008: D+20.7
Not yet ingested
- Civics
- —
Market trends
- HPI YoY
- ▼ -220.67%
- Current HPI
- 265.7711
- Rent YoY
- ▲ 4.49%
- Metro
- Columbus, OH
- State GDP YoY
- ▲ 1.98%
- F500 in state
- 48
Industry mix (Fortune 500 HQ in OH)
| Industry | F500 HQs | Revenue |
|---|---|---|
| Insurance | 3 | $145B |
|
||
| Industrial Machinery | 3 | $49B |
|
||
| Financial Services | 3 | $24B |
|
||
| Consumer Goods | 2 | $93B |
|
||
| Aerospace / Defense | 2 | $47B |
|
||
| Utilities | 2 | $33B |
|
||
Price history
+242.9% since first listed6 events — show timeline
- 2026-04-29 Listed $60,000 CBRMLS
- 2000-04-20 Sold (MLS) $15,000 CBRMLS
- 2000-04-10 Listing Removed — CBRMLS
- 2000-02-10 Listed $17,250 CBRMLS
- 1999-12-29 Listing Removed — CBRMLS
- 1999-08-11 Listed $17,499 CBRMLS
Property tax history
+16.9%/yrLatest (2024): $1,887 · +14.6% YoY. Source: county tax records.
Cash-flow waterfall
monthlySold comps — $/sqft
last 12 mo · ≤1 miLoading sold comps…