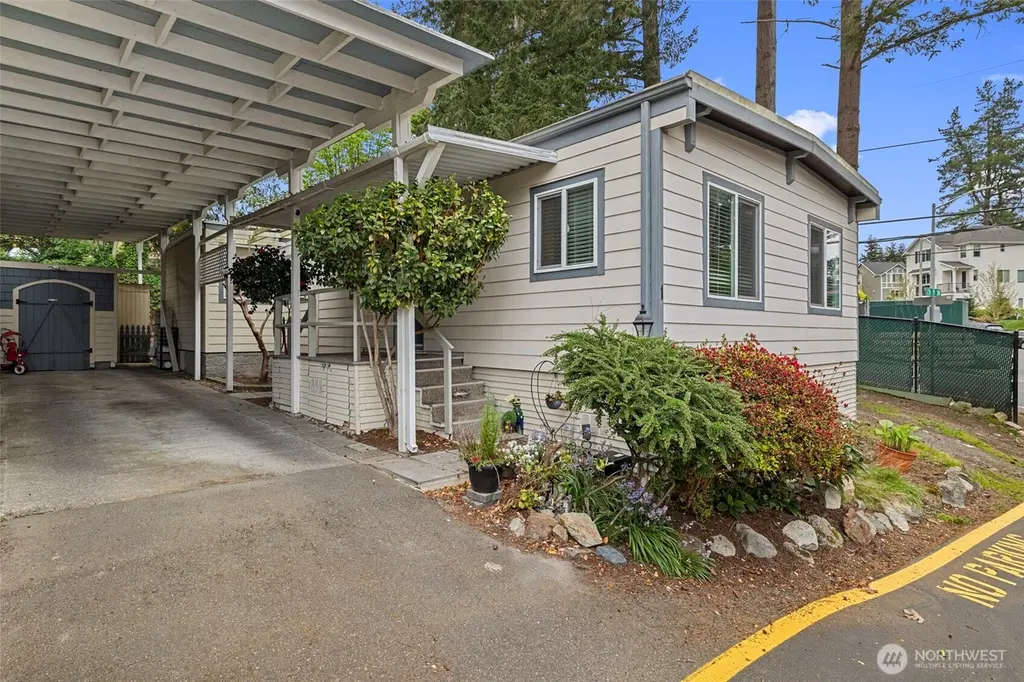
23121 Edmonds Way #1 · Esperance, WA
Flood risk No data
- FEMA flood zone
- —
- Chance of flooding over 30 yrs
- —
- Est. flood insurance / yr
- —
Fire risk No data
- Est. fire insurance / yr
- —
Heat risk No data
- Hot days now (above threshold)
- —
- Hot days in 30 yrs
- —
Wind risk No data
- Chance of severe wind over 30 yrs
- —
Air-quality risk No data
- Unhealthy air days now
- —
- Unhealthy air days in 30 yrs
- —
Risk factors via First Street. Map © Google.
Why this score? — see what drove the B grade
The composite is a weighted blend of 9 inputs, each scored 0–100. Each bar is that input's sub-score; the figure is the points it added to the 100-point composite (weight × sub-score).
- Cash flow +29.6/30.0
- DSCR +10.0/10.0
- 1% rule +8.3/10.0
- ARV discount +6.4/15.0
- Schools +5.4/10.0
- Livability +4.4/5.0
- Rent growth +4.3/5.0
- Condition / age +2.5/5.0
- Appreciation +0.0/10.0
$175,000
🖨 Deal sheet (PDF) 📄 Offer letter ✓ Due diligence
Listing remarks
Conveniently located in Ridge Acres all-ages park and just minutes from everything Edmonds offers, this roomy doublewide presents a special opportunity with a versatile two-kitchen layout—each with separate entrances and living areas—ideal for an in-law setup. Bright and well-maintained, the spacious home features 3 bedrooms, den, 2 bathrooms, a tastefully updated kitchen, newer paint, and durable laminate flooring. Step outside to your private, landscaped corner-lot yard—perfect for gardening, entertaining, or relaxing in the sunshine. Additional highlights include 2 covered tandem carport spaces and 2 large storage units behind the carport. A great, affordable home in a
Key facts
- 2.67 acre lot
- 3 parking spots
- Built 1968
Property features AI
Finance
- Other: Calculated building area: 1216; Lot size approx. 2.6701 acres; Directions: West on Edmonds Way from Hwy 99, right on 232nd St SW, 2nd left into park
- Financial info: Listing terms: Cash or Conventional; Land lease: $1,204
- HOA & community: Park approved for sale; Located in Ridge Acres mobile home park with 33 homes; Pets allowed: cats and dogs
Exterior
- Parking: Carport
- Utilities: Public water; Electric service
- Home design: Manufactured double wide (FTWD 57x20); Updated/remodeled condition; One level; Manufactured house / residential property; Mobile home remains
- Construction: Cement plank and wood construction; Metal roof
- Exterior features: Cement planked and wood exterior; Patio/porch/deck; Landscaped; Corner lot; Paved
Interior
- Kitchen: Dishwasher; Garbage disposal; Microwave; Refrigerator; Stove/Range
- Bedrooms: 3 bedrooms
- Flooring: Laminate; Vinyl
- Bathrooms: 1 full bath; 1 three-quarter bath; 1 bathtub; 2 showers
- Heating & cooling: Forced air heating; Electric power
- Interior features: Den/office; Dining room; Entry; Family room; Kitchen with and without eating space; Living room; Utility room; Double pane windows
- Laundry & utility: Washer; Dryer
Neighborhood map
What this means for you Summary
Snapshot
- This is a 2-bed/1.0-bath manufactured listed at $175k.
Deal economics
- At list price, monthly cash flow is $631 ($8k/yr) — positive.
- The deal already cash-flows at list — no discount required.
- Meets the 1% rule at list price ($2k rent vs $175k).
- Recommended offer: $172k (1.5% below list) — sets the bar for market timing.
Location & tenants
- Location reads 88/100 on livability (#11 in WA, #210 nationally) — a professional / high-income tenant draw. Strengths: crime A+, commute A+, employment A+; Watch: cost of living F.
- Edmonds School District (suburban): math 54% / reading 65% proficiency, ranked #53 of 291 in WA (top 18%) — acceptable for families but not a draw, mixed tenant base, ~2y average lease.
- Market conditions: Rents rising fast (+7.0%/yr); 118 active listings in the ZIP; 30 comparable units currently listed for rent nearby; rentals leasing fast (median 6d on market — plan ~1-2 weeks tenant-placement turnaround); high-income renter base; 3,982 units permitted in Snohomish County in 2024 (1,492 in 5+ unit buildings).
Forward outlook
- Local home prices are declining (-3.0%/yr); year-one equity from $1k of loan paydown is wiped out by about $5k of value loss. Plan a longer hold.
- Snohomish County population projected at +30% by 2050 — long-run rental-demand tailwind backs the buy-and-hold thesis.
- At projected returns (-3.0% appreciation + 7.0% rent growth), your $49k cash investment doubles in ~6 years — after that, you're playing with house money.
Negotiation context
- It's been on market 27 days — a 2% lower offer ($172k) is reasonable based on typical stale-listing flexibility.
- 3 sale attempts since 24y ago with the ask held roughly flat each time — persistent listings suggest the price (not the market) is what's stuck; bring a comps-based counter.
- Current owner paid $135k; 30% above their basis — modest negotiation headroom, anchor on the comps not their cost.
Questions for the listing agent
- Built in 1968 — when were the roof, HVAC, electrical panel, plumbing, and water heater last replaced?
- Is there a deadline driving the sale (1031 exchange, divorce, estate, relocation)? That informs how much negotiation room exists.
- What's the average days-on-market for RENTAL listings here right now (not sales)? A rising rental-DOM trend means longer vacancies and softer asking-rent achievability than the comps imply.
- What's the recent tenant-quality profile in this submarket — average credit score on applications, eviction rate, late-payment / NSF rate, and stable-employment percentage? A property-management company in the area should have these aggregated.
- How much new for-sale + rental construction is in the pipeline within 1–3 miles? Heavy new supply typically softens prices + rents 12–24 months out; constrained supply supports both.
Investment metrics
- 1% rule
- 1.33% ✓
- Cap rate
- 10.62%
- Cash-on-cash
- 15.44%
- DSCR
- 1.69
- GRM
- 6.3
CMA / ARV
- ARV (median comp)
- $170,687
- List price
- $175,000
- Delta
- 2.53%
- Verdict
- FAIR
- Comps
- 1 within 2.0 mi
Show comp detail 1 sale within ~0.75 mi
| Address | Dist | Beds/Ba | Sqft | Sold | Price | $/sf | Match |
|---|---|---|---|---|---|---|---|
| 23121 Edmonds Way #1 | 0.00mi | 3/2.0 (+1) | 1,216 (0%) | 0mo | $164,000 | $135 | 91 |
Match score weights: distance 35% · size 25% · config 20% · recency 20%. Top-matched comps best support the ARV.
Projected returns pro-forma
-3.0% appreciation · 7.02% rent growth · sell at horizon
- IRR
- 10.7%
- Equity multiple
- 1.44×
- Total profit
- $21,637
- Equity at exit
- $26,093
- IRR
- 22.8%
- Equity multiple
- 3.33×
- Total profit
- $114,390
- Equity at exit
- $15,131
Cash invested: $49,000 (down + closing). Projections, not guarantees.
Landlord ↔ Tenant lean methodology
- Overall (STATE)
- 28 Tenant-Leaning
- State Washington
- 28 Tenant-Leaning · D+8
- County
- — inherits STATE
- City
- — inherits STATE
ZIP-level market 98020
- Rents YoY
- 7.0%
- Active inventory
- 118
- Price-to-rent
- 6.3×
Monthly cashflow live
- Estimated rent
- $2,329 high interval (Pro) →
- Mortgage (P&I)
- −$918
- Tax est. 1.5%
- −$219 /mo · $2,625/yr
- Insurance
- −$73
- HOA
- −$0
- Vacancy / Maint / Mgmt
- −$489
- Net cashflow
- $631
Break-even live
Sensitivity live
| Price | -10% $751 | -5% $691 | +0% $631 | +5% $570 | +10% $510 |
|---|---|---|---|---|---|
| Rent | -10% $447 | -5% $539 | +0% $631 | +5% $723 | +10% $815 |
| Rate | -1.0pp $719 | -0.5pp $675 | base $631 | +0.5pp $585 | +1.0pp $539 |
UW: 25.0% down · 7.5% · 30yr · 1.5% tax · 5.0% vac · 8.0% maint · 8.0% mgmt
Financing live
Cash to close
- Down payment
- $43,750
- Closing costs
- $5,250
- Reserves months
- —
- Total cash needed
- —
Loan-product check · same deal, 3 products live
Conventional
25% down · 7.5% · 30yr
- Down + closing
- —
- Monthly P&I
- —
- Monthly cashflow
- —
- DSCR
- —
- Eligible?
- —
Personal DTI + credit; lowest rate.
DSCR
20% down · 8.5% · 30yr
- Down + closing
- —
- Monthly P&I
- —
- Monthly cashflow
- —
- DSCR
- —
- Eligible?
- —
No personal income docs; deal must DSCR.
Hard money
10% down · 12.0% · 12mo
- Down + closing
- —
- Monthly P&I
- —
- Monthly cashflow
- —
- DSCR
- —
- Eligible?
- —
Short-term bridge; refi at stabilization.
Rent comps 30 comps
| Address | Beds | Baths | Sqft | Rent | $/sqft | DOM | Units | Dist |
|---|---|---|---|---|---|---|---|---|
| 23413 Edmonds Way Unit A6 Edmonds, WA | 2.0 | 3.0 | 1440 | $3,300 | $2.29 | 44d | 1 | 0.14mi |
| 9011 236th St SW Unit D Edmonds, WA | 2.0 | 1.0 | 804 | $1,550 | $1.93 | 18d | 1 | 0.26mi |
| 22816 Edmonds Way Edmonds, WA | 1.0–2.0 | 1.0–2.0 | 775 | $1,995 | $2.57 | 0d | 3 | 0.27mi |
| 8833 238th St SW Edmonds, WA | 2.0 | 1.0 | 975 | $1,800 | $1.85 | 44d | 1 | 0.38mi |
| 7929 236th St SW Edmonds, WA | 1.0 | 1.0 | 737 | $1,600 | $2.17 | 5d | 2 | 0.68mi |
| 9501 244th St SW Edmonds, WA | 1.0–2.0 | 1.0–2.0 | 731 | $2,897 | $3.96 | 0d | 22 | 0.69mi |
| 7918 236th St SW Edmonds, WA | 1.0 | 1.0 | 737 | $1,670 | $2.26 | 10d | 4 | 0.70mi |
| 8104 238th St SW Unit C Edmonds, WA | 2.0 | 2.5 | 1248 | $2,500 | $2.00 | 17d | 1 | 0.70mi |
| 23122 76th Ave W Edmonds, WA | 2.0 | 1.0 | 900 | $1,860 | $2.07 | 3d | 2 | 0.82mi |
| 22906 76th Ave W Edmonds, WA | 2.0 | 1.0 | 800 | $2,222 | $2.78 | 5d | 3 | 0.86mi |
| 7712 224th St SW Edmonds, WA | 3.0 | 2.5 | 1490 | $3,500 | $2.35 | 18d | 1 | 0.90mi |
| 20221 Aurora Ave N Shoreline, WA | 3.0 | 1.0–2.0 | 846 | $2,616 | $3.09 | 0d | 9 | 0.94mi |
| 1121 N 200th St Shoreline, WA | 2.0 | 1.0 | 775 | $1,529 | $1.97 | 17d | 1 | 1.13mi |
| 7909 218th St SW #6 Edmonds, WA | 2.0 | 1.0 | 946 | $2,500 | $2.64 | 0d | 1 | 1.14mi |
| 1162 N 198th St Shoreline, WA | 3.0 | 2.5 | 1410 | $2,895 | $2.05 | 25d | 1 | 1.21mi |
| 7603 218th St SW Unit A Edmonds, WA | 3.0 | 1.0 | 1000 | $2,250 | $2.25 | 5d | 1 | 1.22mi |
| 22817 Lakeview Dr Mountlake Terrace, WA | 1.0–2.0 | 1.0 | 887 | $2,135 | $2.41 | 2d | 8 | 1.26mi |
| 21323 80th Ave W Edmonds, WA | 1.0–2.0 | 1.0 | 655 | $1,585 | $2.42 | 22d | 2 | 1.27mi |
| 21319 80th Ave W Unit 21317 House Edmonds, WA | 2.0 | 1.0 | 850 | $2,400 | $2.82 | 25d | 1 | 1.29mi |
| 22715 Lakeview Dr Unit J2 Mountlake Terrace, WA | 3.0 | 1.5 | 1200 | $2,495 | $2.08 | 0d | 1 | 1.34mi |
| 2405 N 202nd Pl Shoreline, WA | 1.0–3.0 | 1.0–2.0 | 938 | $2,270 | $2.42 | 5d | 17 | 1.34mi |
| 19414 Aurora Ave N Shoreline, WA | 2.0 | 1.0 | 850 | $1,750 | $2.06 | 5d | 1 | 1.38mi |
| 21112 80th Ave W Edmonds, WA | 2.0 | 1.0 | 1000 | $1,895 | $1.90 | 18d | 1 | 1.40mi |
| 21112 80th Ave W Edmonds, WA | 2.0 | 1.0 | 1000 | $1,795 | $1.79 | 0d | 1 | 1.40mi |
| 21010 83rd Ave W Edmonds, WA | 1.0 | 1.0 | 741 | $1,950 | $2.63 | 3d | 1 | 1.42mi |
| 1022 N 192nd St Shoreline, WA | 2.0 | 1.0 | 950 | $1,750 | $1.84 | 0d | 2 | 1.45mi |
| 1022 N 192nd St Unit 2C Shoreline, WA | 2.0 | 1.0 | 950 | $1,750 | $1.84 | 24d | 1 | 1.45mi |
| 1150 N 192nd St Shoreline, WA | 2.0 | 1.0–2.0 | 777 | $2,295 | $2.95 | 0d | 12 | 1.45mi |
| 21521 73rd Pl W Unit 11 Edmonds, WA | 2.0 | 1.0 | 750 | $1,748 | $2.33 | 44d | 1 | 1.45mi |
| 1140 N 192nd St Shoreline, WA | 2.0 | 1.0 | 561 | $2,161 | $3.85 | 2d | 9 | 1.49mi |
Listing history 6 events
-
2026-04-30$175,000 Active
-
2024-04-01soldstatus $135,000 Closed
-
2024-03-20status Pending
-
2024-03-19$130,000 Active
-
2003-03-18soldstatus $30,000
-
2002-09-12$32,919
ⓘ Source: listings_history table (triggers on properties + properties_extension) + one-shot
backfill from property_details.listing_events for pre-trigger history.
Nearby sold comps map
Loading sold comps map…
Walkable amenities ~0.75 mi
Loading nearby amenities…
Taxation est. · year 1
- Rental income
- $27,948
- − Mortgage interest
- −$9,803
- − Property taxes
- −$2,625
- − Insurance
- −$875
- − Repairs & maintenance
- −$2,236
- − Management
- −$2,236
- − Depreciation
- −$5,091
- Taxable income
- $5,083
- Est. tax owed @ 24.0%
- −$1,220
- After-tax cash flow
- $6,346/yr
For passive investors: Depreciation is non-cash, so a rental often shows a tax loss while cash-flowing — sheltering income. Rental losses are passive: they offset passive income freely, and up to $25,000/yr can offset ordinary (W-2) income if you actively participate and your MAGI is under $100k (phasing out to $0 by $150k); unused losses carry forward. On sale, claimed depreciation is recaptured at up to 25%, and gains may owe capital-gains tax (a 1031 exchange can defer both). Figures are a year-1 estimate at your 24.0% rate — not tax advice; consult a CPA.
Schools (NCES district)
- District
- Edmonds School District
- NCES district ID
- 5302400
- Math proficiency
- 54% ▼ -1.00%
- Reading proficiency
- 65% ▬ 0.00%
- Median HH income
- $67,451
- Composite
- 53.94/100
- National rank
- #3026
- State rank
- #53 of 291 in WA
Livability — Esperance
- Score
- 88/100
- State rank
- #11
- US rank
- #210
Category grades
Schools grade is shown separately in the Schools card above.
Census & demographics
- Census place
- Esperance, WA
- County
- Snohomish County · 786,756 people
- Metro
- Seattle-Tacoma-Bellevue, WA
- Population (ZIP)
- 19,551
- Household income
- $130,319
- Rent vs Own
- Severe rent burden
- 433.0
Population outlook (Snohomish County) Hauer SSP2
- Today (2025)
- 899,800 people
- By 2030
- 960,975 · +6.8%
- By 2040
- 1,074,447 · +19.4%
- By 2050
- 1,171,954 · +30.2%
- By 2075
- 1,384,849 · +53.9%
- By 2100
- 1,497,296 · +66.4%
Race, ethnicity, and origin ACS 2023
- Neighborhood character
- Predominantly White (85%)
- Race & ethnicity
- White 85% Asian 6% Two or more races 5% Hispanic / Latino 3%
- Common ancestry
- Portuguese 7% Italian 5% Slovak 4%
- Foreign-born
- 9% · Canada, China, South Korea
- Languages at home
- 91% English-only · Other Indo-European 2% Other Asian/Pacific 1% Spanish 1%
Political lean MEDSL · Snohomish
- 2024 margin
- D (+19.0) · D 57.8% · R 38.9% · Other 3.3%
- 2008→2024 swing
- +0.1pp no change · 2008: 18.9pp · 2024: 19.0pp
- All cycles
- 2024: D+19.0 2020: D+20.6 2016: D+16.6 2012: D+16.2 2008: D+18.9
Not yet ingested
- Civics
- —
Market trends
- HPI YoY
- ▼ -952.13%
- Current HPI
- 339.0232
- Rent YoY
- ▲ 7.02%
- Metro
- Seattle-Tacoma-Bellevue, WA
- State GDP YoY
- ▲ 4.65%
- F500 in state
- 22
Industry mix (Fortune 500 HQ in WA)
| Industry | F500 HQs | Revenue |
|---|---|---|
| Retail | 2 | $269B |
|
||
| Technology / Retail | 1 | $638B |
|
||
| Technology | 1 | $245B |
|
||
| Telecommunications | 1 | $38B |
|
||
| Food / Beverage | 1 | $36B |
|
||
| Automotive / Trucks | 1 | $34B |
|
||
Price history
+431.6% since first listed7 events — show timeline
- 2026-05-28 Pending — NWMLS as Distributed by MLS Grid
- 2026-04-30 Listed $175,000 NWMLS as Distributed by MLS Grid
- 2024-04-01 Sold (MLS) $135,000 NWMLS as Distributed by MLS Grid
- 2024-03-20 Pending — NWMLS as Distributed by MLS Grid
- 2024-03-19 Listed $130,000 NWMLS as Distributed by MLS Grid
- 2003-03-18 Sold (MLS) $30,000 NWMLS as Distributed by MLS Grid
- 2002-09-12 Listed $32,919 NWMLS as Distributed by MLS Grid
Property tax history
+6.3%/yrLatest (2026): $345 · -1.4% YoY. Source: county tax records.
Cash-flow waterfall
monthlySold comps — $/sqft
last 12 mo · ≤1 miLoading sold comps…