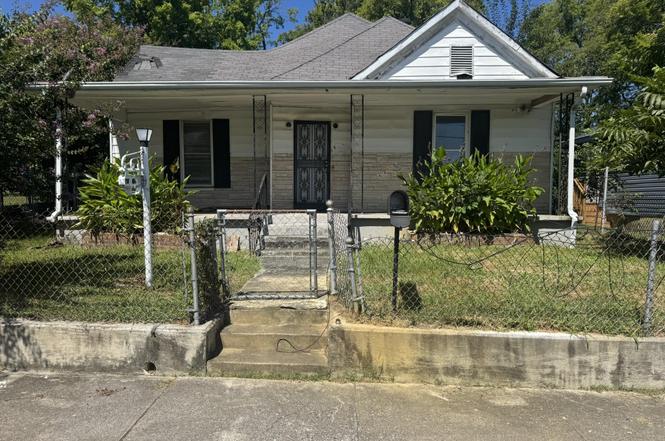
307 N Holly St · Chattanooga, TN
Flood risk 6/10 · Moderate
- FEMA flood zone
- X (unshaded)
- Chance of flooding over 30 yrs
- 0.72%
- Est. flood insurance / yr
- $507 – $1,088
Fire risk 1/10 · Minimal
- Est. fire insurance / yr
- $949 – $1,763
Heat risk 6/10 · Moderate
- Hot days now (above 104°F)
- 7 days/yr
- Hot days in 30 yrs
- 19 days/yr
Wind risk 4/10 · Minor
- Chance of severe wind over 30 yrs
- 10.0%
Air-quality risk 3/10 · Minor
- Unhealthy air days now
- 2 days/yr
- Unhealthy air days in 30 yrs
- 2 days/yr
Risk factors via First Street. Map © Google.
Why this score? — see what drove the B- grade
The composite is a weighted blend of 9 inputs, each scored 0–100. Each bar is that input's sub-score; the figure is the points it added to the 100-point composite (weight × sub-score).
- Cash flow +30.0/30.0
- 1% rule +10.0/10.0
- DSCR +10.0/10.0
- ARV discount +7.5/15.0
- Livability +3.9/5.0
- Schools +2.7/10.0
- Rent growth +2.5/5.0
- Condition / age +2.5/5.0
- Appreciation +0.0/10.0
$72,000
🖨 Deal sheet (PDF) 📄 Offer letter ✓ Due diligence
Listing remarks MLS
Three bedroom home on level lot. Home has vinyl siding, fenced yard, storage building and great front porch. Estate sale, home sold ''as is'', with no warranties except as to title. Purchase price to be approved by court.
Key facts
- 4,791 sq ft lot
- Built 1929
- Listed 224 days
Neighborhood map
What this means for you Summary
Snapshot
- This is a 3-bed/1.5-bath single-family listed at $72k.
Deal economics
- At list price, monthly cash flow is $839 ($10k/yr) — positive.
- The deal already cash-flows at list — no discount required.
- Meets the 1% rule at list price ($2k rent vs $72k).
- Recommended offer: $63k (12.0% below list) — sets the bar for market timing.
Location & tenants
- Location reads 78/100 on livability (#3 in TN, #2,582 nationally) — a middle-class / working-renter tenant base. Strengths: amenities A+, commute A+, cost of living A+; Watch: employment D+, crime F.
- Hamilton County (urban): math 31% / reading 31% proficiency, ranked #42 of 139 in TN (top 30%) — families likely to look elsewhere, expect single-tenant / working-renter base with shorter leases.
- Zoned schools: Orchard Knob Elementary (math 12% / reading 2%, grade F, #863 of 952 statewide, top 92%, 477 students, 0% FRL); Orchard Knob Middle (math 5% / reading 6%, grade F, #291 of 333 statewide, top 88%, 334 students, 0% FRL); Brainerd High School (math 2% / reading 12%, grade F, #294 of 332 statewide, top 91%, 635 students, 0% FRL) — zoned schools average 0% FRL vs 52% district-wide (52 pts lower); this property's tenant base skews higher-income than the district average.
- Zoned-school proficiency averages 7% at this address vs 31% district-wide (-24 pts) — the specific schools serving this property underperform the Hamilton County average; the district grade overstates school quality for this exact location.
- Market conditions: Rents flat; 172 active listings in the ZIP; 40 comparable units currently listed for rent nearby; rentals at typical pace (median 25d on market — plan ~3-4 weeks tenant-placement turnaround); 2,133 units permitted in Hamilton County in 2024 (405 in 5+ unit buildings).
Forward outlook
- Local home prices are declining (-3.0%/yr); year-one equity from $498 of loan paydown is wiped out by about $2k of value loss. Plan a longer hold.
- Hamilton County population projected at +23% by 2050 — long-run rental-demand tailwind backs the buy-and-hold thesis.
- At projected returns (-3.0% appreciation + 0.0% rent growth), your $20k cash investment doubles in ~3 years — after that, you're playing with house money.
Negotiation context
- It's been on market 224 days — a 12% lower offer ($63k) is reasonable based on typical stale-listing flexibility.
- 3 sale attempts; this cycle's ask has dropped $53k (42%) from the opening price — seller is motivated, your offer sets the floor, not the list.
- Current owner paid $18k; list at $72k implies a 300% gain — meaningful room to come down on a strong offer.
Risks & watch-outs
- Watch-outs: built in 1929 — expect roof / HVAC / electrical / plumbing capex.
- Climate carrying-cost: major flood risk; extreme-heat days projected 7→19/yr by 2055 (HVAC capex compounding) — expect insurance premiums to compound above CPI over the hold.
Questions for the listing agent
- It's been on market 224 days. Have you received any prior offers? Is the seller open to a 12% concession, seller financing, or rate buy-down credit?
- Built in 1929 — when were the roof, HVAC, electrical panel, plumbing, and water heater last replaced?
- Why hasn't it sold? Are there any deal-killer items the seller is aware of (foundation, flood, title, zoning, code violations)?
- Is there a deadline driving the sale (1031 exchange, divorce, estate, relocation)? That informs how much negotiation room exists.
- Schools are F-rated, which usually means shorter tenancies and higher turnover. Who's the typical renter profile here, and what's been the actual vacancy rate?
- Crime grade is F in this area — have there been break-ins, vandalism, or insurance claims at this property in the last 3 years? What carrier currently insures it and at what premium?
- What's the average days-on-market for RENTAL listings here right now (not sales)? A rising rental-DOM trend means longer vacancies and softer asking-rent achievability than the comps imply.
- What's the recent tenant-quality profile in this submarket — average credit score on applications, eviction rate, late-payment / NSF rate, and stable-employment percentage? A property-management company in the area should have these aggregated.
- How much new for-sale + rental construction is in the pipeline within 1–3 miles? Heavy new supply typically softens prices + rents 12–24 months out; constrained supply supports both.
Investment metrics
- 1% rule
- 2.24% ✓
- Cap rate
- 20.28%
- Cash-on-cash
- 49.97%
- DSCR
- 3.22
- GRM
- 3.7
CMA / ARV
- ARV (on-the-fly)
- $192,528
- Comps found
- 12
Show comp detail 12 sales within ~0.75 mi
| Address | Dist | Beds/Ba | Sqft | Sold | Price | $/sf | Match |
|---|---|---|---|---|---|---|---|
| 1609 Oak St St | 0.22mi | 3/1.0 | 1,204 (+5%) | 15mo | $122,850 | $102 | 66 |
| 1704 Walker Ave | 0.44mi | 3/2.0 | 1,144 (-0%) | 13mo | $130,000 | $114 | 66 |
| 2202 Duncan Ave | 0.70mi | 3/2.0 | 1,100 (-4%) | 2mo | $300,000 | $273 | 57 |
| 2011 Robbins St | 0.69mi | 3/1.5 | 1,120 (-2%) | 9mo | $196,000 | $175 | 56 |
| 1903 Raulston St | 0.44mi | 3/1.0 | 1,075 (-6%) | 15mo | $110,000 | $102 | 55 |
| 2013 Walker Ave | 0.60mi | 4/2.0 (+1) | 1,175 (+2%) | 14mo | $250,000 | $213 | 49 |
| 440 Roberts St | 0.29mi | 3/2.5 | 1,281 (+12%) | 18mo | $219,000 | $171 | 48 |
| 2015 Blackford St | 0.48mi | 3/2.0 | 1,248 (+9%) | 17mo | $130,000 | $104 | 47 |
| 604 Dodson Ave | 0.70mi | 3/1.0 | 1,240 (+8%) | 6mo | $149,000 | $120 | 47 |
| 1815 Carson Ave | 0.63mi | 3/1.0 | 1,042 (-9%) | 13mo | $46,500 | $45 | 42 |
| 2104 Blackford St | 0.55mi | 2/1.0 (-1) | 1,044 (-9%) | 15mo | $175,000 | $168 | 40 |
| 1132 Lincoln Park Ln | 0.70mi | 3/2.0 | 1,314 (+15%) | 2mo | $342,000 | $260 | 39 |
Match score weights: distance 35% · size 25% · config 20% · recency 20%. Top-matched comps best support the ARV.
Projected returns pro-forma
-3.0% appreciation · 0.03% rent growth · sell at horizon
- IRR
- 44.4%
- Equity multiple
- 2.84×
- Total profit
- $37,111
- Equity at exit
- $10,735
- IRR
- 49.1%
- Equity multiple
- 5.12×
- Total profit
- $83,032
- Equity at exit
- $6,225
Cash invested: $20,160 (down + closing). Projections, not guarantees.
Landlord ↔ Tenant lean methodology
- Overall (STATE)
- 87 Strongly Landlord-Friendly
- State Tennessee
- 87 Strongly Landlord-Friendly · R+13
- County
- — inherits STATE
- City
- — inherits STATE
ZIP-level market 37404
- Home prices YoY
- -30.6%
- Rents YoY
- 0.0%
- Active inventory
- 172
- Price-to-rent
- 3.7×
Monthly cashflow live
- Estimated rent
- $1,610 high interval (Pro) →
- Mortgage (P&I)
- −$378
- Tax from tax record
- −$25 /mo · $295/yr
- Insurance
- −$30
- HOA
- −$0
- Vacancy / Maint / Mgmt
- −$338
- Net cashflow
- $839
Break-even live
Sensitivity live
| Price | -10% $880 | -5% $860 | +0% $839 | +5% $819 | +10% $799 |
|---|---|---|---|---|---|
| Rent | -10% $712 | -5% $776 | +0% $839 | +5% $903 | +10% $967 |
| Rate | -1.0pp $876 | -0.5pp $858 | base $839 | +0.5pp $821 | +1.0pp $802 |
UW: 25.0% down · 7.5% · 30yr · 1.5% tax · 5.0% vac · 8.0% maint · 8.0% mgmt
Financing live
Cash to close
- Down payment
- $18,000
- Closing costs
- $2,160
- Reserves months
- —
- Total cash needed
- —
Loan-product check · same deal, 3 products live
Conventional
25% down · 7.5% · 30yr
- Down + closing
- —
- Monthly P&I
- —
- Monthly cashflow
- —
- DSCR
- —
- Eligible?
- —
Personal DTI + credit; lowest rate.
DSCR
20% down · 8.5% · 30yr
- Down + closing
- —
- Monthly P&I
- —
- Monthly cashflow
- —
- DSCR
- —
- Eligible?
- —
No personal income docs; deal must DSCR.
Hard money
10% down · 12.0% · 12mo
- Down + closing
- —
- Monthly P&I
- —
- Monthly cashflow
- —
- DSCR
- —
- Eligible?
- —
Short-term bridge; refi at stabilization.
Rent comps 40 comps
| Address | Beds | Baths | Sqft | Rent | $/sqft | DOM | Units | Dist |
|---|---|---|---|---|---|---|---|---|
| 226 N Hickory St Chattanooga, TN | 3.0 | 2.0 | 1350 | $1,895 | $1.40 | 22d | 1 | 0.11mi |
| 521 N Hawthorne St Unit A Chattanooga, TN | 2.0 | 1.0 | 725 | $850 | $1.17 | 25d | 1 | 0.27mi |
| 2001 Garfield St Chattanooga, TN | 4.0 | 2.0 | 1413 | $1,700 | $1.20 | 25d | 1 | 0.40mi |
| 2004 Garfield St Unit 102 Chattanooga, TN | 2.0 | 1.0 | 700 | $1,400 | $2.00 | 25d | 1 | 0.41mi |
| 709 N Holly St Chattanooga, TN | 3.0 | 2.0 | 1092 | $1,850 | $1.69 | 15d | 1 | 0.41mi |
| 508 S Highland Park Ave Unit 104 Chattanooga, TN | 2.0 | 1.0 | 750 | $1,050 | $1.40 | 25d | 1 | 0.44mi |
| 2009 McCallie Ave Chattanooga, TN | 2.0 | 2.0 | 1000 | $1,430 | $1.43 | 15d | 1 | 0.47mi |
| 1296 Preston St Chattanooga, TN | 2.0 | 1.0 | 850 | $950 | $1.12 | 25d | 1 | 0.48mi |
| 2111 Oak St Chattanooga, TN | 2.0 | 2.0 | 1100 | $1,595 | $1.45 | 15d | 1 | 0.53mi |
| 2003 Bailey Ave Unit 2009 304 Chattanooga, TN | 2.0 | 1.0 | 750 | $1,500 | $2.00 | 25d | 1 | 0.57mi |
| 1800 Carson Ave Chattanooga, TN | 2.0 | 1.0 | 700 | $950 | $1.36 | 15d | 1 | 0.60mi |
| 1714 Portland St Unit C Chattanooga, TN | 2.0 | 1.0 | 700 | $1,125 | $1.61 | 25d | 1 | 0.76mi |
| 513 Central Ave Chattanooga, TN | 3.0 | 2.0 | 1000 | $1,800 | $1.80 | 25d | 1 | 0.76mi |
| 949 Fortwood St Chattanooga, TN | 1.0–2.0 | 1.0 | 700 | $1,700 | $2.43 | 15d | 7 | 0.77mi |
| 2105 Rawlings St Chattanooga, TN | 3.0 | 1.0 | 1064 | $1,300 | $1.22 | 15d | 1 | 0.77mi |
| 1001 N Hickory St Unit 2 Chattanooga, TN | 2.0 | 1.0 | 776 | $875 | $1.13 | 25d | 1 | 0.78mi |
| 2011 Milne St Unit b Chattanooga, TN | 3.0 | 1.0 | 976 | $1,345 | $1.38 | 15d | 1 | 0.79mi |
| 2305 Citico Ave Unit A Chattanooga, TN | 2.0 | 1.0 | 748 | $1,095 | $1.46 | 15d | 1 | 0.82mi |
| 2420 Vine St Chattanooga, TN | 3.0 | 1.0 | 1260 | $1,800 | $1.43 | 25d | 1 | 0.83mi |
| 912 Oak St Apt 1 Chattanooga, TN | 2.0 | 2.0 | 1000 | $1,400 | $1.40 | 25d | 1 | 0.85mi |
| 2425 Chamberlain Ave Chattanooga, TN | 3.0 | 2.0 | 1422 | $1,795 | $1.26 | 25d | 1 | 0.86mi |
| 950 Riverside Dr Chattanooga, TN | 2.0 | 1.0–2.0 | 908 | $2,309 | $2.54 | 15d | 22 | 0.87mi |
| 955 E 5th St Chattanooga, TN | 2.0 | 1.0 | 776 | $1,250 | $1.61 | 25d | 1 | 0.92mi |
| 1812 E 13th St Unit B Chattanooga, TN | 2.0 | 1.0 | 800 | $1,065 | $1.33 | 25d | 1 | 0.94mi |
| 1226 Sholar Ave Chattanooga, TN | 2.0 | 1.0 | 799 | $1,099 | $1.38 | 15d | 1 | 0.94mi |
| 1228 Sholar Ave Chattanooga, TN | 2.0 | 1.0 | 799 | $1,199 | $1.50 | 25d | 1 | 0.95mi |
| 1322 District Ln Chattanooga, TN | 2.0 | 1.0–2.0 | 913 | $2,324 | $2.55 | 15d | 25 | 0.96mi |
| 1301 N Orchard Knob Ave Chattanooga, TN | 2.0 | 1.0 | 864 | $1,095 | $1.27 | 25d | 1 | 1.03mi |
| 1310 Roanoke Ave Chattanooga, TN | 2.0 | 1.0 | 792 | $1,350 | $1.70 | 25d | 1 | 1.09mi |
| 1237 Wheeler Ave Unit B Chattanooga, TN | 2.0 | 1.0 | 845 | $1,125 | $1.33 | 25d | 1 | 1.18mi |
| 2709 Citico Ave Chattanooga, TN | 2.0–3.0 | 1.0 | 1038 | $1,400 | $1.35 | 25d | 1 | 1.22mi |
| 1409 Bradt St Chattanooga, TN | 3.0 | 1.0 | 960 | $1,275 | $1.33 | 25d | 1 | 1.22mi |
| 901 E Main St Chattanooga, TN | 2.0 | 1.0 | 710 | $1,290 | $1.82 | 15d | 1 | 1.23mi |
| 2318 E Main St Chattanooga, TN | 2.0 | 2.0 | 1000 | $1,515 | $1.51 | 15d | 1 | 1.24mi |
| 900 E Main St Chattanooga, TN | 1.0–2.0 | 1.0–2.0 | 752 | $1,845 | $2.45 | 22d | 16 | 1.26mi |
| 1800 S Holtzclaw Ave Chattanooga, TN | 3.0 | 3.0 | 1500 | $2,500 | $1.67 | 25d | 1 | 1.26mi |
| 1603 Fagan St #202 Chattanooga, TN | 2.0 | 2.0 | 1048 | $1,875 | $1.79 | 25d | 1 | 1.28mi |
| 1603 Fagan St Chattanooga, TN | 2.0 | 2.0 | 1048 | $1,895 | $1.81 | 25d | 1 | 1.28mi |
| 1816 S Holly St Chattanooga, TN | 4.0 | 2.0 | 1415 | $1,700 | $1.20 | 15d | 1 | 1.29mi |
| 2009 Camden St Chattanooga, TN | 3.0 | 1.5 | 1148 | $1,450 | $1.26 | 25d | 1 | 1.30mi |
Listing history 29 events
-
2026-04-24status Pending
-
2026-04-22price $72,000
-
2026-04-22price $73,000
-
2026-04-14price $74,000
-
2026-04-09price $75,000
-
2026-04-06price $88,000
-
2026-04-02price $89,000
-
2026-03-23status Active
-
2026-03-12status Pending
-
2026-02-20price $90,000
-
2026-02-17price $90,500
-
2026-02-09price $90,999
-
2026-02-06price $91,000
-
2026-01-27price $91,500
-
2026-01-20price $92,000
-
2026-01-12price $93,000
-
2025-12-02price $94,000
-
2025-11-29price $95,000
-
2025-10-31price $98,000
-
2025-10-24price $99,000
-
2025-10-16price $100,000
-
2025-10-10price $105,000
-
2025-09-30price $110,000
-
2025-09-23price $115,000
-
2025-09-08status Active
-
2025-09-08price $120,000
-
2025-09-05status Pending
-
2025-08-28$125,000 Active
-
2013-08-20soldstatus $18,000 221-char remark
Show marketing remark (221 chars)
Three bedroom home on level lot. Home has vinyl siding, fenced yard, storage building and great front porch. Estate sale, home sold ''as is'', with no warranties except as to title. Purchase price to be approved by court.
ⓘ Source: listings_history table (triggers on properties + properties_extension) + one-shot
backfill from property_details.listing_events for pre-trigger history.
Tax reassessment forecast TN · Resets to sale price
- Current annual tax
- $295 · $25/mo
- Projected year-2 tax
- $511 · $43/mo
- Expected delta
- +$216/yr (+$18/mo · 73.2%)
ⓘ Screening estimate from a state-policy table — verify with the county assessor before closing.
Climate risk First Street
- Flood 6/10 Major FEMA zone X (unshaded) · 72% chance over 30 yrs
- Wildfire 1/10 Low
- Heat 6/10 Major 7 d/yr ≥104°F today · 19 d/yr by 30 yrs out
- Wind 4/10 Moderate 10% chance of damaging wind over 30 yrs
- Air quality 3/10 Moderate 2 unhealthy d/yr today · 2 by 30 yrs out
Nearby sold comps map
Loading sold comps map…
Walkable amenities ~0.75 mi
Loading nearby amenities…
Taxation est. · year 1
- Rental income
- $19,316
- − Mortgage interest
- −$4,033
- − Property taxes
- −$295
- − Insurance
- −$360
- − Repairs & maintenance
- −$1,545
- − Management
- −$1,545
- − Depreciation
- −$2,095
- Taxable income
- $9,443
- Est. tax owed @ 24.0%
- −$2,266
- After-tax cash flow
- $7,807/yr
For passive investors: Depreciation is non-cash, so a rental often shows a tax loss while cash-flowing — sheltering income. Rental losses are passive: they offset passive income freely, and up to $25,000/yr can offset ordinary (W-2) income if you actively participate and your MAGI is under $100k (phasing out to $0 by $150k); unused losses carry forward. On sale, claimed depreciation is recaptured at up to 25%, and gains may owe capital-gains tax (a 1031 exchange can defer both). Figures are a year-1 estimate at your 24.0% rate — not tax advice; consult a CPA.
Schools (NCES district)
- District
- Hamilton County
- NCES district ID
- 4701590
- Math proficiency
- 31% ▼ -10.00%
- Reading proficiency
- 31% ▼ -3.00%
- Median HH income
- $47,456
- Composite
- 26.8/100
- National rank
- #7122
- State rank
- #42 of 139 in TN
Livability — Chattanooga
- Score
- 78/100
- State rank
- #3
- US rank
- #2582
Category grades
Schools grade is shown separately in the Schools card above.
Census & demographics
- Census place
- Chattanooga, TN
- County
- Hamilton County · 312,777 people
- City population
- 131,999
- Metro
- Chattanooga, TN-GA
- Population (ZIP)
- 14,737
- Household income
- $56,637
- Rent vs Own
- Severe rent burden
- 486.0
Population outlook (Hamilton County) Hauer SSP2
- Today (2025)
- 393,784 people
- By 2030
- 412,983 · +4.9%
- By 2040
- 449,502 · +14.1%
- By 2050
- 484,341 · +23.0%
- By 2075
- 565,746 · +43.7%
- By 2100
- 618,394 · +57.0%
Race, ethnicity, and origin ACS 2023
- Neighborhood character
- Diverse neighborhood (Simpson 0.67)
- Race & ethnicity
- Black 38% White 38% Hispanic / Latino 21% Two or more races 11%
- Hispanic origin (detail)
- Mexican 3%
- Common ancestry
- Slovak 3% Romanian 1% Lithuanian 1%
- Foreign-born
- 11% · Canada
- Languages at home
- 81% English-only · Spanish 18%
Political lean MEDSL · Hamilton
- 2024 margin
- R (+13.1) · D 42.7% · R 55.7% · Other 1.6%
- 2008→2024 swing
- -1.2pp toward R · 2008: -11.8pp · 2024: -13.1pp
- All cycles
- 2024: R+13.1 2020: R+9.7 2016: R+16.6 2012: R+14.8 2008: R+11.8
Not yet ingested
- Civics
- —
Market trends
- HPI YoY
- ▼ -139.43%
- Current HPI
- 315.8539
- Rent YoY
- ▬ 0.03%
- Metro
- Chattanooga, TN-GA
- State GDP YoY
- ▲ 2.78%
- F500 in state
- 22
Industry mix (Fortune 500 HQ in TN)
| Industry | F500 HQs | Revenue |
|---|---|---|
| Healthcare | 3 | $91B |
|
||
| Retail | 3 | $72B |
|
||
| Transportation / Logistics | 1 | $88B |
|
||
| Paper / Packaging | 1 | $19B |
|
||
| Insurance | 1 | $13B |
|
||
| Energy | 1 | $12B |
|
||
Price history
+300.0% since first listed29 events — show timeline
- 2026-04-24 Pending — GCAR
- 2026-04-22 Price Changed $72,000 GCAR
- 2026-04-22 Price Changed $73,000 GCAR
- 2026-04-14 Price Changed $74,000 GCAR
- 2026-04-09 Price Changed $75,000 GCAR
- 2026-04-06 Price Changed $88,000 GCAR
- 2026-04-02 Price Changed $89,000 GCAR
- 2026-03-23 Relisted — GCAR
- 2026-03-12 Pending — GCAR
- 2026-02-20 Price Changed $90,000 GCAR
- 2026-02-17 Price Changed $90,500 GCAR
- 2026-02-09 Price Changed $90,999 GCAR
- 2026-02-06 Price Changed $91,000 GCAR
- 2026-01-27 Price Changed $91,500 GCAR
- 2026-01-20 Price Changed $92,000 GCAR
- 2026-01-12 Price Changed $93,000 GCAR
- 2025-12-02 Price Changed $94,000 GCAR
- 2025-11-29 Price Changed $95,000 GCAR
- 2025-10-31 Price Changed $98,000 GCAR
- 2025-10-24 Price Changed $99,000 GCAR
- 2025-10-16 Price Changed $100,000 GCAR
- 2025-10-10 Price Changed $105,000 GCAR
- 2025-09-30 Price Changed $110,000 GCAR
- 2025-09-23 Price Changed $115,000 GCAR
- 2025-09-08 Relisted — GCAR
- 2025-09-08 Price Changed $120,000 GCAR
- 2025-09-05 Pending — GCAR
- 2025-08-28 Listed $125,000 GCAR
- 2013-08-20 Sold (MLS) $18,000 GCAR
Property tax history
+2.4%/yrLatest (2025): $295 · +4.7% YoY. Source: county tax records.
Cash-flow waterfall
monthlySold comps — $/sqft
last 12 mo · ≤1 miLoading sold comps…