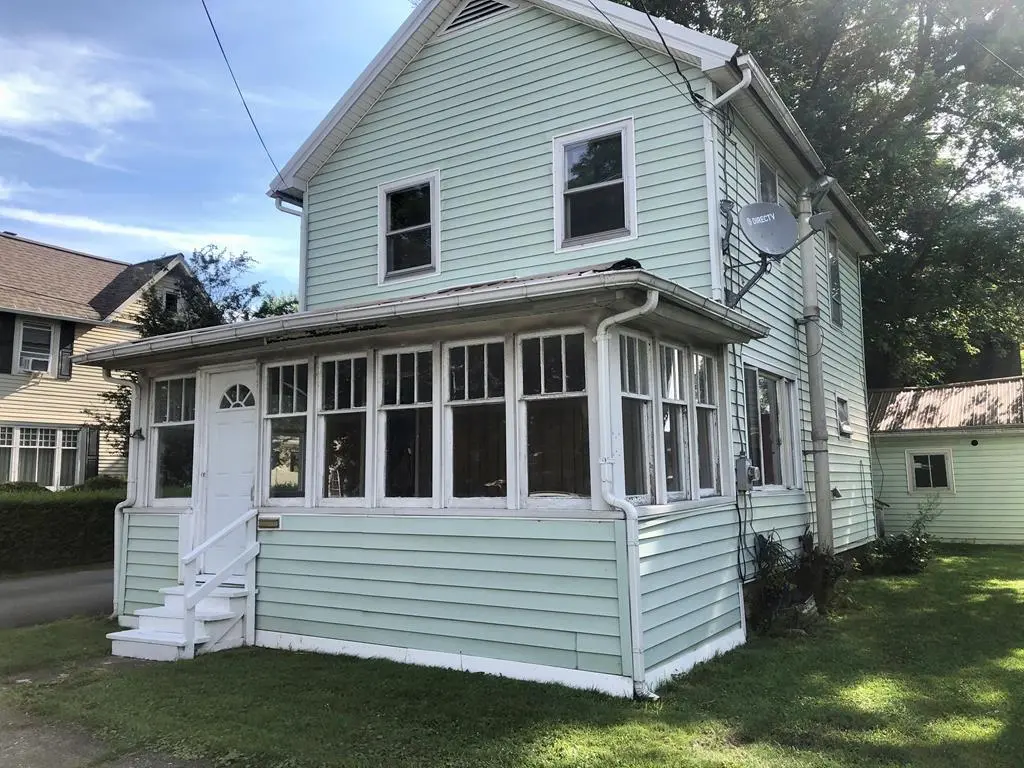
108 Dodge Ave · Corning, NY
Flood risk 5/10 · Moderate
- FEMA flood zone
- X
- Chance of flooding over 30 yrs
- 0.24%
- Est. flood insurance / yr
- $473 – $860
Fire risk 3/10 · Minor
- Est. fire insurance / yr
- $691 – $1,283
Heat risk 3/10 · Minor
- Hot days now (above 95°F)
- 8 days/yr
- Hot days in 30 yrs
- 17 days/yr
Wind risk 1/10 · Minimal
- Chance of severe wind over 30 yrs
- 1.0%
Air-quality risk 1/10 · Minimal
- Unhealthy air days now
- 0 days/yr
- Unhealthy air days in 30 yrs
- 0 days/yr
Risk factors via First Street. Map © Google.
Why this score? — see what drove the D+ grade
The composite is a weighted blend of 9 inputs, each scored 0–100. Each bar is that input's sub-score; the figure is the points it added to the 100-point composite (weight × sub-score).
- Cash flow +21.2/30.0
- DSCR +6.8/10.0
- 1% rule +5.1/10.0
- Livability +4.4/5.0
- Schools +4.2/10.0
- Rent growth +2.5/5.0
- Condition / age +2.5/5.0
- ARV discount +0.0/15.0
- Appreciation +0.0/10.0
$155,000
🖨 Deal sheet 📄 Offer letter ✓ Due diligence
Listing remarks MLS
Wonderful investment property located on Corning's North Side. Rented for several years but currently vacant. Sellers have decided to sell since there is no active lease. Priced to sell, with some TLC this home has tons of income potential for any owner or would serve as a fantastic starter home. 2 bedrooms and 1.5 Baths with a basement and pull down stairs for added storage. Enclosed front & back porches and a 1 car detached garage with a concrete floor. Metal roof new in 2013. Newer furnace and hot water tank. Close to all the action but sitting on a side street! This one won't last long!!
Key facts
- New kitchen
- Small backyard
- Granite countertops
Tags
Neighborhood map
What this means for you Summary
Snapshot
- This is a 2-bed/1.0-bath single-family listed at $155k.
Deal economics
- At list price, monthly cash flow is $225 ($3k/yr) — positive.
- The deal already cash-flows at list — no discount required.
- Meets the 1% rule at list price ($2k rent vs $155k).
Location & tenants
- Location reads 87/100 on livability (#14 in NY, #334 nationally) — a professional / high-income tenant draw. Strengths: amenities A+, housing A+, health & safety A+; Watch: employment D.
- Corning City School District (town): math 44% / reading 53% proficiency, ranked #406 of 590 in NY (top 69%) — families likely to look elsewhere, expect single-tenant / working-renter base with shorter leases.
- Market conditions: 106 active listings in the ZIP; 7 comparable units currently listed for rent nearby; rentals lingering (median 44d on market — plan ~5-8 weeks vacancy on turnover, expect pricing pressure); 100% of comp listings sitting > 30 days — soft ceiling on asking rent; 196 units permitted in Steuben County in 2024 (0 in 5+ unit buildings).
Forward outlook
- Local home prices are declining (-3.0%/yr); year-one equity from $1k of loan paydown is wiped out by about $5k of value loss. Plan a longer hold.
- Steuben County population projected at -20% by 2050 — secular population decline; favor cash flow + early exit over multi-decade hold.
Negotiation context
- Only 1 days on market — expect competitive offers; lowballing is unlikely to land.
- 2 sale attempts since 15y ago; this cycle's ask is 170% above the opening price — seller raised mid-cycle; expect resistance to lowballs.
- Current owner paid $50k; list at $155k implies a 210% gain — meaningful room to come down on a strong offer.
Risks & watch-outs
- Watch-outs: built in 1930 — expect roof / HVAC / electrical / plumbing capex.
- Climate carrying-cost: moderate flood risk — expect insurance premiums to compound above CPI over the hold.
Questions for the listing agent
- Built in 1930 — when were the roof, HVAC, electrical panel, plumbing, and water heater last replaced?
- Is there a deadline driving the sale (1031 exchange, divorce, estate, relocation)? That informs how much negotiation room exists.
- Schools are A-rated — typically a magnet for longer-tenancy family renters. What's the average tenant stay here, and is there a school-zone premium baked into asking?
- The area grade is low — what's the realistic commute time and amenity access for the typical tenant pool here? Any planned neighborhood developments (good or bad) we should know about?
- What's the average days-on-market for RENTAL listings here right now (not sales)? A rising rental-DOM trend means longer vacancies and softer asking-rent achievability than the comps imply.
- What's the recent tenant-quality profile in this submarket — average credit score on applications, eviction rate, late-payment / NSF rate, and stable-employment percentage? A property-management company in the area should have these aggregated.
- How much new for-sale + rental construction is in the pipeline within 1–3 miles? Heavy new supply typically softens prices + rents 12–24 months out; constrained supply supports both.
Investment metrics
- 1% rule
- 1.01% ✓
- Cap rate
- 8.04%
- Cash-on-cash
- 6.23%
- DSCR
- 1.28
- GRM
- 8.2
CMA / ARV
- ARV (on-the-fly)
- $123,656
- Comps found
- 12
Show comp detail 12 sales within ~0.75 mi
| Address | Dist | Beds/Ba | Sqft | Sold | Price | $/sf | Match |
|---|---|---|---|---|---|---|---|
| 330 Dodge Ave. Ext | 0.60mi | 2/1.0 | 1,114 (+4%) | 1mo | $139,900 | $126 | 63 |
| 6 E Hazel St | 0.28mi | 3/1.0 (+1) | 1,160 (+9%) | 5mo | $25,000 | $22 | 63 |
| 232 Reynolds Ave | 0.45mi | 3/1.5 (+1) | 1,069 (+0%) | 11mo | $140,000 | $131 | 62 |
| 180 Sly Ave | 0.19mi | 2/1.0 | 1,205 (+13%) | 9mo | $80,000 | $66 | 62 |
| 60 W William St | 0.16mi | 3/1.0 (+1) | 1,179 (+11%) | 10mo | $120,000 | $102 | 62 |
| 198 Princeton Ave | 0.31mi | 3/1.0 (+1) | 1,008 (-5%) | 12mo | $150,000 | $149 | 62 |
| 123 Sterling St | 0.37mi | 3/2.0 (+1) | 1,012 (-5%) | 12mo | $149,000 | $147 | 56 |
| 317 W 1st St | 0.56mi | 2/1.0 | 1,199 (+12%) | 2mo | $95,000 | $79 | 51 |
| 67 N Franklin | 0.61mi | 3/2.0 (+1) | 1,056 (-1%) | 12mo | $148,000 | $140 | 51 |
| 298 Sly Avenue Ext | 0.51mi | 3/1.0 (+1) | 996 (-7%) | 13mo | $116,000 | $116 | 49 |
| 273 Sunset Dr | 0.48mi | 2/1.0 | 1,182 (+11%) | 13mo | $75,000 | $63 | 49 |
| 290 Sunset Dr | 0.51mi | 3/1.0 (+1) | 1,204 (+13%) | 14mo | $138,900 | $115 | 38 |
Match score weights: distance 35% · size 25% · config 20% · recency 20%. Top-matched comps best support the ARV.
Projected returns pro-forma
-3.0% appreciation · 3.0% rent growth · sell at horizon
- IRR
- -6.7%
- Equity multiple
- 0.75×
- Total profit
- $-10,786
- Equity at exit
- $23,111
- IRR
- 2.9%
- Equity multiple
- 1.21×
- Total profit
- $9,026
- Equity at exit
- $13,402
Cash invested: $43,400 (down + closing). Projections, not guarantees.
Landlord ↔ Tenant lean methodology
- Overall (STATE)
- 15 Strongly Tenant-Friendly
- State New York
- 15 Strongly Tenant-Friendly · D+10
- County
- — inherits STATE
- City
- — inherits STATE
ZIP-level market 14830
- Active inventory
- 106
- Price-to-rent
- 8.2×
Monthly cashflow live
- Estimated rent
- $1,566 high interval (Pro) →
- Mortgage (P&I)
- −$813
- Tax from tax record
- −$135 /mo · $1,616/yr
- Insurance
- −$65
- HOA
- −$0
- Vacancy / Maint / Mgmt
- −$329
- Net cashflow
- $225
Break-even live
UW: 25.0% down · 7.5% · 30yr · 1.5% tax · 5.0% vac · 8.0% maint · 8.0% mgmt
Financing live
Cash to close
- Down payment
- $38,750
- Closing costs
- $4,650
- Reserves months
- —
- Total cash needed
- —
Loan-product check · same deal, 3 products live
Conventional
25% down · 7.5% · 30yr
- Down + closing
- —
- Monthly P&I
- —
- Monthly cashflow
- —
- DSCR
- —
- Eligible?
- —
Personal DTI + credit; lowest rate.
DSCR
20% down · 8.5% · 30yr
- Down + closing
- —
- Monthly P&I
- —
- Monthly cashflow
- —
- DSCR
- —
- Eligible?
- —
No personal income docs; deal must DSCR.
Hard money
10% down · 12.0% · 12mo
- Down + closing
- —
- Monthly P&I
- —
- Monthly cashflow
- —
- DSCR
- —
- Eligible?
- —
Short-term bridge; refi at stabilization.
Rent comps 7 comps
| Address | Beds | Baths | Sqft | Rent | $/sqft | DOM | Units | Dist |
|---|---|---|---|---|---|---|---|---|
| 209 Oneida Pl Corning, NY | 3.0 | 1.5 | 1200 | $2,000 | $1.67 | 44d | 1 | 0.34mi |
| 125 W Market St Corning, NY | 1.0 | 1.0 | 1026 | $1,600 | $1.56 | 44d | 1 | 0.59mi |
| 137 Field St Corning, NY | 2.0–3.0 | 1.0 | 1125 | $1,295 | $1.15 | 44d | 3 | 0.60mi |
| 90 E Market St Unit 2 Corning, NY | 2.0 | 1.0 | 1044 | $2,200 | $2.11 | 44d | 1 | 0.97mi |
| 265 Denison Pkwy E Corning, NY | 1.0–2.0 | 1.0 | 910 | $1,495 | $1.64 | 44d | 1 | 1.35mi |
| 311 Denison Pkwy E Unit 201 Corning, NY | 1.0 | 1.0 | 920 | $1,350 | $1.47 | 44d | 1 | 1.43mi |
| 122 W High St Unit 201 Painted Post, NY | 2.0 | 1.0 | 1000 | $1,150 | $1.15 | 44d | 1 | 1.45mi |
Listing history 6 events
-
2021-11-23soldstatus $50,000 604-char remark
Show marketing remark (604 chars)
Wonderful investment property located on Corning's North Side. Rented for several years but currently vacant. Sellers have decided to sell since there is no active lease. Priced to sell, with some TLC this home has tons of income potential for any owner or would serve as a fantastic starter home. 2 bedrooms and 1.5 Baths with a basement and pull down stairs for added storage. Enclosed front & back porches and a 1 car detached garage with a concrete floor. Metal roof new in 2013. Newer furnace and hot water tank. Close to all the action but sitting on a side street! This one won't last long!!
-
2021-11-23soldstatus $50,000
Show marketing remark (604 chars)
Wonderful investment property located on Corning's North Side. Rented for several years but currently vacant. Sellers have decided to sell since there is no active lease. Priced to sell, with some TLC this home has tons of income potential for any owner or would serve as a fantastic starter home. 2 bedrooms and 1.5 Baths with a basement and pull down stairs for added storage. Enclosed front & back porches and a 1 car detached garage with a concrete floor. Metal roof new in 2013. Newer furnace and hot water tank. Close to all the action but sitting on a side street! This one won't last long!!
-
2021-08-04$57,500 604-char remark
Show marketing remark (604 chars)
Wonderful investment property located on Corning's North Side. Rented for several years but currently vacant. Sellers have decided to sell since there is no active lease. Priced to sell, with some TLC this home has tons of income potential for any owner or would serve as a fantastic starter home. 2 bedrooms and 1.5 Baths with a basement and pull down stairs for added storage. Enclosed front & back porches and a 1 car detached garage with a concrete floor. Metal roof new in 2013. Newer furnace and hot water tank. Close to all the action but sitting on a side street! This one won't last long!!
-
2012-03-06soldstatus $46,500
-
2012-03-02soldstatus $46,500 100-char remark
Show marketing remark (100 chars)
Nice starter home or investment. Property on Corning's Northside. Close to shopping & schools.
-
2011-08-22$54,900 100-char remark
Show marketing remark (100 chars)
Nice starter home or investment. Property on Corning's Northside. Close to shopping & schools.
ⓘ Source: listings_history table (triggers on properties + properties_extension) + one-shot
backfill from property_details.listing_events for pre-trigger history.
Tax reassessment forecast NY · Partial reset (capped growth)
- Current annual tax
- $1,616 · $135/mo
- Projected year-2 tax
- $2,118 · $176/mo
- Expected delta
- +$502/yr (+$42/mo · 31.0%)
ⓘ Screening estimate from a state-policy table — verify with the county assessor before closing.
Climate risk First Street
- Flood 5/10 Major FEMA zone X · 24% chance over 30 yrs
- Wildfire 3/10 Moderate
- Heat 3/10 Moderate 8 d/yr ≥95°F today · 17 d/yr by 30 yrs out
- Wind 1/10 Low 100% chance of damaging wind over 30 yrs
- Air quality 1/10 Low 0 unhealthy d/yr today · 0 by 30 yrs out
Nearby sold comps map
Loading sold comps map…
Walkable amenities ~0.75 mi
Loading nearby amenities…
Taxation est. · year 1
- Rental income
- $18,795
- − Mortgage interest
- −$8,682
- − Property taxes
- −$1,616
- − Insurance
- −$775
- − Repairs & maintenance
- −$1,504
- − Management
- −$1,504
- − Depreciation
- −$4,509
- Taxable income
- $205
- Est. tax owed @ 24.0%
- −$49
- After-tax cash flow
- $2,653/yr
For passive investors: Depreciation is non-cash, so a rental often shows a tax loss while cash-flowing — sheltering income. Rental losses are passive: they offset passive income freely, and up to $25,000/yr can offset ordinary (W-2) income if you actively participate and your MAGI is under $100k (phasing out to $0 by $150k); unused losses carry forward. On sale, claimed depreciation is recaptured at up to 25%, and gains may owe capital-gains tax (a 1031 exchange can defer both). Figures are a year-1 estimate at your 24.0% rate — not tax advice; consult a CPA.
Schools (NCES district)
- District
- Corning City School District
- NCES district ID
- 3608400
- Math proficiency
- 44% ▼ -12.00%
- Reading proficiency
- 53% ▲ 4.00%
- Median HH income
- $53,042
- Composite
- 41.8/100
- National rank
- #3392
- State rank
- #406 of 590 in NY
Livability — Corning
- Score
- 87/100
- State rank
- #14
- US rank
- #334
Category grades
Schools grade is shown separately in the Schools card above.
Census & demographics
- Census place
- Corning, NY
- County
- Steuben County · 41,193 people
- City population
- 19,015
- Metro
- Corning, NY
- Population (ZIP)
- 19,015
- Household income
- $73,263
- Rent vs Own
- Severe rent burden
- 565.0
Population outlook (Steuben County) Hauer SSP2
- Today (2025)
- 93,062 people
- By 2030
- 89,793 · -3.5%
- By 2040
- 82,353 · -11.5%
- By 2050
- 74,286 · -20.2%
- By 2075
- 55,589 · -40.3%
- By 2100
- 37,587 · -59.6%
Race, ethnicity, and origin ACS 2023
- Neighborhood character
- Predominantly White (91%)
- Race & ethnicity
- White 91% Two or more races 3% Black 3% Hispanic / Latino 3% Asian 2%
- Common ancestry
- Romanian 4% Slovak 3% Lithuanian 2%
- Foreign-born
- 5% · Canada, China
- Languages at home
- 95% English-only · Russian/Polish/Slavic 1% Spanish 1% Other Asian/Pacific 1%
Political lean MEDSL · Steuben
- 2024 margin
- Solid R (+31.8) · D 34.1% · R 65.9%
- 2008→2024 swing
- -15.0pp toward R · 2008: -16.8pp · 2024: -31.8pp
- All cycles
- 2024: R+31.8 2020: R+29.6 2016: R+36.2 2012: R+16.4 2008: R+16.8
Not yet ingested
- Civics
- —
Market trends
- HPI YoY
- ▼ -94.59%
- Current HPI
- 173.9857
- Rent YoY
- —
- Metro
- Corning, NY
- State GDP YoY
- ▲ 2.60%
- F500 in state
- 92
Industry mix (Fortune 500 HQ in NY)
| Industry | F500 HQs | Revenue |
|---|---|---|
| Financial Services | 10 | $950B |
|
||
| Consumer Goods | 9 | $162B |
|
||
| Insurance | 4 | $225B |
|
||
| Telecommunications | 2 | $144B |
|
||
| Pharmaceuticals | 2 | $112B |
|
||
| Media / Entertainment | 2 | $69B |
|
||
Price history
-8.9% since first listed6 events — show timeline
- 2021-11-23 Sold (Public Records) $50,000 Public Records
- 2021-11-23 Sold (MLS) $50,000 UNYREIS
- 2021-08-04 Listed $57,500 UNYREIS
- 2012-03-06 Sold (Public Records) $46,500 Public Records
- 2012-03-02 Sold (MLS) $46,500 UNYREIS
- 2011-08-22 Listed $54,900 UNYREIS
Property tax history
+2.4%/yrLatest (2025): $1,616 · -1.9% YoY. Source: county tax records.
Cash-flow waterfall
monthlySold comps — $/sqft
last 12 mo · ≤1 miLoading sold comps…