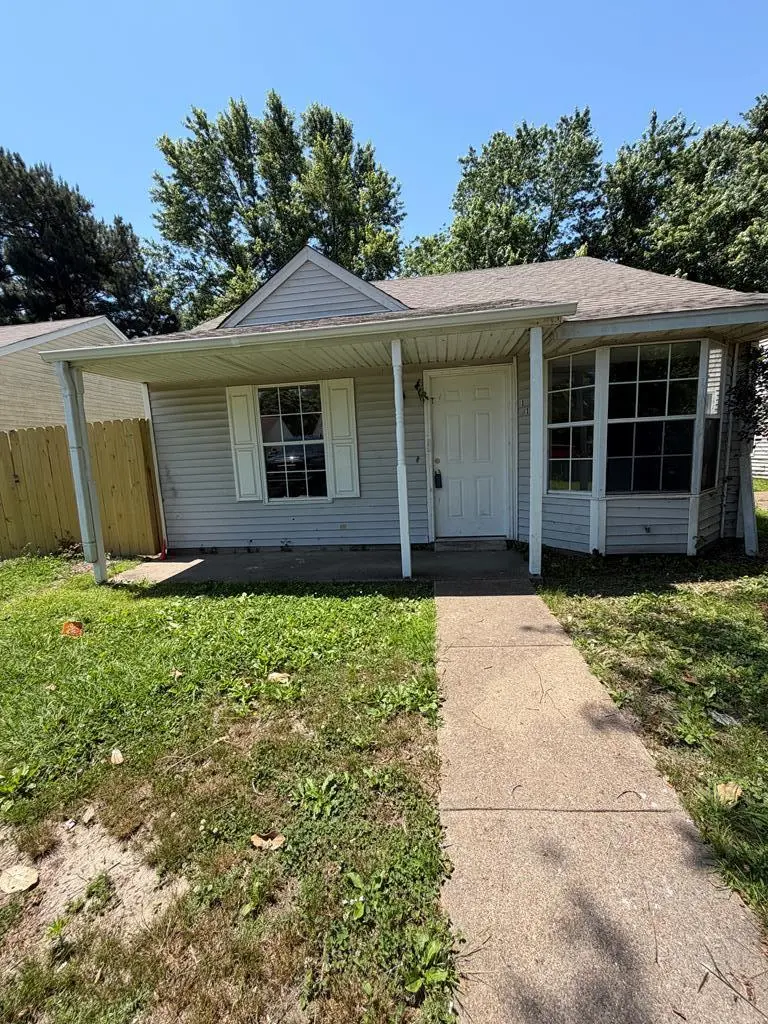
113 Sherwood Cv · Marion, AR
Flood risk 1/10 · Minimal
- FEMA flood zone
- X (shaded)
- Chance of flooding over 30 yrs
- 0.0%
- Est. flood insurance / yr
- $507 – $1,088
Fire risk 1/10 · Minimal
- Est. fire insurance / yr
- $1,499 – $2,785
Heat risk 7/10 · Major
- Hot days now (above 109°F)
- 7 days/yr
- Hot days in 30 yrs
- 21 days/yr
Wind risk 4/10 · Minor
- Chance of severe wind over 30 yrs
- 17.0%
Air-quality risk 2/10 · Minimal
- Unhealthy air days now
- 2 days/yr
- Unhealthy air days in 30 yrs
- 2 days/yr
Risk factors via First Street. Map © Google.
Why this score? — see what drove the D+ grade
The composite is a weighted blend of 9 inputs, each scored 0–100. Each bar is that input's sub-score; the figure is the points it added to the 100-point composite (weight × sub-score).
- Cash flow +24.4/30.0
- DSCR +7.9/10.0
- 1% rule +5.1/10.0
- Livability +3.2/5.0
- Rent growth +2.5/5.0
- Condition / age +2.5/5.0
- ARV discount +2.2/15.0
- Schools +2.1/10.0
- Appreciation +0.0/10.0
$111,900
🖨 Deal sheet 📄 Offer letter ✓ Due diligence
Listing remarks
Great opportunity for investors, downsizers, or anyone looking for an affordable single-family home in Marion! Located on a quiet cove, 113 Sherwood Cv offers low-maintenance living with a functional layout and comfortable living spaces. Whether you're looking to add to your rental portfolio, purchase your first investment property, or find a cozy place to call home, this property has plenty of potential. Conveniently located near schools, shopping, dining, and quick interstate access for an easy commute to Memphis. Don't miss this versatile opportunity in a desirable Marion location!
Key facts
- Easy commute
- Functional layout
- Conveniently located
Tags
Property features AI
Finance
- Other: Located in the Forrest Park subdivision
Exterior
- Parking: No garage
- Utilities: Public water; Public sewer
- Home design: One-story residential home; Vinyl siding
- Construction: Vinyl siding construction
- Exterior features: No exterior/patio features listed
Interior
- Bathrooms: 1 full bathroom
- Interior features: Central heating; Central air conditioning
Neighborhood map
What this means for you Summary
Snapshot
- This is a 3-bed/1.0-bath single-family listed at $112k.
Deal economics
- At list price, monthly cash flow is $227 ($3k/yr) — positive.
- The deal already cash-flows at list — no discount required.
- Meets the 1% rule at list price ($1k rent vs $112k).
- Recommended offer: $109k (3.0% below list) — sets the bar for market timing.
- Cap rate 8.7% vs local median 3.8% in Marion — top-decile yield for the area; either an underpriced asset or a hidden risk that comps aren't pricing in. Stress-test before assuming the spread holds.
Location & tenants
- Location reads 65/100 on livability (#147 in AR) — a middle-class / working-renter tenant base. Strengths: cost of living A+, housing A+, employment A-; Watch: schools D-, crime F, amenities F.
- Marion School District (suburban): math 21% / reading 26% proficiency, ranked #185 of 238 in AR (top 78%) — low school quality limits family demand, transient renter base, plan for 1-2y turnover.
- Market conditions: 108 active listings in the ZIP; 5 comparable units currently listed for rent nearby; rentals lingering (median 44d on market — plan ~5-8 weeks vacancy on turnover, expect pricing pressure); 60% of comp listings sitting > 30 days — soft ceiling on asking rent; 69 units permitted in Crittenden County in 2024 (0 in 5+ unit buildings).
Forward outlook
- Local home prices are declining (-3.0%/yr); year-one equity from $774 of loan paydown is wiped out by about $3k of value loss. Plan a longer hold.
- Crittenden County population projected at -26% by 2050 — secular population decline; favor cash flow + early exit over multi-decade hold.
Negotiation context
- It's been on market 36 days — a 3% lower offer ($109k) is reasonable based on typical stale-listing flexibility.
- Current owner paid $92k; 21% above their basis — modest negotiation headroom, anchor on the comps not their cost.
Risks & watch-outs
- Climate carrying-cost: extreme-heat days projected 7→21/yr by 2055 (HVAC capex compounding) — expect insurance premiums to compound above CPI over the hold.
Questions for the listing agent
- It's been on market 36 days. Have you received any prior offers? Is the seller open to a 3% concession, seller financing, or rate buy-down credit?
- Is there a deadline driving the sale (1031 exchange, divorce, estate, relocation)? That informs how much negotiation room exists.
- Schools are D-rated, which usually means shorter tenancies and higher turnover. Who's the typical renter profile here, and what's been the actual vacancy rate?
- Crime grade is F in this area — have there been break-ins, vandalism, or insurance claims at this property in the last 3 years? What carrier currently insures it and at what premium?
- The area grade is low — what's the realistic commute time and amenity access for the typical tenant pool here? Any planned neighborhood developments (good or bad) we should know about?
- What's the average days-on-market for RENTAL listings here right now (not sales)? A rising rental-DOM trend means longer vacancies and softer asking-rent achievability than the comps imply.
- What's the recent tenant-quality profile in this submarket — average credit score on applications, eviction rate, late-payment / NSF rate, and stable-employment percentage? A property-management company in the area should have these aggregated.
- How much new for-sale + rental construction is in the pipeline within 1–3 miles? Heavy new supply typically softens prices + rents 12–24 months out; constrained supply supports both.
Investment metrics
- 1% rule
- 1.01% ✓
- Cap rate
- 8.73%
- Cash-on-cash
- 8.70%
- DSCR
- 1.39
- GRM
- 8.2
CMA / ARV
- ARV (median comp)
- $100,149
- List price
- $111,900
- Delta
- 11.73%
- Verdict
- OVERPRICED
- Comps
- 20 within 1.0 mi
Show comp detail 9 sales within ~0.75 mi
| Address | Dist | Beds/Ba | Sqft | Sold | Price | $/sf | Match |
|---|---|---|---|---|---|---|---|
| 110 Sherwood Cv | 0.03mi | 2/1.0 (-1) | 874 (0%) | 5mo | $104,500 | $120 | 89 |
| 118 Lori Ln | 0.08mi | 2/1.0 (-1) | 828 (-5%) | 0mo | $95,000 | $115 | 82 |
| 38 Ridgeway Cv | 0.52mi | 2/1.0 (-1) | 874 (0%) | 3mo | $119,900 | $137 | 68 |
| 105 Cottonwood Cv | 0.07mi | 2/2.0 (-1) | 932 (+7%) | 12mo | $104,500 | $112 | 66 |
| 135 Lori Ln | 0.14mi | 3/2.0 | 981 (+12%) | 11mo | $124,300 | $127 | 60 |
| 109 Cottonwood Cv | 0.08mi | 3/1.0 | 998 (+14%) | 15mo | $107,000 | $107 | 60 |
| 90 Willow Dr | 0.12mi | 3/2.0 | 1,000 (+14%) | 9mo | $240,000 | $240 | 59 |
| 48 Flamingo Cv | 0.58mi | 3/1.0 | 924 (+6%) | 6mo | $134,000 | $145 | 59 |
| 130 Hillcrest St | 0.65mi | 3/1.0 | 994 (+14%) | 18mo | $127,000 | $128 | 32 |
Match score weights: distance 35% · size 25% · config 20% · recency 20%. Top-matched comps best support the ARV.
Projected returns pro-forma
-3.0% appreciation · 3.0% rent growth · sell at horizon
- IRR
- -3.1%
- Equity multiple
- 0.88×
- Total profit
- $-3,706
- Equity at exit
- $16,685
- IRR
- 6.5%
- Equity multiple
- 1.49×
- Total profit
- $15,219
- Equity at exit
- $9,675
Cash invested: $31,332 (down + closing). Projections, not guarantees.
Landlord ↔ Tenant lean methodology
- Overall (STATE)
- 92 Strongly Landlord-Friendly
- State Arkansas
- 92 Strongly Landlord-Friendly · R+14
- County
- — inherits STATE
- City
- — inherits STATE
ZIP-level market 72364
- Home prices YoY
- -13.3%
- Active inventory
- 108
- Price-to-rent
- 8.2×
Monthly cashflow live
- Estimated rent
- $1,134 high interval (Pro) →
- Mortgage (P&I)
- −$587
- Tax from tax record
- −$35 /mo · $424/yr
- Insurance
- −$47
- HOA
- −$0
- Vacancy / Maint / Mgmt
- −$238
- Net cashflow
- $227
Break-even live
UW: 25.0% down · 7.5% · 30yr · 1.5% tax · 5.0% vac · 8.0% maint · 8.0% mgmt
Financing live
Cash to close
- Down payment
- $27,975
- Closing costs
- $3,357
- Reserves months
- —
- Total cash needed
- —
Loan-product check · same deal, 3 products live
Conventional
25% down · 7.5% · 30yr
- Down + closing
- —
- Monthly P&I
- —
- Monthly cashflow
- —
- DSCR
- —
- Eligible?
- —
Personal DTI + credit; lowest rate.
DSCR
20% down · 8.5% · 30yr
- Down + closing
- —
- Monthly P&I
- —
- Monthly cashflow
- —
- DSCR
- —
- Eligible?
- —
No personal income docs; deal must DSCR.
Hard money
10% down · 12.0% · 12mo
- Down + closing
- —
- Monthly P&I
- —
- Monthly cashflow
- —
- DSCR
- —
- Eligible?
- —
Short-term bridge; refi at stabilization.
Rent comps 5 comps
| Address | Beds | Baths | Sqft | Rent | $/sqft | DOM | Units | Dist |
|---|---|---|---|---|---|---|---|---|
| 1120 L H Polk St Marion, AR | 1.0–3.0 | 1.0–2.0 | 985 | $1,405 | $1.43 | 1d | 9 | 1.16mi |
| 308 Gannt St Unit 308 GANNT A Marion, AR | 2.0 | 1.0 | 700 | $700 | $1.00 | 43d | 1 | 1.20mi |
| 310 Gannt St Unit 310 GANNT A Marion, AR | 2.0 | 1.0 | 700 | $700 | $1.00 | 43d | 1 | 1.20mi |
| 501 Par Dr Marion, AR | 1.0–2.0 | 1.0–2.0 | 762 | $1,330 | $1.74 | 1d | 31 | 1.24mi |
| 324 Gannt St Unit 324 GANNT A Marion, AR | 3.0 | 1.0 | 900 | $1,000 | $1.11 | 43d | 1 | 1.24mi |
Listing history 18 events
-
2026-06-18days on market $111,900 Active 36 DOM
-
2026-06-17days on market $111,900 Active 35 DOM
-
2026-06-16days on market $111,900 Active 34 DOM
-
2026-06-15days on market $111,900 Active 33 DOM
-
2026-06-13days on market $111,900 Active 31 DOM
-
2026-06-10days on market $111,900 Active 28 DOM
-
2026-06-09days on market $111,900 Active 27 DOM
-
2026-06-08days on market $111,900 Active 26 DOM
-
2026-06-07days on market $111,900 Active 25 DOM
-
2026-06-05days on market $111,900 Active 22 DOM
-
2026-06-03days on market $111,900 Active 21 DOM
-
2026-06-02days on market $111,900 Active 20 DOM
-
2026-06-01days on market $111,900 Active 19 DOM
-
2026-05-31days on market $111,900 Active 18 DOM
-
2026-05-14$111,900 Active 591-char remark
-
2022-09-13soldstatus $92,500
-
2022-03-22soldstatus $575,000
-
2003-08-20soldstatus $49,809
ⓘ Source: listings_history table (triggers on properties + properties_extension) + one-shot
backfill from property_details.listing_events for pre-trigger history.
Tax reassessment forecast AR · Resets to sale price
- Current annual tax
- $424 · $35/mo
- Projected year-2 tax
- $716 · $60/mo
- Expected delta
- +$292/yr (+$24/mo · 68.7%)
ⓘ Screening estimate from a state-policy table — verify with the county assessor before closing.
Climate risk First Street
- Flood 1/10 Low FEMA zone X (shaded) · 0% chance over 30 yrs
- Wildfire 1/10 Low
- Heat 7/10 Severe 7 d/yr ≥109°F today · 21 d/yr by 30 yrs out
- Wind 4/10 Moderate 17% chance of damaging wind over 30 yrs
- Air quality 2/10 Low 2 unhealthy d/yr today · 2 by 30 yrs out
Nearby sold comps map
Loading sold comps map…
Walkable amenities ~0.75 mi
Loading nearby amenities…
Taxation est. · year 1
- Rental income
- $13,611
- − Mortgage interest
- −$6,268
- − Property taxes
- −$424
- − Insurance
- −$560
- − Repairs & maintenance
- −$1,089
- − Management
- −$1,089
- − Depreciation
- −$3,255
- Taxable income
- $926
- Est. tax owed @ 24.0%
- −$222
- After-tax cash flow
- $2,505/yr
For passive investors: Depreciation is non-cash, so a rental often shows a tax loss while cash-flowing — sheltering income. Rental losses are passive: they offset passive income freely, and up to $25,000/yr can offset ordinary (W-2) income if you actively participate and your MAGI is under $100k (phasing out to $0 by $150k); unused losses carry forward. On sale, claimed depreciation is recaptured at up to 25%, and gains may owe capital-gains tax (a 1031 exchange can defer both). Figures are a year-1 estimate at your 24.0% rate — not tax advice; consult a CPA.
Schools (NCES district)
- District
- Marion School District
- NCES district ID
- 0509390
- Math proficiency
- 21% ▼ -8.00%
- Reading proficiency
- 26% ▼ -5.00%
- Median HH income
- $50,758
- Composite
- 20.88/100
- National rank
- #8492
- State rank
- #185 of 238 in AR
Livability — Marion
- Score
- 65/100
- State rank
- #147
- US rank
- #12733
Category grades
Schools grade is shown separately in the Schools card above.
Census & demographics
- Census place
- Marion, AR
- County
- Crittenden County · 16,034 people
- City population
- 16,034
- Metro
- Memphis, TN-MS-AR
- Population (ZIP)
- 16,034
- Household income
- $74,462
- Rent vs Own
- Severe rent burden
- 319.0
Population outlook (Crittenden County) Hauer SSP2
- Today (2025)
- 45,254 people
- By 2030
- 42,953 · -5.1%
- By 2040
- 38,235 · -15.5%
- By 2050
- 33,670 · -25.6%
- By 2075
- 24,315 · -46.3%
- By 2100
- 17,173 · -62.1%
Race, ethnicity, and origin ACS 2023
- Neighborhood character
- Diverse neighborhood (Simpson 0.61)
- Race & ethnicity
- White 51% Black 35% Two or more races 10% Hispanic / Latino 5% Asian 1%
- Common ancestry
- Italian 2% Romanian 1% Lithuanian 1%
- Foreign-born
- 3% · Canada, Dominican Republic
- Languages at home
- 96% English-only · Spanish 3% Korean 1%
Political lean MEDSL · Crittenden
- 2024 margin
- Toss-up / Even · D 50.1% · R 47.9% · Other 2.0%
- 2008→2024 swing
- -12.4pp toward R · 2008: 14.7pp · 2024: 2.3pp
- All cycles
- 2024: D+2.3 2020: D+7.2 2016: D+9.0 2012: D+18.7 2008: D+14.7
Not yet ingested
- Civics
- —
Market trends
- HPI YoY
- ▼ -31.64%
- Current HPI
- 205.4807
- Rent YoY
- —
- Metro
- Memphis, TN-MS-AR
- State GDP YoY
- ▲ 3.80%
- F500 in state
- 10
Industry mix (Fortune 500 HQ in AR)
| Industry | F500 HQs | Revenue |
|---|---|---|
| Retail | 1 | $681B |
|
||
| Food / Agriculture | 1 | $53B |
|
||
| Retail / Energy | 1 | $22B |
|
||
| Transportation / Logistics | 1 | $12B |
|
||
| Energy | 1 | $4B |
|
||
Price history
+124.7% since first listed4 events — show timeline
- 2026-05-14 Listed $111,900 EARA
- 2022-09-13 Sold (Public Records) $92,500 Public Records
- 2022-03-22 Sold (Public Records) $575,000 Public Records
- 2003-08-20 Sold (Public Records) $49,809 Public Records
Property tax history
-0.5%/yrLatest (2025): $424 · +10.1% YoY. Source: county tax records.
Cash-flow waterfall
monthlySold comps — $/sqft
last 12 mo · ≤1 miLoading sold comps…