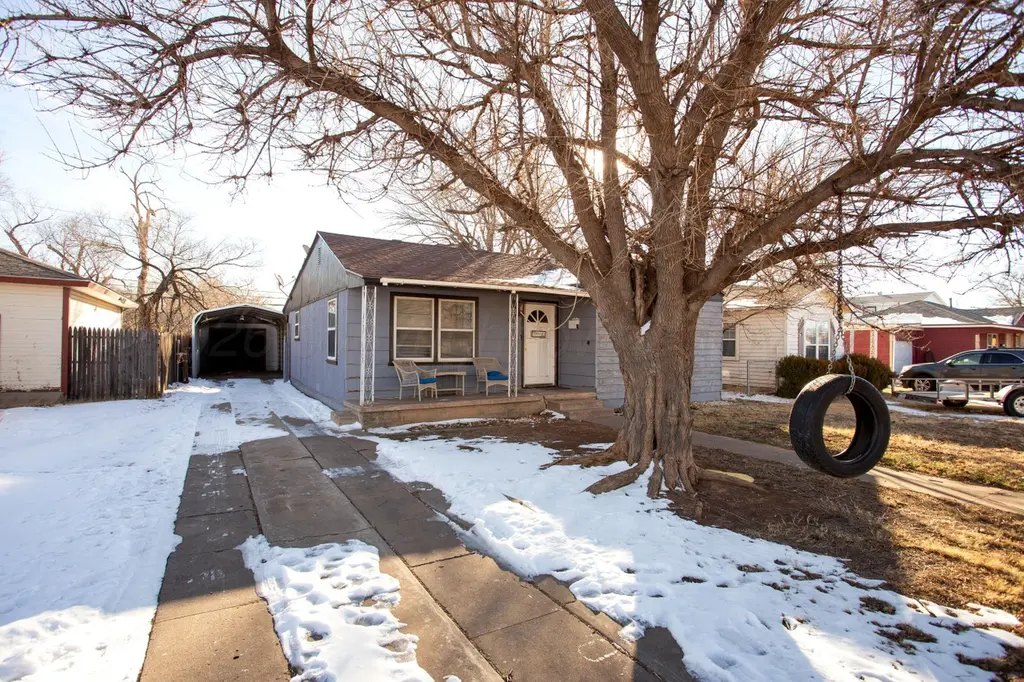
4003 S Van Buren St · Amarillo, TX
Flood risk 1/10 · Minimal
- FEMA flood zone
- X (unshaded)
- Chance of flooding over 30 yrs
- 0.0%
- Est. flood insurance / yr
- $507 – $1,088
Fire risk 9/10 · Severe
- Est. fire insurance / yr
- $1,222 – $2,270
Heat risk 4/10 · Minor
- Hot days now (above 97°F)
- 7 days/yr
- Hot days in 30 yrs
- 19 days/yr
Wind risk 2/10 · Minimal
- Chance of severe wind over 30 yrs
- —
Air-quality risk 2/10 · Minimal
- Unhealthy air days now
- 1 days/yr
- Unhealthy air days in 30 yrs
- 1 days/yr
Risk factors via First Street. Map © Google.
Why this score? — see what drove the C+ grade
The composite is a weighted blend of 9 inputs, each scored 0–100. Each bar is that input's sub-score; the figure is the points it added to the 100-point composite (weight × sub-score).
- Cash flow +22.7/30.0
- ARV discount +15.0/15.0
- DSCR +7.3/10.0
- 1% rule +6.6/10.0
- Rent growth +4.0/5.0
- Schools +3.6/10.0
- Livability +3.3/5.0
- Condition / age +2.5/5.0
- Appreciation +0.0/10.0
$155,000
🖨 Deal sheet 📄 Offer letter ✓ Due diligence
Listing remarks MLS
Check out this beauty!! This is a 4 bedroom (isolated primary suite) 2 bathroom home with 2 living areas and a very large kitchen - great for the large family gatherings! Plenty of room for guests to enjoy a special time during your special gathering. This home offers central heat and air! Its definitely a must see! Seller is Realtor in state of texas
Key facts
- 6,534 sq ft lot
- Garage
- Built 1949
Neighborhood map
What this means for you Summary
Snapshot
- This is a 3-bed/2.0-bath single-family listed at $155k.
Deal economics
- At list price, monthly cash flow is $267 ($3k/yr) — positive.
- The deal already cash-flows at list — no discount required.
- Meets the 1% rule at list price ($2k rent vs $155k).
- Recommended offer: $141k (9.0% below list) — sets the bar for market timing.
Location & tenants
- Location reads 66/100 on livability (#624 in TX) — a middle-class / working-renter tenant base. Strengths: cost of living A+, housing A+; Watch: amenities C-, schools D, crime F.
- Amarillo ISD (urban): math 44% / reading 41% proficiency, ranked #336 of 826 in TX (top 41%) — families likely to look elsewhere, expect single-tenant / working-renter base with shorter leases.
- Market conditions: Rents rising fast (+6.0%/yr); 65 active listings in the ZIP; 16 comparable units currently listed for rent nearby; rentals at typical pace (median 21d on market — plan ~3-4 weeks tenant-placement turnaround); 45 units permitted in Randall County in 2024 (0 in 5+ unit buildings).
- This rent runs 32% of the median local income ($67k/yr) — at the standard rent-burdened threshold; future hikes will face affordability resistance.
Forward outlook
- Local home prices are declining (-3.0%/yr); year-one equity from $1k of loan paydown is wiped out by about $5k of value loss. Plan a longer hold.
- Randall County population projected at +36% by 2050 — long-run rental-demand tailwind backs the buy-and-hold thesis.
- At projected returns (-3.0% appreciation + 6.0% rent growth), your $43k cash investment doubles in ~9 years — after that, you're playing with house money.
Negotiation context
- It's been on market 94 days — a 9% lower offer ($141k) is reasonable based on typical stale-listing flexibility.
- 2 sale attempts since 4y ago; this cycle's ask has dropped $15k (9%) from the opening price — seller is motivated, your offer sets the floor, not the list.
Risks & watch-outs
- Watch-outs: built in 1949 — expect roof / HVAC / electrical / plumbing capex.
- Climate carrying-cost: severe wildfire risk — expect insurance premiums to compound above CPI over the hold.
Questions for the listing agent
- It's been on market 94 days. Have you received any prior offers? Is the seller open to a 9% concession, seller financing, or rate buy-down credit?
- Built in 1949 — when were the roof, HVAC, electrical panel, plumbing, and water heater last replaced?
- Why hasn't it sold? Are there any deal-killer items the seller is aware of (foundation, flood, title, zoning, code violations)?
- Is there a deadline driving the sale (1031 exchange, divorce, estate, relocation)? That informs how much negotiation room exists.
- Schools are D-rated, which usually means shorter tenancies and higher turnover. Who's the typical renter profile here, and what's been the actual vacancy rate?
- Crime grade is F in this area — have there been break-ins, vandalism, or insurance claims at this property in the last 3 years? What carrier currently insures it and at what premium?
- What's the average days-on-market for RENTAL listings here right now (not sales)? A rising rental-DOM trend means longer vacancies and softer asking-rent achievability than the comps imply.
- What's the recent tenant-quality profile in this submarket — average credit score on applications, eviction rate, late-payment / NSF rate, and stable-employment percentage? A property-management company in the area should have these aggregated.
- How much new for-sale + rental construction is in the pipeline within 1–3 miles? Heavy new supply typically softens prices + rents 12–24 months out; constrained supply supports both.
Investment metrics
- 1% rule
- 1.16% ✓
- Cap rate
- 8.36%
- Cash-on-cash
- 7.38%
- DSCR
- 1.33
- GRM
- 7.2
CMA / ARV
- ARV (median comp)
- $193,692
- List price
- $155,000
- Delta
- -19.98%
- Verdict
- UNDERPRICED
- Comps
- 2 within 1.0 mi
Show comp detail 1 sale within ~0.75 mi
| Address | Dist | Beds/Ba | Sqft | Sold | Price | $/sf | Match |
|---|---|---|---|---|---|---|---|
| 4610 Longbird St | 0.74mi | 3/2.0 | 1,464 (-10%) | 9mo | $220,000 | $150 | 41 |
Match score weights: distance 35% · size 25% · config 20% · recency 20%. Top-matched comps best support the ARV.
Projected returns pro-forma
-3.0% appreciation · 6.04% rent growth · sell at horizon
- IRR
- -1.4%
- Equity multiple
- 0.95×
- Total profit
- $-2,386
- Equity at exit
- $23,111
- IRR
- 11.5%
- Equity multiple
- 2.03×
- Total profit
- $44,826
- Equity at exit
- $13,402
Cash invested: $43,400 (down + closing). Projections, not guarantees.
Landlord ↔ Tenant lean methodology
- Overall (STATE)
- 87 Strongly Landlord-Friendly
- State Texas
- 87 Strongly Landlord-Friendly · R+5
- County
- — inherits STATE
- City
- — inherits STATE
ZIP-level market 79110
- Rents YoY
- 6.0%
- Active inventory
- 65
- Price-to-rent
- 7.2×
Monthly cashflow live
- Estimated rent
- $1,795 high interval (Pro) →
- Mortgage (P&I)
- −$813
- Tax from tax record
- −$273 /mo · $3,281/yr
- Insurance
- −$65
- HOA
- −$0
- Vacancy / Maint / Mgmt
- −$377
- Net cashflow
- $267
Break-even live
UW: 25.0% down · 7.5% · 30yr · 1.5% tax · 5.0% vac · 8.0% maint · 8.0% mgmt
Financing live
Cash to close
- Down payment
- $38,750
- Closing costs
- $4,650
- Reserves months
- —
- Total cash needed
- —
Loan-product check · same deal, 3 products live
Conventional
25% down · 7.5% · 30yr
- Down + closing
- —
- Monthly P&I
- —
- Monthly cashflow
- —
- DSCR
- —
- Eligible?
- —
Personal DTI + credit; lowest rate.
DSCR
20% down · 8.5% · 30yr
- Down + closing
- —
- Monthly P&I
- —
- Monthly cashflow
- —
- DSCR
- —
- Eligible?
- —
No personal income docs; deal must DSCR.
Hard money
10% down · 12.0% · 12mo
- Down + closing
- —
- Monthly P&I
- —
- Monthly cashflow
- —
- DSCR
- —
- Eligible?
- —
Short-term bridge; refi at stabilization.
Rent comps 16 comps
| Address | Beds | Baths | Sqft | Rent | $/sqft | DOM | Units | Dist |
|---|---|---|---|---|---|---|---|---|
| 4308 S Jackson St Amarillo, TX | 3.0 | 1.0 | 1302 | $1,490 | $1.14 | 21d | 1 | 0.47mi |
| 3205 S Tyler St Amarillo, TX | 3.0 | 1.0 | 1381 | $1,475 | $1.07 | 13d | 1 | 0.48mi |
| 3101 S Van Buren St Amarillo, TX | 3.0 | 2.0 | 1922 | $2,300 | $1.20 | 13d | 1 | 0.55mi |
| 4316 S Hayden St Amarillo, TX | 3.0 | 1.5 | 1356 | $1,650 | $1.22 | 43d | 1 | 0.64mi |
| 2709 S Van Buren St Unit 1 Amarillo, TX | 3.0 | 2.0 | 1787 | $2,100 | $1.18 | 13d | 1 | 0.76mi |
| 4108 Crockett St Amarillo, TX | 3.0 | 1.0 | 1373 | $1,525 | $1.11 | 43d | 1 | 0.86mi |
| 4615 S Lipscomb St Amarillo, TX | 3.0 | 2.0 | 1168 | $1,000 | $0.86 | 13d | 1 | 0.93mi |
| 4611 Cline Rd Amarillo, TX | 4.0 | 1.5 | 1500 | $1,500 | $1.00 | 21d | 1 | 0.99mi |
| 608 Lochridge Amarillo, TX | 3.0 | 2.0 | 1455 | $1,900 | $1.31 | 43d | 1 | 1.00mi |
| 3610 S Austin St Amarillo, TX | 3.0 | 2.5 | 1810 | $2,100 | $1.16 | 43d | 1 | 1.02mi |
| 307 Mikeska St Amarillo, TX | 3.0 | 2.0 | 1250 | $1,800 | $1.44 | 21d | 1 | 1.21mi |
| 1128 Pikes Peak Dr Amarillo, TX | 4.0 | 2.0 | 1867 | $1,995 | $1.07 | 21d | 1 | 1.27mi |
| 2108 S Hayden St Amarillo, TX | 4.0 | 3.0 | 1951 | $2,399 | $1.23 | 21d | 1 | 1.27mi |
| 2103 Parker St Amarillo, TX | 3.0 | 2.0 | 1306 | $2,300 | $1.76 | 21d | 1 | 1.35mi |
| 2104 S Travis St Amarillo, TX | 3.0 | 1.0 | 1236 | $1,700 | $1.38 | 21d | 1 | 1.38mi |
| 2030 Crockett St Amarillo, TX | 3.0 | 1.5 | 1307 | $1,750 | $1.34 | 13d | 1 | 1.43mi |
Listing history 22 events
-
2026-06-18days on market $155,000 Active 94 DOM
-
2026-06-17days on market $155,000 Active 93 DOM
-
2026-06-16days on market $155,000 Active 92 DOM
-
2026-06-15days on market $155,000 Active 91 DOM
-
2026-06-14days on market $155,000 Active 89 DOM
-
2026-06-13days on market $155,000 Active 88 DOM
-
2026-06-10days on market $155,000 Active 86 DOM
-
2026-06-09days on market $155,000 Active 85 DOM
-
2026-06-08days on market $155,000 Active 84 DOM
-
2026-06-07days on market $155,000 Active 83 DOM
-
2026-06-03days on market $155,000 Active 79 DOM
-
2026-06-02days on market $155,000 Active 78 DOM
-
2026-06-01days on market $155,000 Active 77 DOM
-
2026-05-31days on market $155,000 Active 76 DOM
-
2026-05-30days on market $155,000 Active 75 DOM
-
2026-04-27price $155,000 354-char remark
Show marketing remark (354 chars)
Check out this beauty!! This is a 4 bedroom (isolated primary suite) 2 bathroom home with 2 living areas and a very large kitchen - great for the large family gatherings! Plenty of room for guests to enjoy a special time during your special gathering. This home offers central heat and air! Its definitely a must see! Seller is Realtor in state of texas
-
2026-04-22price $160,000 354-char remark
Show marketing remark (354 chars)
Check out this beauty!! This is a 4 bedroom (isolated primary suite) 2 bathroom home with 2 living areas and a very large kitchen - great for the large family gatherings! Plenty of room for guests to enjoy a special time during your special gathering. This home offers central heat and air! Its definitely a must see! Seller is Realtor in state of texas
-
2026-03-16$170,000 Active 354-char remark
Show marketing remark (354 chars)
Check out this beauty!! This is a 4 bedroom (isolated primary suite) 2 bathroom home with 2 living areas and a very large kitchen - great for the large family gatherings! Plenty of room for guests to enjoy a special time during your special gathering. This home offers central heat and air! Its definitely a must see! Seller is Realtor in state of texas
-
2025-04-04soldstatus
-
2022-05-22price $1,600
-
2022-03-21$155,000
-
2005-03-10soldstatus
ⓘ Source: listings_history table (triggers on properties + properties_extension) + one-shot
backfill from property_details.listing_events for pre-trigger history.
Tax reassessment forecast TX · Resets to sale price
- Current annual tax
- $3,281 · $273/mo
- Projected year-2 tax
- $3,281 · $273/mo
- Expected delta
- $0/yr ($0/mo · 0.0%)
ⓘ Screening estimate from a state-policy table — verify with the county assessor before closing.
Climate risk First Street
- Flood 1/10 Low FEMA zone X (unshaded) · 0% chance over 30 yrs
- Wildfire 9/10 Extreme
- Heat 4/10 Moderate 7 d/yr ≥97°F today · 19 d/yr by 30 yrs out
- Wind 2/10 Low
- Air quality 2/10 Low 1 unhealthy d/yr today · 1 by 30 yrs out
Nearby sold comps map
Loading sold comps map…
Walkable amenities ~0.75 mi
Loading nearby amenities…
Taxation est. · year 1
- Rental income
- $21,535
- − Mortgage interest
- −$8,682
- − Property taxes
- −$3,281
- − Insurance
- −$775
- − Repairs & maintenance
- −$1,723
- − Management
- −$1,723
- − Depreciation
- −$4,509
- Taxable income
- $842
- Est. tax owed @ 24.0%
- −$202
- After-tax cash flow
- $3,001/yr
For passive investors: Depreciation is non-cash, so a rental often shows a tax loss while cash-flowing — sheltering income. Rental losses are passive: they offset passive income freely, and up to $25,000/yr can offset ordinary (W-2) income if you actively participate and your MAGI is under $100k (phasing out to $0 by $150k); unused losses carry forward. On sale, claimed depreciation is recaptured at up to 25%, and gains may owe capital-gains tax (a 1031 exchange can defer both). Figures are a year-1 estimate at your 24.0% rate — not tax advice; consult a CPA.
Schools (NCES district)
- District
- Amarillo ISD
- NCES district ID
- 4808130
- Math proficiency
- 44% ▼ -9.00%
- Reading proficiency
- 41% ▼ -3.00%
- Median HH income
- $43,478
- Composite
- 35.96/100
- National rank
- #4798
- State rank
- #336 of 826 in TX
Livability — Amarillo
- Score
- 66/100
- State rank
- #624
- US rank
- #11876
Category grades
Schools grade is shown separately in the Schools card above.
Census & demographics
- Census place
- Amarillo, TX
- County
- Randall County · 137,351 people
- City population
- 185,802
- Metro
- Amarillo, TX
- Population (ZIP)
- 16,994
- Household income
- $66,683
- Rent vs Own
- Severe rent burden
- 208.0
Population outlook (Randall County) Hauer SSP2
- Today (2025)
- 152,140 people
- By 2030
- 163,107 · +7.2%
- By 2040
- 184,999 · +21.6%
- By 2050
- 206,948 · +36.0%
- By 2075
- 260,204 · +71.0%
- By 2100
- 294,980 · +93.9%
Race, ethnicity, and origin ACS 2023
- Neighborhood character
- Majority White (61%)
- Race & ethnicity
- White 61% Hispanic / Latino 32% Two or more races 13% Black 4% Asian 1%
- Hispanic origin (detail)
- Mexican 29%
- Common ancestry
- Italian 2% Slovak 1% Lithuanian 1%
- Foreign-born
- 5% · Canada, Vietnam
- Languages at home
- 83% English-only · Spanish 13% Other Indo-European 2% Other Asian/Pacific 1%
Political lean MEDSL · Randall
- 2024 margin
- Solid R (+60.4) · D 19.4% · R 79.8%
- 2008→2024 swing
- +2.3pp toward D · 2008: -62.7pp · 2024: -60.4pp
- All cycles
- 2024: R+60.4 2020: R+58.8 2016: R+65.1 2012: R+68.2 2008: R+62.7
Not yet ingested
- Civics
- —
Market trends
- HPI YoY
- ▼ -226.16%
- Current HPI
- 180.2164
- Rent YoY
- ▲ 6.04%
- Metro
- Amarillo, TX
- State GDP YoY
- ▲ 3.95%
- F500 in state
- 110
Industry mix (Fortune 500 HQ in TX)
| Industry | F500 HQs | Revenue |
|---|---|---|
| Energy | 16 | $1,198B |
|
||
| Technology | 5 | $198B |
|
||
| Engineering / Construction | 4 | $72B |
|
||
| Energy Services | 3 | $60B |
|
||
| Utilities | 3 | $41B |
|
||
| Healthcare | 2 | $330B |
|
||
Price history
+0.0% since first listed7 events — show timeline
- 2026-04-27 Price Changed $155,000 AARMLS
- 2026-04-22 Price Changed $160,000 AARMLS
- 2026-03-16 Listed $170,000 AARMLS
- 2025-04-04 Sold (Public Records) — Public Records
- 2022-05-22 Price Changed $1,600 RENT.
- 2022-03-21 Listed $155,000 AARMLS
- 2005-03-10 Sold (Public Records) — Public Records
Property tax history
+4.9%/yrLatest (2025): $3,281 · +1.9% YoY. Source: county tax records.
Cash-flow waterfall
monthlySold comps — $/sqft
last 12 mo · ≤1 miLoading sold comps…