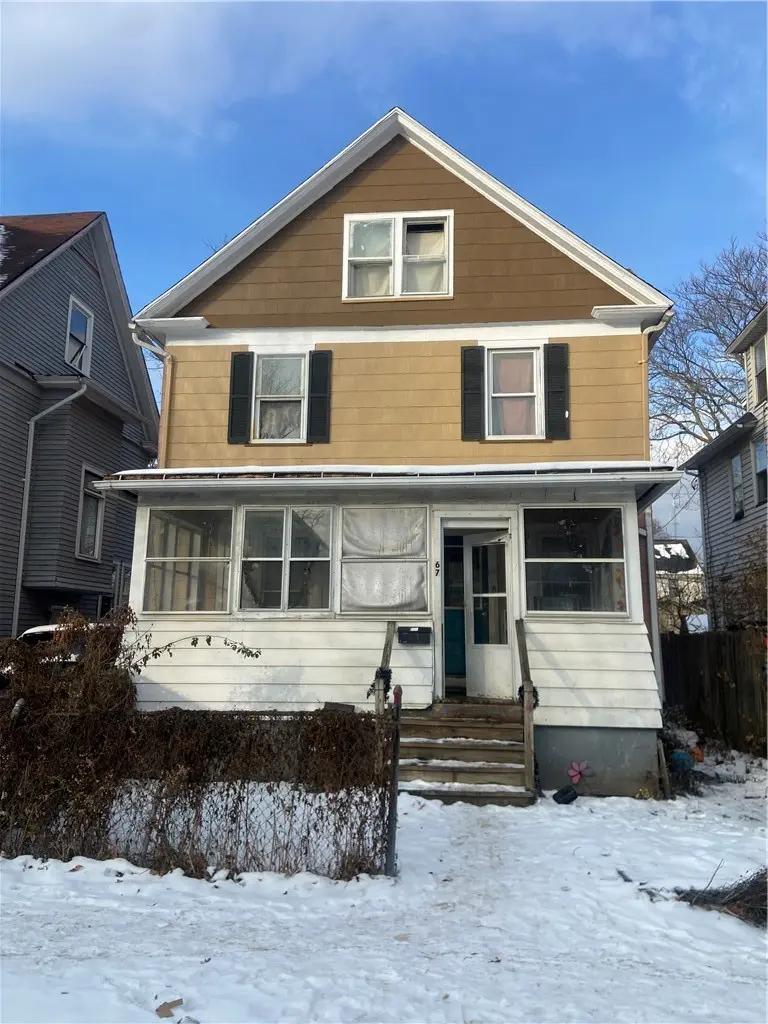
67 Arch St · Rochester, NY
Flood risk 6/10 · Moderate
- FEMA flood zone
- X (unshaded)
- Chance of flooding over 30 yrs
- 0.69%
- Est. flood insurance / yr
- $473 – $860
Fire risk 1/10 · Minimal
- Est. fire insurance / yr
- $691 – $1,283
Heat risk 2/10 · Minimal
- Hot days now (above 95°F)
- 7 days/yr
- Hot days in 30 yrs
- 15 days/yr
Wind risk 1/10 · Minimal
- Chance of severe wind over 30 yrs
- —
Air-quality risk 2/10 · Minimal
- Unhealthy air days now
- 1 days/yr
- Unhealthy air days in 30 yrs
- 2 days/yr
Risk factors via First Street. Map © Google.
Why this score? — see what drove the B+ grade
The composite is a weighted blend of 9 inputs, each scored 0–100. Each bar is that input's sub-score; the figure is the points it added to the 100-point composite (weight × sub-score).
- Cash flow +30.0/30.0
- ARV discount +15.0/15.0
- DSCR +10.0/10.0
- 1% rule +8.1/10.0
- Rent growth +4.5/5.0
- Livability +3.8/5.0
- Condition / age +2.5/5.0
- Schools +1.9/10.0
- Appreciation +0.0/10.0
$140,000
🖨 Deal sheet 📄 Offer letter ✓ Due diligence
Listing remarks MLS
Another Rockin' Rochester investment opportunity! Single family residential, 4 bedrooms, 1 bath.
Key facts
- 4,626 sq ft lot
- Garage
- Built 1903
Neighborhood map
What this means for you Summary
Snapshot
- This is a 3-bed/1.5-bath single-family listed at $140k.
Deal economics
- At list price, monthly cash flow is $589 ($7k/yr) — positive.
- The deal already cash-flows at list — no discount required.
- Meets the 1% rule at list price ($2k rent vs $140k).
- Recommended offer: $127k (9.0% below list) — sets the bar for market timing.
- Cap rate 11.3% vs local median 9.3% in Rochester — meaningfully above typical; check what's discounted (condition, days-on-market, listing class) to confirm the premium yield is real.
Location & tenants
- Location reads 76/100 on livability (#222 in NY, #3,482 nationally) — a middle-class / working-renter tenant base. Strengths: commute A+, cost of living A+, housing A+; Watch: schools D+, crime F, employment F.
- Rochester City School District (urban): math 21% / reading 26% proficiency, ranked #589 of 590 in NY (top 100%) — low school quality limits family demand, transient renter base, plan for 1-2y turnover; 82% free/reduced lunch — lower-income household profile, screen leases tightly.
- Market conditions: Rents rising fast (+7.9%/yr); 199 active listings in the ZIP; 32 comparable units currently listed for rent nearby; rentals at typical pace (median 21d on market — plan ~3-4 weeks tenant-placement turnaround); 1,169 units permitted in Monroe County in 2024 (591 in 5+ unit buildings).
- This rent runs 34% of the median local income ($65k/yr) — at the standard rent-burdened threshold; future hikes will face affordability resistance.
Forward outlook
- Local home prices are declining (-3.0%/yr); year-one equity from $968 of loan paydown is wiped out by about $4k of value loss. Plan a longer hold.
- Monroe County population projected to shrink 6% by 2050 — rents likely to lag national; underwrite the cash flow, not the appreciation.
- At projected returns (-3.0% appreciation + 7.9% rent growth), your $39k cash investment doubles in ~6 years — after that, you're playing with house money.
Negotiation context
- It's been on market 108 days — a 9% lower offer ($127k) is reasonable based on typical stale-listing flexibility.
- 2 sale attempts since 3y ago; this cycle's ask has dropped $30k (18%) from the opening price — seller is motivated, your offer sets the floor, not the list.
- Current owner paid $80k; list at $140k implies a 75% gain — meaningful room to come down on a strong offer.
Risks & watch-outs
- Watch-outs: built in 1903 — expect roof / HVAC / electrical / plumbing capex.
- Climate carrying-cost: major flood risk — expect insurance premiums to compound above CPI over the hold.
Questions for the listing agent
- It's been on market 108 days. Have you received any prior offers? Is the seller open to a 9% concession, seller financing, or rate buy-down credit?
- Built in 1903 — when were the roof, HVAC, electrical panel, plumbing, and water heater last replaced?
- Why hasn't it sold? Are there any deal-killer items the seller is aware of (foundation, flood, title, zoning, code violations)?
- Is there a deadline driving the sale (1031 exchange, divorce, estate, relocation)? That informs how much negotiation room exists.
- Schools are D-rated, which usually means shorter tenancies and higher turnover. Who's the typical renter profile here, and what's been the actual vacancy rate?
- Crime grade is F in this area — have there been break-ins, vandalism, or insurance claims at this property in the last 3 years? What carrier currently insures it and at what premium?
- What's the average days-on-market for RENTAL listings here right now (not sales)? A rising rental-DOM trend means longer vacancies and softer asking-rent achievability than the comps imply.
- What's the recent tenant-quality profile in this submarket — average credit score on applications, eviction rate, late-payment / NSF rate, and stable-employment percentage? A property-management company in the area should have these aggregated.
- How much new for-sale + rental construction is in the pipeline within 1–3 miles? Heavy new supply typically softens prices + rents 12–24 months out; constrained supply supports both.
Investment metrics
- 1% rule
- 1.31% ✓
- Cap rate
- 11.34%
- Cash-on-cash
- 18.02%
- DSCR
- 1.80
- GRM
- 6.3
CMA / ARV
- ARV (median comp)
- $183,182
- List price
- $140,000
- Delta
- -23.57%
- Verdict
- UNDERPRICED
- Comps
- 20 within 1.0 mi
Show comp detail 12 sales within ~0.75 mi
| Address | Dist | Beds/Ba | Sqft | Sold | Price | $/sf | Match |
|---|---|---|---|---|---|---|---|
| 322 Grand Ave | 0.29mi | 4/2.0 (+1) | 1,555 (+1%) | 2mo | $139,200 | $90 | 76 |
| 73 Herkimer St | 0.21mi | 3/1.0 | 1,450 (-6%) | 4mo | $140,000 | $97 | 75 |
| 110 Arch St | 0.07mi | 4/2.0 (+1) | 1,417 (-8%) | 2mo | $200,000 | $141 | 74 |
| 106 Ohio St | 0.39mi | 3/2.0 | 1,600 (+4%) | 2mo | $218,000 | $136 | 72 |
| 363 Melville St | 0.35mi | 4/1.0 (+1) | 1,500 (-3%) | 1mo | $175,000 | $117 | 71 |
| 275 Parsells Ave | 0.30mi | 3/2.0 | 1,662 (+8%) | 3mo | $207,000 | $125 | 68 |
| 460 Melville St | 0.42mi | 3/1.0 | 1,426 (-7%) | 3mo | $164,900 | $116 | 64 |
| 120 Brookfield Rd | 0.69mi | 3/1.5 | 1,568 (+2%) | 3mo | $340,000 | $217 | 62 |
| 380 Rosewood Ter | 0.52mi | 3/1.5 | 1,382 (-10%) | 3mo | $155,000 | $112 | 56 |
| 699 N Goodman St | 0.73mi | 4/2.0 (+1) | 1,548 (+0%) | 3mo | $110,000 | $71 | 56 |
| 34 Woodrow Ave | 0.75mi | 3/1.5 | 1,406 (-9%) | 1mo | $275,000 | $196 | 50 |
| 54 Rosewood | 0.51mi | 4/1.5 (+1) | 1,366 (-11%) | 3mo | $93,000 | $68 | 50 |
Match score weights: distance 35% · size 25% · config 20% · recency 20%. Top-matched comps best support the ARV.
Projected returns pro-forma
-3.0% appreciation · 7.89% rent growth · sell at horizon
- IRR
- 14.6%
- Equity multiple
- 1.62×
- Total profit
- $24,281
- Equity at exit
- $20,874
- IRR
- 26.6%
- Equity multiple
- 3.87×
- Total profit
- $112,437
- Equity at exit
- $12,105
Cash invested: $39,200 (down + closing). Projections, not guarantees.
Landlord ↔ Tenant lean methodology
- Overall (STATE)
- 15 Strongly Tenant-Friendly
- State New York
- 15 Strongly Tenant-Friendly · D+10
- County
- — inherits STATE
- City
- — inherits STATE
ZIP-level market 14609
- Home prices YoY
- -30.4%
- Rents YoY
- 7.9%
- Active inventory
- 199
- Price-to-rent
- 6.3×
Monthly cashflow live
- Estimated rent
- $1,840 high interval (Pro) →
- Mortgage (P&I)
- −$734
- Tax from tax record
- −$73 /mo · $872/yr
- Insurance
- −$58
- HOA
- −$0
- Vacancy / Maint / Mgmt
- −$387
- Net cashflow
- $589
Break-even live
UW: 25.0% down · 7.5% · 30yr · 1.5% tax · 5.0% vac · 8.0% maint · 8.0% mgmt
Financing live
Cash to close
- Down payment
- $35,000
- Closing costs
- $4,200
- Reserves months
- —
- Total cash needed
- —
Loan-product check · same deal, 3 products live
Conventional
25% down · 7.5% · 30yr
- Down + closing
- —
- Monthly P&I
- —
- Monthly cashflow
- —
- DSCR
- —
- Eligible?
- —
Personal DTI + credit; lowest rate.
DSCR
20% down · 8.5% · 30yr
- Down + closing
- —
- Monthly P&I
- —
- Monthly cashflow
- —
- DSCR
- —
- Eligible?
- —
No personal income docs; deal must DSCR.
Hard money
10% down · 12.0% · 12mo
- Down + closing
- —
- Monthly P&I
- —
- Monthly cashflow
- —
- DSCR
- —
- Eligible?
- —
Short-term bridge; refi at stabilization.
Rent comps 32 comps
| Address | Beds | Baths | Sqft | Rent | $/sqft | DOM | Units | Dist |
|---|---|---|---|---|---|---|---|---|
| 459-461 Parsells Ave Rochester, NY | 2.0 | 1.0 | 1053 | $1,450 | $1.38 | 23d | 1 | 0.28mi |
| 108 Bowman St Unit 1 Rochester, NY | 3.0 | 1.0 | 1200 | $1,600 | $1.33 | 43d | 1 | 0.29mi |
| 195 Parsells Ave Rochester, NY | 4.0 | 1.0 | 1413 | $1,265 | $0.90 | 3d | 1 | 0.34mi |
| 126 Parsells Ave Rochester, NY | 3.0 | 1.0 | 1574 | $1,800 | $1.14 | 21d | 1 | 0.43mi |
| 126 Parsells Ave Rochester, NY | 3.0 | 1.0 | 1574 | $1,800 | $1.14 | 43d | 1 | 0.43mi |
| 1159 Culver Rd Unit A2 UP Rochester, NY | 3.0 | 1.0 | 1313 | $1,500 | $1.14 | 43d | 1 | 0.44mi |
| 420 Rosewood Ter Rochester, NY | 3.0 | 1.0 | 1246 | $1,300 | $1.04 | 3d | 1 | 0.53mi |
| 1079 Garson Ave Rochester, NY | 3.0 | 1.5 | 1273 | $2,100 | $1.65 | 10d | 1 | 0.59mi |
| 322 Wisconsin St Rochester, NY | 2.0 | 1.0 | 1100 | $1,200 | $1.09 | 21d | 1 | 0.64mi |
| 933 University Ave Rochester, NY | 1.0–2.0 | 1.0–2.0 | 1295 | $3,815 | $2.94 | 2d | 12 | 0.74mi |
| 733 University Ave #3 Rochester, NY | 3.0 | 1.5 | 1400 | $1,850 | $1.32 | 43d | 1 | 0.86mi |
| 52 Frances St Rochester, NY | 4.0 | 1.0 | 1256 | $1,595 | $1.27 | 43d | 1 | 0.89mi |
| 147 5th St Rochester, NY | 4.0 | 1.0 | 1289 | $1,950 | $1.51 | 21d | 1 | 0.91mi |
| 21 Rundel Park Unit 2 Rochester, NY | 2.0 | 1.0 | 1250 | $2,099 | $1.68 | 19d | 1 | 0.95mi |
| 15 Vick Park B Unit A Rochester, NY | 2.0 | 1.5 | 1616 | $2,350 | $1.45 | 23d | 1 | 1.02mi |
| 1600 East Ave Rochester, NY | 3.0 | 1.0–2.0 | 944 | $2,875 | $3.04 | 2d | 1 | 1.06mi |
| 176 Merwin Ave Rochester, NY | 4.0 | 1.5 | 1750 | $2,200 | $1.26 | 43d | 1 | 1.09mi |
| 47 Priscilla St Rochester, NY | 4.0 | 1.5 | 1250 | $1,900 | $1.52 | 21d | 1 | 1.10mi |
| 36 Morningside Park Rochester, NY | 4.0 | 1.0 | 1446 | $2,400 | $1.66 | 3d | 1 | 1.14mi |
| 1 Champeney Ter Rochester, NY | 3.0 | 1.0 | 1936 | $1,650 | $0.85 | 14d | 1 | 1.16mi |
| 214 Culver Rd Apt 2 Rochester, NY | 3.0 | 1.0 | 1700 | $2,400 | $1.41 | 14d | 1 | 1.16mi |
| 256 Oxford St Unit 1 Rochester, NY | 3.0 | 1.0 | 2050 | $3,000 | $1.46 | 14d | 1 | 1.18mi |
| 260 Oxford St Unit UP Rochester, NY | 2.0 | 1.0 | 1850 | $2,600 | $1.41 | 43d | 1 | 1.19mi |
| 395 Alexander St Unit UN12 Rochester, NY | 2.0 | 1.5 | 1226 | $2,200 | $1.79 | 14d | 1 | 1.23mi |
| 474 East Ave Rochester, NY | 1.0–2.0 | 1.0–2.0 | 1125 | $2,800 | $2.49 | 23d | 1 | 1.24mi |
| 21 Arnold Park Rochester, NY | 2.0 | 1.0 | 750 | $1,425 | $1.90 | 2d | 15 | 1.32mi |
| 294 Barrington St Rochester, NY | 2.0 | 1.5 | 1131 | $1,750 | $1.55 | 43d | 1 | 1.35mi |
| 326 Northland Ave Rochester, NY | 3.0 | 1.0 | 1168 | $1,500 | $1.28 | 2d | 1 | 1.40mi |
| 209 S Goodman St Rochester, NY | 2.0 | 2.0 | 1500 | $1,700 | $1.13 | 43d | 1 | 1.40mi |
| 27 Hoyt Pl Rochester, NY | 2.0 | 2.0 | 1354 | $2,995 | $2.21 | 2d | 1 | 1.43mi |
| 36 Charwood Cir Irondequoit, NY | 2.0 | 1.0–1.5 | 1000 | $1,675 | $1.68 | 43d | 3 | 1.48mi |
| 36 Charwood Cir Irondequoit, NY | 1.0–2.0 | 1.0–1.5 | 930 | $2,005 | $2.16 | 2d | 9 | 1.48mi |
Listing history 26 events
-
2026-06-18days on market $140,000 Active 108 DOM
-
2026-06-17days on market $140,000 Active 107 DOM
-
2026-06-16days on market $140,000 Active 106 DOM
-
2026-06-15days on market $140,000 Active 105 DOM
-
2026-06-13days on market $140,000 Active 103 DOM
-
2026-06-13days on market $140,000 Active 102 DOM
-
2026-06-10days on market $140,000 Active 100 DOM
-
2026-06-09days on market $140,000 Active 99 DOM
-
2026-06-09pricedays on market $140,000 Active 98 DOM
-
2026-06-07days on market $150,000 Active 97 DOM
-
2026-06-05days on market $150,000 Active 94 DOM
-
2026-06-03days on market $150,000 Active 93 DOM
-
2026-06-03days on market $150,000 Active 92 DOM
-
2026-06-01days on market $150,000 Active 91 DOM
-
2026-05-31days on market $150,000 Active 90 DOM
-
2026-05-06price $150,000 97-char remark
Show marketing remark (97 chars)
Another Rockin' Rochester investment opportunity! Single family residential, 4 bedrooms, 1 bath.
-
2026-04-08price $160,000 97-char remark
Show marketing remark (97 chars)
Another Rockin' Rochester investment opportunity! Single family residential, 4 bedrooms, 1 bath.
-
2026-03-02$170,000 Active 97-char remark
Show marketing remark (97 chars)
Another Rockin' Rochester investment opportunity! Single family residential, 4 bedrooms, 1 bath.
-
2023-07-21soldstatus $80,000
-
2023-07-10soldstatus $53,000
-
2023-07-07soldstatus $53,000 Closed Sale or Rented 40-char remark
Show marketing remark (40 chars)
Rehab opportunity sold as-is, cash only.
-
2023-06-12status Pending Sale 40-char remark
Show marketing remark (40 chars)
Rehab opportunity sold as-is, cash only.
-
2023-04-25historical Continue to Show- Under Contract 40-char remark
Show marketing remark (40 chars)
Rehab opportunity sold as-is, cash only.
-
2023-04-13$55,000 Active 40-char remark
Show marketing remark (40 chars)
Rehab opportunity sold as-is, cash only.
-
2021-07-02soldstatus $55,000
-
1994-12-28soldstatus $38,000
ⓘ Source: listings_history table (triggers on properties + properties_extension) + one-shot
backfill from property_details.listing_events for pre-trigger history.
Tax reassessment forecast NY · Partial reset (capped growth)
- Current annual tax
- $872 · $73/mo
- Projected year-2 tax
- $1,619 · $135/mo
- Expected delta
- +$747/yr (+$62/mo · 85.6%)
ⓘ Screening estimate from a state-policy table — verify with the county assessor before closing.
Climate risk First Street
- Flood 6/10 Major FEMA zone X (unshaded) · 69% chance over 30 yrs
- Wildfire 1/10 Low
- Heat 2/10 Low 7 d/yr ≥95°F today · 15 d/yr by 30 yrs out
- Wind 1/10 Low
- Air quality 2/10 Low 1 unhealthy d/yr today · 2 by 30 yrs out
Nearby sold comps map
Loading sold comps map…
Walkable amenities ~0.75 mi
Loading nearby amenities…
Taxation est. · year 1
- Rental income
- $22,086
- − Mortgage interest
- −$7,842
- − Property taxes
- −$872
- − Insurance
- −$700
- − Repairs & maintenance
- −$1,767
- − Management
- −$1,767
- − Depreciation
- −$4,073
- Taxable income
- $5,065
- Est. tax owed @ 24.0%
- −$1,216
- After-tax cash flow
- $5,850/yr
For passive investors: Depreciation is non-cash, so a rental often shows a tax loss while cash-flowing — sheltering income. Rental losses are passive: they offset passive income freely, and up to $25,000/yr can offset ordinary (W-2) income if you actively participate and your MAGI is under $100k (phasing out to $0 by $150k); unused losses carry forward. On sale, claimed depreciation is recaptured at up to 25%, and gains may owe capital-gains tax (a 1031 exchange can defer both). Figures are a year-1 estimate at your 24.0% rate — not tax advice; consult a CPA.
Schools (NCES district)
- District
- Rochester City School District
- NCES district ID
- 3624750
- Math proficiency
- 21% ▬ 0.00%
- Reading proficiency
- 26% ▲ 4.00%
- Median HH income
- $30,923
- Composite
- 18.98/100
- National rank
- #8850
- State rank
- #589 of 590 in NY
Livability — Rochester
- Score
- 76/100
- State rank
- #222
- US rank
- #3482
Category grades
Schools grade is shown separately in the Schools card above.
Census & demographics
- Census place
- Rochester, NY
- County
- Monroe County · 674,131 people
- City population
- 432,803
- Metro
- Rochester, NY
- Population (ZIP)
- 40,274
- Household income
- $64,603
- Rent vs Own
- Severe rent burden
- 2183.0
Population outlook (Monroe County) Hauer SSP2
- Today (2025)
- 759,460 people
- By 2030
- 757,154 · -0.3%
- By 2040
- 740,644 · -2.5%
- By 2050
- 714,443 · -5.9%
- By 2075
- 645,883 · -15.0%
- By 2100
- 547,084 · -28.0%
Race, ethnicity, and origin ACS 2023
- Neighborhood character
- Diverse neighborhood (Simpson 0.69)
- Race & ethnicity
- White 44% Black 28% Hispanic / Latino 20% Two or more races 10% Asian 2%
- Hispanic origin (detail)
- Puerto Rican 15% Cuban 1% Dominican 1%
- Common ancestry
- Romanian 4% Lithuanian 2% Iranian 1%
- Foreign-born
- 8% · Canada
- Languages at home
- 81% English-only · Spanish 14% Russian/Polish/Slavic 2% Other Indo-European 1%
Political lean MEDSL · Monroe
- 2024 margin
- D (+19.1) · D 59.5% · R 40.5%
- 2008→2024 swing
- +1.4pp toward D · 2008: 17.7pp · 2024: 19.1pp
- All cycles
- 2024: D+19.1 2020: D+21.0 2016: D+14.1 2012: D+17.4 2008: D+17.7
Not yet ingested
- Civics
- —
Market trends
- HPI YoY
- ▼ -143.57%
- Current HPI
- 328.7053
- Rent YoY
- ▲ 7.89%
- Metro
- Rochester, NY
- State GDP YoY
- ▲ 2.60%
- F500 in state
- 92
Industry mix (Fortune 500 HQ in NY)
| Industry | F500 HQs | Revenue |
|---|---|---|
| Financial Services | 10 | $950B |
|
||
| Consumer Goods | 9 | $162B |
|
||
| Insurance | 4 | $225B |
|
||
| Telecommunications | 2 | $144B |
|
||
| Pharmaceuticals | 2 | $112B |
|
||
| Media / Entertainment | 2 | $69B |
|
||
Price history
+294.7% since first listed11 events — show timeline
- 2026-05-06 Price Changed $150,000 UNYREIS
- 2026-04-08 Price Changed $160,000 UNYREIS
- 2026-03-02 Listed $170,000 UNYREIS
- 2023-07-21 Sold (Public Records) $80,000 Public Records
- 2023-07-10 Sold (Public Records) $53,000 Public Records
- 2023-07-07 Sold (MLS) $53,000 UNYREIS
- 2023-06-12 Pending — UNYREIS
- 2023-04-25 Contingent — UNYREIS
- 2023-04-13 Listed $55,000 UNYREIS
- 2021-07-02 Sold (Public Records) $55,000 Public Records
- 1994-12-28 Sold (Public Records) $38,000 Public Records
Property tax history
+4.4%/yrLatest (2025): $872 · +0.0% YoY. Source: county tax records.
Cash-flow waterfall
monthlySold comps — $/sqft
last 12 mo · ≤1 miLoading sold comps…