10979 65th Ter E · Ellenton, FL
Flood risk No data
- FEMA flood zone
- —
- Chance of flooding over 30 yrs
- —
- Est. flood insurance / yr
- —
Fire risk No data
- Est. fire insurance / yr
- —
Heat risk No data
- Hot days now (above threshold)
- —
- Hot days in 30 yrs
- —
Wind risk No data
- Chance of severe wind over 30 yrs
- —
Air-quality risk No data
- Unhealthy air days now
- —
- Unhealthy air days in 30 yrs
- —
Risk factors via First Street. Map © Google.
Why this score? — see what drove the C- grade
The composite is a weighted blend of 9 inputs, each scored 0–100. Each bar is that input's sub-score; the figure is the points it added to the 100-point composite (weight × sub-score).
- Cash flow +18.2/30.0
- ARV discount +8.9/15.0
- DSCR +5.7/10.0
- 1% rule +4.9/10.0
- Schools +4.4/10.0
- Condition / age +4.0/5.0
- Livability +3.8/5.0
- Rent growth +1.8/5.0
- Appreciation +0.0/10.0
$242,350
🖨 Deal sheet 📄 Offer letter ✓ Due diligence
Listing remarks
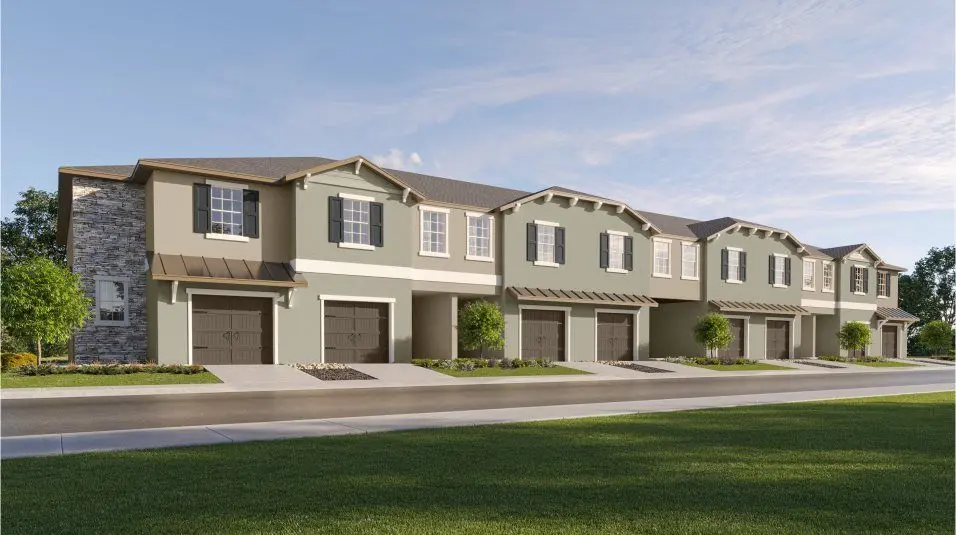
Luxury is in the details of this charming two-story townhome. The first floor enjoys an airy design among the spacious living room, kitchen and dining room, opening to the covered patio for serene outdoor moments. Upstairs, an adaptable central loft leads to two secondary bedrooms and the tranquil owner's suite. The owner's suite is in a privately situated corner, showcasing a full-sized bathroom and large walk-in closet.
Key facts
- Central loft
- Covered patio
- Full sized bathroom
Tags
Property features AI
Finance
- Financial info: List price $245,500
Exterior
- Parking: 1 garage space (1 total parking space)
- Home design: Single-family spec home (St. Thomas II plan); Active listing
- Exterior features: Address: 10979 65th Ter E, Palmetto, FL 34221
Interior
- Bedrooms: 3 bedrooms
- Bathrooms: 2 full bathrooms and 1 half bathroom (2.5 total)
- Interior features: Spec new-construction home (St. Thomas II plan); Living area approximately 1666
Neighborhood map
What this means for you Summary
Snapshot
- This is a 3-bed/2.5-bath townhouse listed at $242k. Condition is rated good.
Deal economics
- At list price, monthly cash flow is $217 ($3k/yr) — positive.
- The deal already cash-flows at list — no discount required.
- To meet the 1% rule (rent ≥ 1% of price), the offer needs to be $239k (1.2% below list).
- Recommended offer: $239k (1.5% below list) — sets the bar for market timing.
- Cap rate 7.4% vs local median 4.5% in Ellenton — top-decile yield for the area; either an underpriced asset or a hidden risk that comps aren't pricing in. Stress-test before assuming the spread holds.
Location & tenants
- Location reads 76/100 on livability (#232 in FL, #3,666 nationally) — a middle-class / working-renter tenant base. Strengths: cost of living A+, housing A+, health & safety A+; Watch: schools D+, amenities F, commute F.
- Manatee (suburban): math 54% / reading 50% proficiency, ranked #26 of 73 in FL (top 36%) — acceptable for families but not a draw, mixed tenant base, ~2y average lease.
- Market conditions: Rents soft (-3.0%/yr); 1160 active listings in the ZIP; 33 comparable units currently listed for rent nearby; rentals at typical pace (median 21d on market — plan ~3-4 weeks tenant-placement turnaround); solid renter incomes; 7,472 units permitted in Manatee County in 2024 (1,782 in 5+ unit buildings).
- This rent runs 37% of the median local income ($78k/yr) — at the standard rent-burdened threshold; future hikes will face affordability resistance.
Forward outlook
- Local home prices are declining (-3.0%/yr); year-one equity from $2k of loan paydown is wiped out by about $7k of value loss. Plan a longer hold.
- Manatee County population projected at +43% by 2050 — long-run rental-demand tailwind backs the buy-and-hold thesis.
Negotiation context
- It's been on market 18 days — a 2% lower offer ($239k) is reasonable based on typical stale-listing flexibility.
Questions for the listing agent
- Is there a deadline driving the sale (1031 exchange, divorce, estate, relocation)? That informs how much negotiation room exists.
- Schools are D-rated, which usually means shorter tenancies and higher turnover. Who's the typical renter profile here, and what's been the actual vacancy rate?
- What's the average days-on-market for RENTAL listings here right now (not sales)? A rising rental-DOM trend means longer vacancies and softer asking-rent achievability than the comps imply.
- What's the recent tenant-quality profile in this submarket — average credit score on applications, eviction rate, late-payment / NSF rate, and stable-employment percentage? A property-management company in the area should have these aggregated.
- How much new for-sale + rental construction is in the pipeline within 1–3 miles? Heavy new supply typically softens prices + rents 12–24 months out; constrained supply supports both.
Investment metrics
- 1% rule
- 0.99% ✗
- Cap rate
- 7.37%
- Cash-on-cash
- 3.84%
- DSCR
- 1.17
- GRM
- 8.4
CMA / ARV
- ARV (on-the-fly)
- $249,900
- Comps found
- 12
Show comp detail 12 sales within ~0.75 mi
| Address | Dist | Beds/Ba | Sqft | Sold | Price | $/sf | Match |
|---|---|---|---|---|---|---|---|
| 10915 65th Ter E | 0.06mi | 3/2.5 | 1,666 (0%) | 2mo | $249,999 | $150 | 96 |
| 10948 65th Ter E | 0.05mi | 3/2.5 | 1,666 (0%) | 5mo | $254,900 | $153 | 94 |
| 10964 65th Ter E | 0.05mi | 3/2.5 | 1,708 (+2%) | 4mo | $236,000 | $138 | 90 |
| 11084 E 65th Ter | 0.10mi | 3/2.5 | 1,666 (0%) | 10mo | $249,900 | $150 | 87 |
| 11080 E 65th Ter | 0.10mi | 3/2.5 | 1,666 (0%) | 10mo | $241,000 | $145 | 87 |
| 11075 E 65th Ter | 0.08mi | 3/2.5 | 1,666 (0%) | 11mo | $249,900 | $150 | 87 |
| 11021 65th Ter E | 0.03mi | 3/2.5 | 1,787 (+7%) | 7mo | $291,950 | $163 | 80 |
| 11256 65th Ter E | 0.18mi | 3/2.0 | 1,708 (+2%) | 7mo | $252,000 | $148 | 79 |
| 11068 65th Ter E | 0.09mi | 3/2.5 | 1,787 (+7%) | 9mo | $248,900 | $139 | 76 |
| 11071 E 65th Ter | 0.07mi | 3/2.5 | 1,787 (+7%) | 10mo | $252,150 | $141 | 76 |
| 11088 65th Ter E | 0.11mi | 3/2.5 | 1,787 (+7%) | 10mo | $275,500 | $154 | 75 |
| 11083 E 65th Ter | 0.09mi | 3/2.5 | 1,787 (+7%) | 11mo | $270,150 | $151 | 74 |
Match score weights: distance 35% · size 25% · config 20% · recency 20%. Top-matched comps best support the ARV.
Projected returns pro-forma
-3.0% appreciation · 0.0% rent growth · sell at horizon
- IRR
- -13.7%
- Equity multiple
- 0.52×
- Total profit
- $-32,429
- Equity at exit
- $36,135
- IRR
- -10.5%
- Equity multiple
- 0.45×
- Total profit
- $-37,414
- Equity at exit
- $20,954
Cash invested: $67,858 (down + closing). Projections, not guarantees.
Landlord ↔ Tenant lean methodology
- Overall (STATE)
- 87 Strongly Landlord-Friendly
- State Florida
- 87 Strongly Landlord-Friendly · R+3
- County
- — inherits STATE
- City
- — inherits STATE
ZIP-level market 34221
- Rents YoY
- -3.0%
- Active inventory
- 1160
- Price-to-rent
- 8.4×
Monthly cashflow live
- Estimated rent
- $2,395 high interval (Pro) →
- Mortgage (P&I)
- −$1,271
- Tax est. 1.5%
- −$303 /mo · $3,635/yr
- Insurance
- −$101
- HOA
- −$0
- Vacancy / Maint / Mgmt
- −$503
- Net cashflow
- $217
Break-even live
UW: 25.0% down · 7.5% · 30yr · 1.5% tax · 5.0% vac · 8.0% maint · 8.0% mgmt
Financing live
Cash to close
- Down payment
- $60,588
- Closing costs
- $7,270
- Reserves months
- —
- Total cash needed
- —
Loan-product check · same deal, 3 products live
Conventional
25% down · 7.5% · 30yr
- Down + closing
- —
- Monthly P&I
- —
- Monthly cashflow
- —
- DSCR
- —
- Eligible?
- —
Personal DTI + credit; lowest rate.
DSCR
20% down · 8.5% · 30yr
- Down + closing
- —
- Monthly P&I
- —
- Monthly cashflow
- —
- DSCR
- —
- Eligible?
- —
No personal income docs; deal must DSCR.
Hard money
10% down · 12.0% · 12mo
- Down + closing
- —
- Monthly P&I
- —
- Monthly cashflow
- —
- DSCR
- —
- Eligible?
- —
Short-term bridge; refi at stabilization.
Rent comps 33 comps
| Address | Beds | Baths | Sqft | Rent | $/sqft | DOM | Units | Dist |
|---|---|---|---|---|---|---|---|---|
| 11331 65th Ter E Palmetto, FL | 3.0 | 2.5 | 1666 | $2,090 | $1.25 | 11d | 1 | 0.23mi |
| 11332 65th Ter E Palmetto, FL | 3.0 | 2.5 | 1666 | $2,300 | $1.38 | 23d | 1 | 0.23mi |
| 6345 Willowside St Palmetto, FL | 3.0 | 2.5 | 1407 | $2,200 | $1.56 | 23d | 1 | 0.25mi |
| 6354 Fairmont Ln Palmetto, FL | 2.0 | 2.5 | 1123 | $2,000 | $1.78 | 23d | 1 | 0.27mi |
| 6334 Fairmont Ln Palmetto, FL | 2.0 | 2.5 | 1235 | $1,795 | $1.45 | 3d | 1 | 0.27mi |
| 6256 Fairmont Ln Palmetto, FL | 2.0 | 2.5 | 1216 | $1,845 | $1.52 | 14d | 1 | 0.29mi |
| 5912 Laurelcrest Gln Palmetto, FL | 3.0 | 2.5 | 1900 | $2,750 | $1.45 | 23d | 1 | 0.30mi |
| 6249 Fairmont Ln Palmetto, FL | 2.0 | 2.5 | 1200 | $1,890 | $1.57 | 14d | 1 | 0.32mi |
| 11720 Glenside Ter Palmetto, FL | 3.0 | 2.5 | 1373 | $2,200 | $1.60 | 23d | 1 | 0.54mi |
| 6210 Terra Lago Cir Palmetto, FL | 1.0–3.0 | 1.0–2.0 | 1015 | $2,405 | $2.37 | 3d | 50 | 0.55mi |
| 11779 Glenside Ter Palmetto, FL | 3.0 | 2.5 | 1394 | $2,200 | $1.58 | 23d | 1 | 0.58mi |
| 11787 Glenside Ter Palmetto, FL | 3.0 | 2.5 | 1373 | $2,100 | $1.53 | 21d | 1 | 0.59mi |
| 6318 Whetstone Ct Palmetto, FL | 2.0 | 2.5 | 1128 | $1,950 | $1.73 | 23d | 1 | 0.60mi |
| 11820 Glenside Ter Palmetto, FL | 3.0 | 2.5 | 1382 | $2,100 | $1.52 | 16d | 1 | 0.64mi |
| 11757 71st Ave E Palmetto, FL | 3.0 | 2.5 | 2184 | $2,699 | $1.24 | 16d | 1 | 0.64mi |
| 6011 Whetstone Ct Palmetto, FL | 3.0 | 2.5 | 1382 | $2,000 | $1.45 | 3d | 1 | 0.68mi |
| 5331 Rushmere Ct Palmetto, FL | 2.0 | 2.5 | 1582 | $2,600 | $1.64 | 23d | 1 | 0.68mi |
| 11946 Glenside Ter Palmetto, FL | 3.0 | 2.5 | 1570 | $1,995 | $1.27 | 16d | 1 | 0.70mi |
| 11946 Glenside Ter Palmetto, FL | 3.0 | 2.5 | 1570 | $1,995 | $1.27 | 11d | 1 | 0.70mi |
| 5924 Whetstone Ct Palmetto, FL | 3.0 | 2.5 | 1373 | $2,000 | $1.46 | 20d | 1 | 0.72mi |
| 5871 Bungalow Grove Ct Palmetto, FL | 3.0 | 2.0 | 1492 | $2,185 | $1.46 | 21d | 1 | 0.72mi |
| 5511 Bungalow Grove Ct Palmetto, FL | 4.0 | 2.0 | 1633 | $2,900 | $1.78 | 23d | 1 | 0.75mi |
| 7518 117th Ln E Palmetto, FL | 3.0 | 3.0 | 2156 | $3,100 | $1.44 | 23d | 1 | 0.79mi |
| 10120 Abrazo DR Palmetto, FL | 1.0–3.0 | 1.0–2.5 | 1122 | $2,675 | $2.38 | 2d | 24 | 1.00mi |
| 10504 Spring Tide Way Palmetto, FL | 2.0 | 2.0 | 1533 | $2,500 | $1.63 | 3d | 1 | 1.06mi |
| 4816 Heinman Cv Palmetto, FL | 3.0 | 2.0 | 1920 | $3,300 | $1.72 | 11d | 1 | 1.12mi |
| 9650 52nd Ave E Palmetto, FL | 1.0–3.0 | 1.0–2.0 | 1050 | $2,342 | $2.23 | 23d | 99 | 1.18mi |
| 11612 Armada Way Parrish, FL | 4.0 | 2.0 | 2112 | $3,400 | $1.61 | 20d | 1 | 1.28mi |
| 7562 Sea Oak Ct Palmetto, FL | 3.0 | 2.0 | 1433 | $2,400 | $1.67 | 21d | 1 | 1.30mi |
| 7566 Sea Oak Ct Palmetto, FL | 3.0 | 2.5 | 1807 | $2,700 | $1.49 | 21d | 1 | 1.30mi |
| 9262 Gulf Haven Dr Palmetto, FL | 3.0 | 2.5 | 2043 | $2,750 | $1.35 | 14d | 1 | 1.31mi |
| 11628 Moonsail Dr Parrish, FL | 3.0 | 2.0 | 2144 | $3,500 | $1.63 | 21d | 1 | 1.44mi |
| 7122 87th Ln E Palmetto, FL | 4.0 | 2.0 | 1593 | $2,750 | $1.73 | 23d | 1 | 1.48mi |
Listing history 2 events
-
2026-06-01days on market $242,350 Active 18 DOM
-
2026-05-31pricedays on market $242,350 Active 17 DOM
ⓘ Source: listings_history table (triggers on properties + properties_extension) + one-shot
backfill from property_details.listing_events for pre-trigger history.
Nearby sold comps map
Loading sold comps map…
Walkable amenities ~0.75 mi
Loading nearby amenities…
Taxation est. · year 1
- Rental income
- $28,737
- − Mortgage interest
- −$13,575
- − Property taxes
- −$3,635
- − Insurance
- −$1,212
- − Repairs & maintenance
- −$2,299
- − Management
- −$2,299
- − Depreciation
- −$7,050
- Taxable loss
- −$1,333
- Est. tax savings @ 24.0%
- +$320
- After-tax cash flow
- $2,925/yr
For passive investors: Depreciation is non-cash, so a rental often shows a tax loss while cash-flowing — sheltering income. Rental losses are passive: they offset passive income freely, and up to $25,000/yr can offset ordinary (W-2) income if you actively participate and your MAGI is under $100k (phasing out to $0 by $150k); unused losses carry forward. On sale, claimed depreciation is recaptured at up to 25%, and gains may owe capital-gains tax (a 1031 exchange can defer both). Figures are a year-1 estimate at your 24.0% rate — not tax advice; consult a CPA.
Condition & rehab AI · 12 photos
This charming two-story townhome is in excellent condition with minimal repairs needed. It offers a good return on investment with updates that can significantly increase its resale and rental value.
Value-add opportunities
- Both Painting the exterior and interior walls — Enhances curb appeal and interior aesthetics
- Both Landscaping improvements — Enhances curb appeal and adds value
- Both New flooring in bathrooms — Improves aesthetics and functionality
- Both New kitchen appliances — Modernizes the kitchen and adds value
Renovation cost estimate screening
Value-add ROI direction
- Both Painting the exterior and interior walls — Enhances curb appeal and interior aesthetics ↑
- Both Landscaping improvements — Enhances curb appeal and adds value ↑
- Both New flooring in bathrooms — Improves aesthetics and functionality ↑
- Both New kitchen appliances — Modernizes the kitchen and adds value ↑
ⓘ Cost ranges are severity-bucket heuristics (US national rule-of-thumb). Get contractor quotes + a written scope before underwriting a rehab budget.
Schools (NCES district)
- District
- Manatee
- NCES district ID
- 1201230
- Math proficiency
- 54% ▼ -6.00%
- Reading proficiency
- 50% ▼ -2.00%
- Median HH income
- $49,607
- Composite
- 44.43/100
- National rank
- #2806
- State rank
- #26 of 73 in FL
Livability — Ellenton
- Score
- 76/100
- State rank
- #232
- US rank
- #3666
Category grades
Schools grade is shown separately in the Schools card above.
Census & demographics
- County
- Manatee County · 416,364 people
- City population
- 14,819
- Metro
- North Port-Sarasota-Bradenton, FL
- Population (ZIP)
- 56,208
- Household income
- $77,712
- Rent vs Own
- Severe rent burden
- 1193.0
Population outlook (Manatee County) Hauer SSP2
- Today (2025)
- 447,342 people
- By 2030
- 488,911 · +9.3%
- By 2040
- 567,934 · +27.0%
- By 2050
- 637,995 · +42.6%
- By 2075
- 781,970 · +74.8%
- By 2100
- 848,272 · +89.6%
Race, ethnicity, and origin ACS 2023
- Neighborhood character
- Diverse neighborhood (Simpson 0.58)
- Race & ethnicity
- White 59% Hispanic / Latino 22% Black 14% Two or more races 11%
- Hispanic origin (detail)
- Mexican 14% Puerto Rican 3%
- Common ancestry
- Romanian 2% Lithuanian 2% Italian 2%
- Foreign-born
- 10% · Canada, Dominican Republic, Jamaica
- Languages at home
- 81% English-only · Spanish 16% Other Indo-European 1%
Political lean MEDSL · Manatee
- 2024 margin
- Strong R (+23.5) · D 37.9% · R 61.4%
- 2008→2024 swing
- -16.5pp toward R · 2008: -7.0pp · 2024: -23.5pp
- All cycles
- 2024: R+23.5 2020: R+16.1 2016: R+17.1 2012: R+12.5 2008: R+7.0
Not yet ingested
- Civics
- —
Market trends
- HPI YoY
- ▼ -383.53%
- Current HPI
- 302.1458
- Rent YoY
- ▼ -2.98%
- Metro
- North Port-Sarasota-Bradenton, FL
- State GDP YoY
- ▲ 3.28%
- F500 in state
- 36
Industry mix (Fortune 500 HQ in FL)
| Industry | F500 HQs | Revenue |
|---|---|---|
| Industrial Technology | 2 | $29B |
|
||
| Insurance | 2 | $17B |
|
||
| Retail | 1 | $60B |
|
||
| Technology Distribution | 1 | $58B |
|
||
| Homebuilding | 1 | $35B |
|
||
| Technology Manufacturing | 1 | $35B |
|
||
Cash-flow waterfall
monthlySold comps — $/sqft
last 12 mo · ≤1 miLoading sold comps…