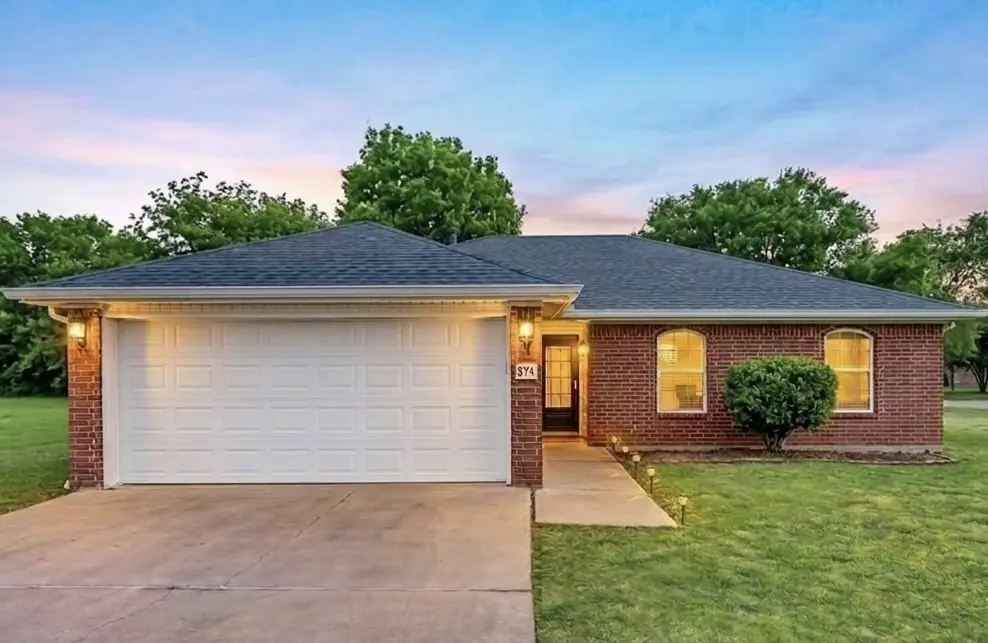
871 Bliss St · Centerton, AR
Flood risk 1/10 · Minimal
- FEMA flood zone
- X (unshaded)
- Chance of flooding over 30 yrs
- 0.0%
- Est. flood insurance / yr
- $507 – $1,088
Fire risk 5/10 · Moderate
- Est. fire insurance / yr
- $1,499 – $2,785
Heat risk 5/10 · Moderate
- Hot days now (above 105°F)
- 7 days/yr
- Hot days in 30 yrs
- 21 days/yr
Wind risk 2/10 · Minimal
- Chance of severe wind over 30 yrs
- 2.0%
Air-quality risk 2/10 · Minimal
- Unhealthy air days now
- 0 days/yr
- Unhealthy air days in 30 yrs
- 1 days/yr
Risk factors via First Street. Map © Google.
Why this score? — see what drove the D grade
The composite is a weighted blend of 9 inputs, each scored 0–100. Each bar is that input's sub-score; the figure is the points it added to the 100-point composite (weight × sub-score).
- ARV discount +8.6/15.0
- Cash flow +8.5/30.0
- Schools +5.2/10.0
- Appreciation +4.6/10.0
- Livability +3.9/5.0
- Rent growth +2.7/5.0
- Condition / age +2.5/5.0
- DSCR +2.3/10.0
- 1% rule +2.0/10.0
$225,000
🖨 Deal sheet 📄 Offer letter ✓ Due diligence
Listing remarks
Charming 3-bedroom, 2-bath home offering great value in a hard-to-find price range! Fresh interior paint and new carpet create a move-in ready feel. Kitchen appliances include refrigerator, washer, and dryer—all to convey as-is. Additional features include a spacious 2-car garage and functional layout for everyday living. Major updates completed around 2020 include roof, gutters, and garage door for added peace of mind. Ideally located with convenient access to shopping, dining, and amenities. Whether you’re a first-time buyer, downsizing, or investing, this home presents a fantastic opportunity in a desirable location!
Key facts
- Kitchen appliances
- New carpet
- Spacious garage
Tags
Neighborhood map
What this means for you Summary
Snapshot
- This is a 3-bed/2.0-bath single-family listed at $225k.
Deal economics
- At list price, monthly cash flow is $-196 ($-2k/yr) — negative.
- To cash-flow at today's rent, offer at most $190k (15.4% below list).
- To meet the 1% rule (rent ≥ 1% of price), the offer needs to be $156k (30.5% below list).
- Recommended offer: $156k (30.5% below list) — sets the bar for 1% rule.
- Cap rate 5.2% vs local median 2.9% in Centerton — top-decile yield for the area; either an underpriced asset or a hidden risk that comps aren't pricing in. Stress-test before assuming the spread holds.
Location & tenants
- Location reads 77/100 on livability (#11 in AR, #3,194 nationally) — a middle-class / working-renter tenant base. Strengths: crime A+, employment A+, cost of living A+; Watch: amenities F, commute F.
- Bentonville School District (urban): math 59% / reading 59% proficiency, ranked #3 of 238 in AR (top 1%) — acceptable for families but not a draw, mixed tenant base, ~2y average lease.
- Market conditions: Rents flat; 458 active listings in the ZIP; 20 comparable units currently listed for rent nearby; rentals at typical pace (median 24d on market — plan ~3-4 weeks tenant-placement turnaround); high-income renter base; 4,359 units permitted in Benton County in 2024 (402 in 5+ unit buildings).
- This rent is only 17% of the median local income ($114k/yr) — well below the 30% rent-burden line; pricing power to push rent on renewal without tenant pushback.
Forward outlook
- Local home prices are declining (-0.9%/yr); year-one equity from $2k of loan paydown is wiped out by about $2k of value loss. Plan a longer hold.
- Benton County population projected at +56% by 2050 — long-run rental-demand tailwind backs the buy-and-hold thesis.
Negotiation context
- Only 3 days on market — expect competitive offers; lowballing is unlikely to land.
- Current owner paid $79k; list at $225k implies a 185% gain — meaningful room to come down on a strong offer.
Risks & watch-outs
- Climate carrying-cost: moderate wildfire risk; extreme-heat days projected 7→21/yr by 2055 (HVAC capex compounding) — expect insurance premiums to compound above CPI over the hold.
Questions for the listing agent
- What do current leases actually rent for vs. the listed asking? Can we see a recent rent roll and the last 12 months of T-12 income?
- Is there a deadline driving the sale (1031 exchange, divorce, estate, relocation)? That informs how much negotiation room exists.
- Schools are B-rated — typically a magnet for longer-tenancy family renters. What's the average tenant stay here, and is there a school-zone premium baked into asking?
- The area grade is low — what's the realistic commute time and amenity access for the typical tenant pool here? Any planned neighborhood developments (good or bad) we should know about?
- What's the average days-on-market for RENTAL listings here right now (not sales)? A rising rental-DOM trend means longer vacancies and softer asking-rent achievability than the comps imply.
- What's the recent tenant-quality profile in this submarket — average credit score on applications, eviction rate, late-payment / NSF rate, and stable-employment percentage? A property-management company in the area should have these aggregated.
- How much new for-sale + rental construction is in the pipeline within 1–3 miles? Heavy new supply typically softens prices + rents 12–24 months out; constrained supply supports both.
Investment metrics
- 1% rule
- 0.70% ✗
- Cap rate
- 5.25%
- Cash-on-cash
- -3.74%
- DSCR
- 0.83
- GRM
- 12.0
CMA / ARV
- ARV (on-the-fly)
- $230,724
- Comps found
- 12
Show comp detail 12 sales within ~0.75 mi
| Address | Dist | Beds/Ba | Sqft | Sold | Price | $/sf | Match |
|---|---|---|---|---|---|---|---|
| 871 Bliss St | 0.00mi | 3/2.0 | 1,131 (0%) | 1mo | $228,000 | $202 | 99 |
| 211 Sun Meadow Dr | 0.38mi | 3/2.0 | 1,116 (-1%) | 6mo | $225,000 | $202 | 75 |
| 200 Sun Meadow Dr | 0.40mi | 3/2.0 | 1,116 (-1%) | 6mo | $243,000 | $218 | 74 |
| 816 Michael St | 0.21mi | 3/2.0 | 1,209 (+7%) | 7mo | $223,500 | $185 | 73 |
| 1071 Bliss St | 0.23mi | 3/2.0 | 1,230 (+9%) | 6mo | $255,000 | $207 | 70 |
| 510 Sun Mdw | 0.15mi | 3/2.0 | 1,275 (+13%) | 6mo | $259,900 | $204 | 67 |
| 916 Zachary St | 0.38mi | 3/2.0 | 1,246 (+10%) | 0mo | $240,000 | $193 | 65 |
| 1340 Forest Dr | 0.64mi | 3/2.0 | 1,148 (+2%) | 8mo | $250,000 | $218 | 61 |
| 421 N D St | 0.40mi | 3/2.0 | 1,299 (+15%) | 0mo | $269,000 | $207 | 56 |
| 129 Southland St | 0.60mi | 3/1.0 | 1,062 (-6%) | 2mo | $239,900 | $226 | 56 |
| 269 Fern St | 0.75mi | 3/2.0 | 1,200 (+6%) | 2mo | $230,000 | $192 | 54 |
| 228 N C St | 0.57mi | 3/2.0 | 1,014 (-10%) | 5mo | $199,900 | $197 | 52 |
Match score weights: distance 35% · size 25% · config 20% · recency 20%. Top-matched comps best support the ARV.
Projected returns pro-forma
-0.87% appreciation · 0.64% rent growth · sell at horizon
- IRR
- -11.8%
- Equity multiple
- 0.50×
- Total profit
- $-31,806
- Equity at exit
- $55,719
- IRR
- -7.0%
- Equity multiple
- 0.39×
- Total profit
- $-38,516
- Equity at exit
- $59,716
Cash invested: $63,000 (down + closing). Projections, not guarantees.
Landlord ↔ Tenant lean methodology
- Overall (STATE)
- 92 Strongly Landlord-Friendly
- State Arkansas
- 92 Strongly Landlord-Friendly · R+14
- County
- — inherits STATE
- City
- — inherits STATE
ZIP-level market 72719
- Home prices YoY
- -0.3%
- Rents YoY
- 0.6%
- Active inventory
- 458
- Price-to-rent
- 12.0×
Monthly cashflow live
- Estimated rent
- $1,564 high interval (Pro) →
- Mortgage (P&I)
- −$1,180
- Tax from tax record
- −$159 /mo · $1,902/yr
- Insurance
- −$94
- HOA
- −$0
- Vacancy / Maint / Mgmt
- −$329
- Net cashflow
- $-196
Break-even live
UW: 25.0% down · 7.5% · 30yr · 1.5% tax · 5.0% vac · 8.0% maint · 8.0% mgmt
Financing live
Cash to close
- Down payment
- $56,250
- Closing costs
- $6,750
- Reserves months
- —
- Total cash needed
- —
Loan-product check · same deal, 3 products live
Conventional
25% down · 7.5% · 30yr
- Down + closing
- —
- Monthly P&I
- —
- Monthly cashflow
- —
- DSCR
- —
- Eligible?
- —
Personal DTI + credit; lowest rate.
DSCR
20% down · 8.5% · 30yr
- Down + closing
- —
- Monthly P&I
- —
- Monthly cashflow
- —
- DSCR
- —
- Eligible?
- —
No personal income docs; deal must DSCR.
Hard money
10% down · 12.0% · 12mo
- Down + closing
- —
- Monthly P&I
- —
- Monthly cashflow
- —
- DSCR
- —
- Eligible?
- —
Short-term bridge; refi at stabilization.
Rent comps 20 comps
| Address | Beds | Baths | Sqft | Rent | $/sqft | DOM | Units | Dist |
|---|---|---|---|---|---|---|---|---|
| 650 Appleridge Dr Centerton, AR | 2.0 | 2.0 | 1156 | $1,300 | $1.12 | 23d | 1 | 0.08mi |
| 662 Appleridge Dr Centerton, AR | 2.0 | 2.0 | 1182 | $1,300 | $1.10 | 23d | 1 | 0.09mi |
| 720 Appleridge Dr Centerton, AR | 2.0 | 2.0 | 1200 | $1,300 | $1.08 | 14d | 1 | 0.14mi |
| 1002 Applewood Cir Centerton, AR | 3.0 | 2.0 | 1464 | $1,750 | $1.20 | 23d | 1 | 0.20mi |
| 440 N Brookfield Dr Centerton, AR | 3.0 | 2.0 | 1279 | $1,495 | $1.17 | 21d | 1 | 0.25mi |
| 813 Valley Oaks Ln Centerton, AR | 3.0 | 2.0 | 1455 | $1,595 | $1.10 | 23d | 1 | 0.27mi |
| 901 Valley Oaks Ln Centerton, AR | 3.0 | 2.0 | 1455 | $1,595 | $1.10 | 23d | 1 | 0.29mi |
| 440 Spicewood Trl Centerton, AR | 3.0 | 2.0 | 1422 | $1,575 | $1.11 | 23d | 1 | 0.29mi |
| 616 Sadie Ln Centerton, AR | 2.0 | 2.0 | 1000 | $1,000 | $1.00 | 23d | 1 | 0.56mi |
| 1389 W Centerton Blvd Centerton, AR | 1.0–3.0 | 1.0–2.5 | 980 | $1,500 | $1.53 | 14d | 16 | 0.72mi |
| 182 E 2nd St Centerton, AR | 3.0 | 2.0 | 1468 | $1,650 | $1.12 | 14d | 1 | 0.73mi |
| 901 Belhaven Rd Centerton, AR | 3.0 | 2.0 | 1366 | $1,750 | $1.28 | 14d | 1 | 0.90mi |
| 491 Azurite Rd Centerton, AR | 3.0 | 2.5 | 1420 | $1,650 | $1.16 | 14d | 1 | 0.94mi |
| 451 Azurite Rd Centerton, AR | 3.0 | 2.5 | 1420 | $1,650 | $1.16 | 14d | 1 | 0.94mi |
| 231 Graystone Cir Centerton, AR | 3.0 | 2.0 | 1128 | $1,225 | $1.09 | 21d | 1 | 0.94mi |
| 249 Graystone Cir Unit 251 Centerton, AR | 3.0 | 2.0 | 1128 | $1,225 | $1.09 | 23d | 1 | 0.98mi |
| 251 Graystone Cir Centerton, AR | 3.0 | 2.0 | 1300 | $1,225 | $0.94 | 23d | 1 | 0.98mi |
| 501 E Centerton Blvd Centerton, AR | 1.0–2.0 | 1.0–2.0 | 835 | $1,292 | $1.55 | 14d | 25 | 1.23mi |
| 803 SW Green World St Bentonville, AR | 3.0 | 2.0 | 1422 | $1,695 | $1.19 | 23d | 1 | 1.44mi |
| 156 Copper Oaks Dr Centerton, AR | 2.0 | 2.0 | 1140 | $1,550 | $1.36 | 23d | 1 | 1.50mi |
Listing history 3 events
-
2026-04-02status Pending
-
2026-03-30$225,000 Active
-
2003-03-19soldstatus $79,000
ⓘ Source: listings_history table (triggers on properties + properties_extension) + one-shot
backfill from property_details.listing_events for pre-trigger history.
Tax reassessment forecast AR · Resets to sale price
- Current annual tax
- $1,902 · $159/mo
- Projected year-2 tax
- $1,902 · $159/mo
- Expected delta
- $0/yr ($0/mo · 0.0%)
ⓘ Screening estimate from a state-policy table — verify with the county assessor before closing.
Climate risk First Street
- Flood 1/10 Low FEMA zone X (unshaded) · 0% chance over 30 yrs
- Wildfire 5/10 Major
- Heat 5/10 Major 7 d/yr ≥105°F today · 21 d/yr by 30 yrs out
- Wind 2/10 Low 2% chance of damaging wind over 30 yrs
- Air quality 2/10 Low 0 unhealthy d/yr today · 1 by 30 yrs out
Nearby sold comps map
Loading sold comps map…
Walkable amenities ~0.75 mi
Loading nearby amenities…
Taxation est. · year 1
- Rental income
- $18,772
- − Mortgage interest
- −$12,603
- − Property taxes
- −$1,902
- − Insurance
- −$1,125
- − Repairs & maintenance
- −$1,502
- − Management
- −$1,502
- − Depreciation
- −$6,545
- Taxable loss
- −$6,407
- Est. tax savings @ 24.0%
- +$1,538
- After-tax cash flow
- $-818/yr
For passive investors: Depreciation is non-cash, so a rental often shows a tax loss while cash-flowing — sheltering income. Rental losses are passive: they offset passive income freely, and up to $25,000/yr can offset ordinary (W-2) income if you actively participate and your MAGI is under $100k (phasing out to $0 by $150k); unused losses carry forward. On sale, claimed depreciation is recaptured at up to 25%, and gains may owe capital-gains tax (a 1031 exchange can defer both). Figures are a year-1 estimate at your 24.0% rate — not tax advice; consult a CPA.
Schools (NCES district)
- District
- Bentonville School District
- NCES district ID
- 0503060
- Math proficiency
- 59% ▼ -8.00%
- Reading proficiency
- 59% ▼ -6.00%
- Median HH income
- $66,721
- Composite
- 51.85/100
- National rank
- #1661
- State rank
- #3 of 238 in AR
Livability — Centerton
- Score
- 77/100
- State rank
- #11
- US rank
- #3194
Category grades
Schools grade is shown separately in the Schools card above.
Census & demographics
- Census place
- Centerton, AR
- County
- Benton County · 259,241 people
- City population
- 19,701
- Metro
- Fayetteville-Springdale-Rogers, AR
- Population (ZIP)
- 19,701
- Household income
- $113,542
- Rent vs Own
- Severe rent burden
- 374.0
Population outlook (Benton County) Hauer SSP2
- Today (2025)
- 318,683 people
- By 2030
- 353,481 · +10.9%
- By 2040
- 425,280 · +33.4%
- By 2050
- 497,239 · +56.0%
- By 2075
- 662,114 · +107.8%
- By 2100
- 776,431 · +143.6%
Race, ethnicity, and origin ACS 2023
- Neighborhood character
- Diverse neighborhood (Simpson 0.64)
- Race & ethnicity
- White 58% Two or more races 25% Hispanic / Latino 14% Black 6% Asian 5%
- Hispanic origin (detail)
- Mexican 8% Cuban 2%
- Common ancestry
- Slovak 2% Italian 1% Lithuanian 1%
- Foreign-born
- 10% · Canada, Vietnam
- Languages at home
- 89% English-only · Spanish 9% Vietnamese 1% Other Asian/Pacific 1%
Political lean MEDSL · Benton
- 2024 margin
- Strong R (+27.0) · D 35.2% · R 62.1% · Other 2.7%
- 2008→2024 swing
- +9.6pp toward D · 2008: -36.5pp · 2024: -27.0pp
- All cycles
- 2024: R+27.0 2020: R+26.4 2016: R+34.9 2012: R+40.4 2008: R+36.5
Not yet ingested
- Civics
- —
Market trends
- HPI YoY
- ▼ -0.87%
- Current HPI
- 320.376
- Rent YoY
- ▲ 0.64%
- Metro
- Fayetteville-Springdale-Rogers, AR
- State GDP YoY
- ▲ 3.80%
- F500 in state
- 10
Industry mix (Fortune 500 HQ in AR)
| Industry | F500 HQs | Revenue |
|---|---|---|
| Retail | 1 | $681B |
|
||
| Food / Agriculture | 1 | $53B |
|
||
| Retail / Energy | 1 | $22B |
|
||
| Transportation / Logistics | 1 | $12B |
|
||
| Energy | 1 | $4B |
|
||
Price history
+184.8% since first listed3 events — show timeline
- 2026-04-02 Pending — NWARMLS
- 2026-03-30 Listed $225,000 NWARMLS
- 2003-03-19 Sold (Public Records) $79,000 Public Records
Property tax history
+4.9%/yrLatest (2025): $1,902 · +10.6% YoY. Source: county tax records.
Cash-flow waterfall
monthlySold comps — $/sqft
last 12 mo · ≤1 miLoading sold comps…