825 Queenswood Ct · Indianapolis city (balance), IN
Flood risk 1/10 · Minimal
- FEMA flood zone
- X (unshaded)
- Chance of flooding over 30 yrs
- 0.0%
- Est. flood insurance / yr
- $473 – $860
Fire risk 1/10 · Minimal
- Est. fire insurance / yr
- $717 – $1,331
Heat risk 4/10 · Minor
- Hot days now (above 102°F)
- 7 days/yr
- Hot days in 30 yrs
- 19 days/yr
Wind risk 2/10 · Minimal
- Chance of severe wind over 30 yrs
- 1.0%
Air-quality risk 2/10 · Minimal
- Unhealthy air days now
- 2 days/yr
- Unhealthy air days in 30 yrs
- 2 days/yr
Risk factors via First Street. Map © Google.
Why this score? — see what drove the F grade
The composite is a weighted blend of 9 inputs, each scored 0–100. Each bar is that input's sub-score; the figure is the points it added to the 100-point composite (weight × sub-score).
- ARV discount +6.4/15.0
- Cash flow +5.8/30.0
- Schools +3.5/10.0
- Rent growth +3.4/5.0
- Livability +2.5/5.0
- Condition / age +2.5/5.0
- 1% rule +0.8/10.0
- DSCR +0.2/10.0
- Appreciation +0.0/10.0
$349,900
🖨 Deal sheet 📄 Offer letter ✓ Due diligence
Listing remarks
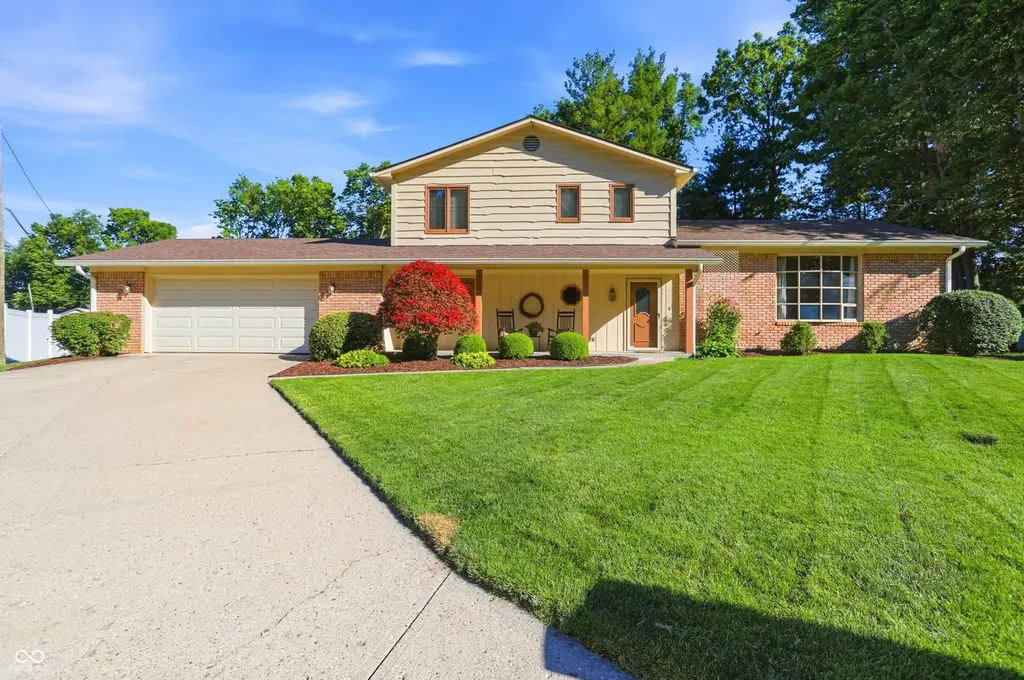
Tucked away on a quiet cul-de-sac, this custom-built all-brick home offers the perfect combination of privacy, space, and timeless quality. The highlight of the property is the incredible tree-lined backyard-a peaceful retreat featuring a large deck, expansive walkout patio, and mature shade trees that create the perfect setting for morning coffee, family gatherings, or relaxing evenings outdoors. Inside, the spacious eat-in kitchen overlooks the family room, making it easy to stay connected while preparing meals, entertaining guests, or enjoying everyday life. With four bedrooms, a basement, and multiple living spaces, there's plenty of room for everyone to spread out and enjoy their own s
Key facts
- Large deck
- Tree lined backyard
- Eat in kitchen
Tags
Property features AI
Finance
- Other: Property type: Residential, single-family; Lot size approximately 0.32 acres (about 1/4–1/2 acre)
Exterior
- Parking: Attached garage with service door; Two garage spaces
- Utilities: Public water; Municipal sewer connected; Solid waste service available
- Home design: Single-family residence; Multi/split levels; Property facing direction not specified; Entry level information not specified
- Construction: Brick and wood siding exterior; Concrete perimeter foundation; Year built not specified
- Exterior features: Covered patio/porch; Deck; Patio; Lot sits on a cul-de-sac with mature trees
Interior
- Kitchen: Electric oven; Dishwasher; Refrigerator; Eat-in kitchen with pantry and breakfast bar
- Bedrooms: Four bedrooms total — three on the upper level, one on the main level
- Bathrooms: Two full bathrooms and one half bathroom; Primary bathroom includes a full shower stall
- Heating & cooling: Forced air heating; Heat pump (provides heating and cooling); Central air conditioning
- Interior features: Attic pull-down stairs; Breakfast bar; Built-in features; Eat-in kitchen; Pantry; Finished partial basement with storage space; Radon system; Sump pump with backup; Water softener (owned); Living room is formal; utility room included
- Laundry & utility: Washer and dryer included; Laundry room located on the main level; Water heater
Neighborhood map
What this means for you Summary
Snapshot
- This is a 4-bed/1.5-bath single-family listed at $350k.
Deal economics
- At list price, monthly cash flow is $-693 ($-8k/yr) — negative.
- To cash-flow at today's rent, offer at most $227k (35.0% below list).
- To meet the 1% rule (rent ≥ 1% of price), the offer needs to be $204k (41.8% below list).
- Recommended offer: $204k (41.8% below list) — sets the bar for 1% rule.
Location & tenants
- Location reads: area grade F — affects rentability + tenant quality, not the cash-flow math above.
- Perry Township Schools (urban): math 36% / reading 45% proficiency, ranked #138 of 301 in IN (top 46%) — families likely to look elsewhere, expect single-tenant / working-renter base with shorter leases.
- Market conditions: Rents rising (+3.5%/yr); 210 active listings in the ZIP; 5 comparable units currently listed for rent nearby; rentals leasing fast (median 8d on market — plan ~1-2 weeks tenant-placement turnaround); solid renter incomes; 1,906 units permitted in Marion County in 2024 (621 in 5+ unit buildings).
Forward outlook
- Local home prices are declining (-3.0%/yr); year-one equity from $2k of loan paydown is wiped out by about $10k of value loss. Plan a longer hold.
- Marion County population projected at +18% by 2050 — long-run rental-demand tailwind backs the buy-and-hold thesis.
Negotiation context
- Only 1 days on market — expect competitive offers; lowballing is unlikely to land.
Questions for the listing agent
- What do current leases actually rent for vs. the listed asking? Can we see a recent rent roll and the last 12 months of T-12 income?
- Built in 1977 — when were the roof, HVAC, electrical panel, plumbing, and water heater last replaced?
- Is there a deadline driving the sale (1031 exchange, divorce, estate, relocation)? That informs how much negotiation room exists.
- The area grade is low — what's the realistic commute time and amenity access for the typical tenant pool here? Any planned neighborhood developments (good or bad) we should know about?
- What's the average days-on-market for RENTAL listings here right now (not sales)? A rising rental-DOM trend means longer vacancies and softer asking-rent achievability than the comps imply.
- What's the recent tenant-quality profile in this submarket — average credit score on applications, eviction rate, late-payment / NSF rate, and stable-employment percentage? A property-management company in the area should have these aggregated.
- How much new for-sale + rental construction is in the pipeline within 1–3 miles? Heavy new supply typically softens prices + rents 12–24 months out; constrained supply supports both.
Investment metrics
- 1% rule
- 0.58% ✗
- Cap rate
- 3.92%
- Cash-on-cash
- -8.49%
- DSCR
- 0.62
- GRM
- 14.3
CMA / ARV
- ARV (on-the-fly)
- $341,280
- Comps found
- 12
Show comp detail 12 sales within ~0.75 mi
| Address | Dist | Beds/Ba | Sqft | Sold | Price | $/sf | Match |
|---|---|---|---|---|---|---|---|
| 8902 Royal Meadow Dr | 0.25mi | 3/2.5 (-1) | 2,156 (-0%) | 3mo | $340,000 | $158 | 76 |
| 8422 Kankakee Ct | 0.55mi | 4/2.5 | 2,074 (-4%) | 2mo | $297,500 | $143 | 62 |
| 8498 Seattle Slew Ln | 0.61mi | 4/2.5 | 2,042 (-6%) | 4mo | $302,500 | $148 | 55 |
| 8459 Seattle Slew Ln | 0.60mi | 4/2.0 | 2,001 (-7%) | 4mo | $297,000 | $148 | 55 |
| 361 Country Woods Dr | 0.54mi | 3/2.0 (-1) | 2,395 (+11%) | 2mo | $365,000 | $152 | 48 |
| 8611 Kenasaw Ct | 0.53mi | 3/2.0 (-1) | 1,907 (-12%) | 2mo | $315,000 | $165 | 47 |
| 8138 Burn Ct | 0.64mi | 4/2.5 | 2,334 (+8%) | 8mo | $400,000 | $171 | 46 |
| 8512 Gallant Fox Dr | 0.68mi | 3/2.0 (-1) | 1,924 (-11%) | 2mo | $342,000 | $178 | 42 |
| 1348 Secretariat Ln | 0.64mi | 3/2.0 (-1) | 1,861 (-14%) | 2mo | $293,500 | $158 | 38 |
| 8518 Lockwood Pl | 0.65mi | 3/2.0 (-1) | 1,858 (-14%) | 1mo | $295,000 | $159 | 38 |
| 8414 Gallant Fox Dr | 0.70mi | 3/2.5 (-1) | 2,454 (+14%) | 1mo | $350,000 | $143 | 35 |
| 8209 Burn Ct | 0.62mi | 3/2.5 (-1) | 1,876 (-13%) | 8mo | $330,000 | $176 | 34 |
Match score weights: distance 35% · size 25% · config 20% · recency 20%. Top-matched comps best support the ARV.
Projected returns pro-forma
-3.0% appreciation · 3.46% rent growth · sell at horizon
- IRR
- -30.8%
- Equity multiple
- -0.02×
- Total profit
- $-99,930
- Equity at exit
- $52,171
- IRR
- -31.7%
- Equity multiple
- -0.43×
- Total profit
- $-140,092
- Equity at exit
- $30,253
Cash invested: $97,972 (down + closing). Projections, not guarantees.
Landlord ↔ Tenant lean methodology
- Overall (STATE)
- 90 Strongly Landlord-Friendly
- State Indiana
- 90 Strongly Landlord-Friendly · R+11
- County
- — inherits STATE
- City
- — inherits STATE
ZIP-level market 46217
- Rents YoY
- 3.5%
- Active inventory
- 210
- Price-to-rent
- 14.3×
Monthly cashflow live
- Estimated rent
- $2,037 high interval (Pro) →
- Mortgage (P&I)
- −$1,835
- Tax from tax record
- −$322 /mo · $3,859/yr
- Insurance
- −$146
- HOA
- −$0
- Vacancy / Maint / Mgmt
- −$428
- Net cashflow
- $-693
Break-even live
UW: 25.0% down · 7.5% · 30yr · 1.5% tax · 5.0% vac · 8.0% maint · 8.0% mgmt
Financing live
Cash to close
- Down payment
- $87,475
- Closing costs
- $10,497
- Reserves months
- —
- Total cash needed
- —
Loan-product check · same deal, 3 products live
Conventional
25% down · 7.5% · 30yr
- Down + closing
- —
- Monthly P&I
- —
- Monthly cashflow
- —
- DSCR
- —
- Eligible?
- —
Personal DTI + credit; lowest rate.
DSCR
20% down · 8.5% · 30yr
- Down + closing
- —
- Monthly P&I
- —
- Monthly cashflow
- —
- DSCR
- —
- Eligible?
- —
No personal income docs; deal must DSCR.
Hard money
10% down · 12.0% · 12mo
- Down + closing
- —
- Monthly P&I
- —
- Monthly cashflow
- —
- DSCR
- —
- Eligible?
- —
Short-term bridge; refi at stabilization.
Rent comps 5 comps
| Address | Beds | Baths | Sqft | Rent | $/sqft | DOM | Units | Dist |
|---|---|---|---|---|---|---|---|---|
| 825 Country Ln Indianapolis, IN | 3.0 | 2.0 | 1892 | $1,891 | $1.00 | 7d | 1 | 0.08mi |
| 8145 Maple Stream Ln Indianapolis, IN | 3.0 | 2.5 | 1688 | $1,756 | $1.04 | 23d | 1 | 0.67mi |
| 8101 Railroad Rd Indianapolis, IN | 4.0 | 1.5 | 1604 | $1,766 | $1.10 | 22d | 1 | 0.71mi |
| 8020 Lake Tree Cir Indianapolis, IN | 3.0 | 2.5 | 1690 | $1,835 | $1.09 | 7d | 1 | 0.78mi |
| 2755 Bloom Dr Greenwood, IN | 1.0–3.0 | 1.0–2.0 | 1172 | $2,000 | $1.71 | 1d | 79 | 1.20mi |
Listing history 2 events
-
2026-06-18remarks 699-char remark
-
2026-06-18$349,900 Active 1 DOM
ⓘ Source: listings_history table (triggers on properties + properties_extension) + one-shot
backfill from property_details.listing_events for pre-trigger history.
Tax reassessment forecast IN · Partial reset (capped growth)
- Current annual tax
- $3,859 · $322/mo
- Projected year-2 tax
- $3,859 · $322/mo
- Expected delta
- $0/yr ($0/mo · 0.0%)
ⓘ Screening estimate from a state-policy table — verify with the county assessor before closing.
Climate risk First Street
- Flood 1/10 Low FEMA zone X (unshaded) · 0% chance over 30 yrs
- Wildfire 1/10 Low
- Heat 4/10 Moderate 7 d/yr ≥102°F today · 19 d/yr by 30 yrs out
- Wind 2/10 Low 100% chance of damaging wind over 30 yrs
- Air quality 2/10 Low 2 unhealthy d/yr today · 2 by 30 yrs out
Nearby sold comps map
Loading sold comps map…
Walkable amenities ~0.75 mi
Loading nearby amenities…
Taxation est. · year 1
- Rental income
- $24,445
- − Mortgage interest
- −$19,600
- − Property taxes
- −$3,859
- − Insurance
- −$1,750
- − Repairs & maintenance
- −$1,956
- − Management
- −$1,956
- − Depreciation
- −$10,179
- Taxable loss
- −$14,854
- Est. tax savings @ 24.0%
- +$3,565
- After-tax cash flow
- $-4,751/yr
For passive investors: Depreciation is non-cash, so a rental often shows a tax loss while cash-flowing — sheltering income. Rental losses are passive: they offset passive income freely, and up to $25,000/yr can offset ordinary (W-2) income if you actively participate and your MAGI is under $100k (phasing out to $0 by $150k); unused losses carry forward. On sale, claimed depreciation is recaptured at up to 25%, and gains may owe capital-gains tax (a 1031 exchange can defer both). Figures are a year-1 estimate at your 24.0% rate — not tax advice; consult a CPA.
Schools (NCES district)
- District
- Perry Township Schools
- NCES district ID
- 1808820
- Math proficiency
- 36% ▼ -13.00%
- Reading proficiency
- 45% ▼ -6.00%
- Median HH income
- $47,170
- Composite
- 34.61/100
- National rank
- #5153
- State rank
- #138 of 301 in IN
Livability — Indianapolis city (balance)
No livability data for this city. (Only ~50 U.S. cities are tracked.)
Census & demographics
- Census place
- Indianapolis city (balance), IN
- County
- Marion County · 998,460 people
- City population
- 881,119
- Metro
- Indianapolis-Carmel-Anderson, IN
- Population (ZIP)
- 36,917
- Household income
- $92,029
- Rent vs Own
- Severe rent burden
- 472.0
Population outlook (Marion County) Hauer SSP2
- Today (2025)
- 1,025,572 people
- By 2030
- 1,065,727 · +3.9%
- By 2040
- 1,141,577 · +11.3%
- By 2050
- 1,208,920 · +17.9%
- By 2075
- 1,367,288 · +33.3%
- By 2100
- 1,438,201 · +40.2%
Race, ethnicity, and origin ACS 2023
- Neighborhood character
- Diverse neighborhood (Simpson 0.60)
- Race & ethnicity
- White 59% Asian 20% Black 10% Hispanic / Latino 8% Two or more races 6%
- Hispanic origin (detail)
- Mexican 6%
- Common ancestry
- Lithuanian 3% Romanian 2% Iranian 1%
- Foreign-born
- 17% · Philippines, Canada, China
- Languages at home
- 76% English-only · Other Asian/Pacific 15% Spanish 6% Other Indo-European 1%
Political lean MEDSL · Marion
- 2024 margin
- Strong D (+27.7) · D 63.0% · R 35.3% · Other 1.7%
- 2008→2024 swing
- -0.7pp no change · 2008: 28.4pp · 2024: 27.7pp
- All cycles
- 2024: D+27.7 2020: D+29.1 2016: D+22.8 2012: D+22.2 2008: D+28.4
Not yet ingested
- Civics
- —
Market trends
- HPI YoY
- ▼ -221.18%
- Current HPI
- 223.147
- Rent YoY
- ▲ 3.46%
- Metro
- Indianapolis-Carmel-Anderson, IN
- State GDP YoY
- ▲ 2.90%
- F500 in state
- 18
Industry mix (Fortune 500 HQ in IN)
| Industry | F500 HQs | Revenue |
|---|---|---|
| Industrial Machinery | 2 | $37B |
|
||
| Healthcare | 1 | $177B |
|
||
| Pharmaceuticals | 1 | $45B |
|
||
| Metals / Steel | 1 | $18B |
|
||
| Agriculture | 1 | $17B |
|
||
| Packaging | 1 | $12B |
|
||
Price history
1 event — show timeline
- 2026-06-18 Listed $349,900 MIBOR as Distributed by MLS Grid
Property tax history
+6.1%/yrLatest (2025): $3,859 · -8.1% YoY. Source: county tax records.
Cash-flow waterfall
monthlySold comps — $/sqft
last 12 mo · ≤1 miLoading sold comps…