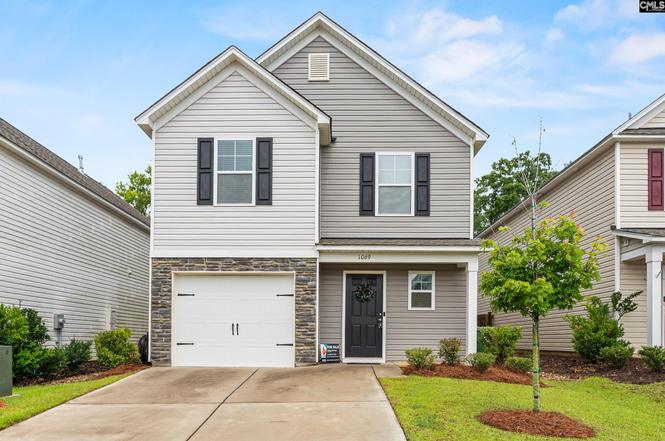
1069 Crescent Moon Loop · Columbia, SC
Flood risk No data
- FEMA flood zone
- —
- Chance of flooding over 30 yrs
- —
- Est. flood insurance / yr
- —
Fire risk No data
- Est. fire insurance / yr
- —
Heat risk No data
- Hot days now (above threshold)
- —
- Hot days in 30 yrs
- —
Wind risk No data
- Chance of severe wind over 30 yrs
- —
Air-quality risk No data
- Unhealthy air days now
- —
- Unhealthy air days in 30 yrs
- —
Risk factors via First Street. Map © Google.
Why this score? — see what drove the D- grade
The composite is a weighted blend of 9 inputs, each scored 0–100. Each bar is that input's sub-score; the figure is the points it added to the 100-point composite (weight × sub-score).
- Cash flow +12.2/30.0
- ARV discount +6.7/15.0
- Livability +3.9/5.0
- 1% rule +3.6/10.0
- DSCR +3.6/10.0
- Schools +2.6/10.0
- Rent growth +2.5/5.0
- Condition / age +2.5/5.0
- Appreciation +0.0/10.0
$247,000
🖨 Deal sheet (PDF) 📄 Offer letter ✓ Due diligence
Listing remarks
Welcome home to 1069 Crescent Moon Loop! Situated on a premium lot, this home offers added privacy with no rear neighbors to stare at. Instead, enjoy peaceful wooded views from your fully fenced backyard, creating the perfect space to relax, entertain, or let pets play freely. Inside, you'll find modern finishes throughout, including quartz countertops and stainless steel appliances, giving the home a stylish and contemporary feel. Ideally located just minutes from the William Jennings Bryan Dorn VA Medical Center, approximately 15 minutes from Fort Jackson, and about 35 minutes from Shaw Air Force Base, this home provides convenient access to key destinations while maintaining a quiet resi
Key facts
- Quartz countertops
- No rear neighbors
- Wooded views
Tags
Property features AI
Finance
- HOA & community: Has association; Association covers common area maintenance
Exterior
- Parking: Three total parking spaces; One attached garage at main level
- Utilities: Public water; Public sewer
- Home design: Two-story home
- Construction: Vinyl exterior; Slab foundation
- Exterior features: Automatic sprinkler system; Full privacy fence; Paved road access
Interior
- Kitchen: Island; Pantry; Granite countertops; Painted cabinets; Recessed lighting; Laminate flooring; Dishwasher; Disposal; Microwave (above stove); Self-cleaning, smooth-surface range
- Bedrooms: Master bedroom with double vanity, walk-in closet, and carpeted floors (Second level); Bedroom 2 with private closet and carpeted floors (Second level); Bedroom 3 with private closet and carpeted floors (Second level)
- Flooring: Carpet in bedrooms; Laminate flooring in formal living and dining areas and kitchen
- Bathrooms: Two full bathrooms; One partial bathroom; One main half-bath
- Heating & cooling: Central cooling; Electric heating
- Interior features: Ceiling fans; Smoke detector; Attic access; Cable TV available
- Laundry & utility: Washer and dryer located on the second level; Laundry area in heated space; Electric water heater
Neighborhood map
What this means for you Summary
Snapshot
- This is a 3-bed/2.5-bath single-family listed at $247k.
Deal economics
- At list price, monthly cash flow is $-52 ($-622/yr) — negative.
- To cash-flow at today's rent, offer at most $239k (3.0% below list).
- To meet the 1% rule (rent ≥ 1% of price), the offer needs to be $213k (13.9% below list).
- Recommended offer: $213k (13.9% below list) — sets the bar for 1% rule.
Location & tenants
- Location reads 78/100 on livability (#18 in SC, #2,436 nationally) — a middle-class / working-renter tenant base. Strengths: amenities A+, commute A+, cost of living A+; Watch: employment D, crime F.
- Richland 01 (urban): math 26% / reading 36% proficiency, ranked #54 of 80 in SC (top 68%) — families likely to look elsewhere, expect single-tenant / working-renter base with shorter leases; 64% free/reduced lunch — lower-income household profile, screen leases tightly.
- Zoned schools: Horrell Hill Elementary (math 17% / reading 17%, grade F, #515 of 597 statewide, top 89%, 562 students, 100% FRL); Lower Richland High (math 5% / reading 64%, grade F, #185 of 196 statewide, top 94%, 1,244 students, 100% FRL) — zoned schools average 100% FRL vs 64% district-wide (36 pts higher); higher-poverty schools than district average — tighter screening recommended.
- Market conditions: 328 active listings in the ZIP; 7 comparable units currently listed for rent nearby; rentals at typical pace (median 15d on market — plan ~3-4 weeks tenant-placement turnaround); 3,472 units permitted in Richland County in 2024 (1,096 in 5+ unit buildings).
- This rent runs 42% of the median local income ($60k/yr) — at the standard rent-burdened threshold; future hikes will face affordability resistance.
Forward outlook
- Local home prices are declining (-3.0%/yr); year-one equity from $2k of loan paydown is wiped out by about $7k of value loss. Plan a longer hold.
- Richland County population projected at +30% by 2050 — long-run rental-demand tailwind backs the buy-and-hold thesis.
Negotiation context
- Only 1 days on market — expect competitive offers; lowballing is unlikely to land.
- 2 sale attempts since 4y ago with the ask held roughly flat each time — persistent listings suggest the price (not the market) is what's stuck; bring a comps-based counter.
Questions for the listing agent
- What do current leases actually rent for vs. the listed asking? Can we see a recent rent roll and the last 12 months of T-12 income?
- What does the HOA fee cover, when was the last increase, and are there any pending special assessments or reserve-fund shortfalls?
- Is there a deadline driving the sale (1031 exchange, divorce, estate, relocation)? That informs how much negotiation room exists.
- Schools are D-rated, which usually means shorter tenancies and higher turnover. Who's the typical renter profile here, and what's been the actual vacancy rate?
- Crime grade is F in this area — have there been break-ins, vandalism, or insurance claims at this property in the last 3 years? What carrier currently insures it and at what premium?
- The area grade is low — what's the realistic commute time and amenity access for the typical tenant pool here? Any planned neighborhood developments (good or bad) we should know about?
- What's the average days-on-market for RENTAL listings here right now (not sales)? A rising rental-DOM trend means longer vacancies and softer asking-rent achievability than the comps imply.
- What's the recent tenant-quality profile in this submarket — average credit score on applications, eviction rate, late-payment / NSF rate, and stable-employment percentage? A property-management company in the area should have these aggregated.
- How much new for-sale + rental construction is in the pipeline within 1–3 miles? Heavy new supply typically softens prices + rents 12–24 months out; constrained supply supports both.
Investment metrics
- 1% rule
- 0.86% ✗
- Cap rate
- 6.04%
- Cash-on-cash
- -0.90%
- DSCR
- 0.96
- GRM
- 9.7
CMA / ARV
- ARV (on-the-fly)
- $242,808
- Comps found
- 4
Show comp detail 4 sales within ~0.75 mi
| Address | Dist | Beds/Ba | Sqft | Sold | Price | $/sf | Match |
|---|---|---|---|---|---|---|---|
| 1062 Crescent Moon Loop | 0.04mi | 3/2.5 | 1,557 (-3%) | 12mo | $252,000 | $162 | 82 |
| 925 Farnsworth Dr | 0.43mi | 3/2.0 | 1,674 (+4%) | 1mo | $247,000 | $148 | 71 |
| 534 S Maney Ct | 0.61mi | 3/1.5 | 1,606 (-0%) | 6mo | $203,010 | $126 | 62 |
| 139 Myers Creek Dr | 0.67mi | 3/2.5 | 1,517 (-6%) | 21mo | $229,000 | $151 | 42 |
Match score weights: distance 35% · size 25% · config 20% · recency 20%. Top-matched comps best support the ARV.
Projected returns pro-forma
-3.0% appreciation · 3.0% rent growth · sell at horizon
- IRR
- -17.8%
- Equity multiple
- 0.37×
- Total profit
- $-43,281
- Equity at exit
- $36,829
- IRR
- -9.8%
- Equity multiple
- 0.40×
- Total profit
- $-41,749
- Equity at exit
- $21,356
Cash invested: $69,160 (down + closing). Projections, not guarantees.
Landlord ↔ Tenant lean methodology
- Overall (STATE)
- 90 Strongly Landlord-Friendly
- State South Carolina
- 90 Strongly Landlord-Friendly · R+6
- County
- — inherits STATE
- City
- — inherits STATE
ZIP-level market 29061
- Home prices YoY
- -22.8%
- Active inventory
- 328
- Price-to-rent
- 9.7×
Monthly cashflow live
- Estimated rent
- $2,127 high interval (Pro) →
- Mortgage (P&I)
- −$1,295
- Tax est. 1.5%
- −$309 /mo · $3,705/yr
- Insurance
- −$103
- HOA
- −$25
- Vacancy / Maint / Mgmt
- −$447
- Net cashflow
- $-52
Break-even live
Sensitivity live
| Price | -10% $119 | -5% $33 | +0% $-52 | +5% $-137 | +10% $-223 |
|---|---|---|---|---|---|
| Rent | -10% $-220 | -5% $-136 | +0% $-52 | +5% $32 | +10% $116 |
| Rate | -1.0pp $73 | -0.5pp $11 | base $-52 | +0.5pp $-116 | +1.0pp $-181 |
UW: 25.0% down · 7.5% · 30yr · 1.5% tax · 5.0% vac · 8.0% maint · 8.0% mgmt
Financing live
Cash to close
- Down payment
- $61,750
- Closing costs
- $7,410
- Reserves months
- —
- Total cash needed
- —
Loan-product check · same deal, 3 products live
Conventional
25% down · 7.5% · 30yr
- Down + closing
- —
- Monthly P&I
- —
- Monthly cashflow
- —
- DSCR
- —
- Eligible?
- —
Personal DTI + credit; lowest rate.
DSCR
20% down · 8.5% · 30yr
- Down + closing
- —
- Monthly P&I
- —
- Monthly cashflow
- —
- DSCR
- —
- Eligible?
- —
No personal income docs; deal must DSCR.
Hard money
10% down · 12.0% · 12mo
- Down + closing
- —
- Monthly P&I
- —
- Monthly cashflow
- —
- DSCR
- —
- Eligible?
- —
Short-term bridge; refi at stabilization.
Rent comps 7 comps
| Address | Beds | Baths | Sqft | Rent | $/sqft | DOM | Units | Dist |
|---|---|---|---|---|---|---|---|---|
| 1049 Crescent Moon Loop Hopkins, SC | 3.0 | 2.5 | 1650 | $2,100 | $1.27 | 14d | 1 | 0.05mi |
| 455 Hunters Crossing Dr Hopkins, SC | 3.0 | 2.0 | 1381 | $1,699 | $1.23 | 14d | 1 | 0.47mi |
| 345 Bevington Brook Ln Hopkins, SC | 3.0 | 2.0 | 1475 | $2,195 | $1.49 | 24d | 1 | 0.85mi |
| 329 Ovanta Rd Columbia, SC | 3.0 | 1.5 | 1100 | $1,200 | $1.09 | 24d | 1 | 1.09mi |
| 352 Sandbach Rd Columbia, SC | 4.0 | 2.5 | 1976 | $2,300 | $1.16 | 14d | 1 | 1.31mi |
| 457 Delahays Rd Columbia, SC | 3.0 | 2.0 | 1704 | $2,000 | $1.17 | 14d | 1 | 1.33mi |
| 440 Delahays Rd Columbia, SC | 3.0 | 2.5 | 1704 | $1,900 | $1.12 | 14d | 1 | 1.34mi |
HOA detail
- Monthly dues
- $25 · $300/yr
Listing history 2 events
-
2026-06-19remarks 699-char remark
-
2026-06-19$247,000 Active 1 DOM
ⓘ Source: listings_history table (triggers on properties + properties_extension) + one-shot
backfill from property_details.listing_events for pre-trigger history.
Nearby sold comps map
Loading sold comps map…
Walkable amenities ~0.75 mi
Loading nearby amenities…
Taxation est. · year 1
- Rental income
- $25,520
- − Mortgage interest
- −$13,836
- − Property taxes
- −$3,705
- − Insurance
- −$1,235
- − Repairs & maintenance
- −$2,042
- − Management
- −$2,042
- − HOA
- −$300
- − Depreciation
- −$7,185
- Taxable loss
- −$4,824
- Est. tax savings @ 24.0%
- +$1,158
- After-tax cash flow
- $535/yr
For passive investors: Depreciation is non-cash, so a rental often shows a tax loss while cash-flowing — sheltering income. Rental losses are passive: they offset passive income freely, and up to $25,000/yr can offset ordinary (W-2) income if you actively participate and your MAGI is under $100k (phasing out to $0 by $150k); unused losses carry forward. On sale, claimed depreciation is recaptured at up to 25%, and gains may owe capital-gains tax (a 1031 exchange can defer both). Figures are a year-1 estimate at your 24.0% rate — not tax advice; consult a CPA.
Schools (NCES district)
- District
- Richland 01
- NCES district ID
- 4503360
- Math proficiency
- 26% ▼ -7.00%
- Reading proficiency
- 36% ▼ -5.00%
- Median HH income
- $38,931
- Composite
- 25.94/100
- National rank
- #7335
- State rank
- #54 of 80 in SC
Livability — Columbia
- Score
- 78/100
- State rank
- #18
- US rank
- #2436
Category grades
Schools grade is shown separately in the Schools card above.
Census & demographics
- County
- Richland County · 389,530 people
- City population
- 335,994
- Metro
- Columbia, SC
- Population (ZIP)
- 12,538
- Household income
- $60,307
- Rent vs Own
- Severe rent burden
- 236.0
Population outlook (Richland County) Hauer SSP2
- Today (2025)
- 459,667 people
- By 2030
- 487,524 · +6.1%
- By 2040
- 542,035 · +17.9%
- By 2050
- 595,371 · +29.5%
- By 2075
- 732,998 · +59.5%
- By 2100
- 820,415 · +78.5%
Race, ethnicity, and origin ACS 2023
- Neighborhood character
- Predominantly Black (68%)
- Race & ethnicity
- Black 68% White 23% Two or more races 6% Hispanic / Latino 4%
- Common ancestry
- Italian 1% Lithuanian 1% Romanian 1%
- Foreign-born
- 3% · Canada
- Languages at home
- 96% English-only · Spanish 3%
Political lean MEDSL · Richland
- 2024 margin
- Solid D (+34.6) · D 66.4% · R 31.8% · Other 1.8%
- 2008→2024 swing
- +5.7pp toward D · 2008: 28.9pp · 2024: 34.6pp
- All cycles
- 2024: D+34.6 2020: D+38.3 2016: D+32.9 2012: D+33.3 2008: D+28.9
Not yet ingested
- Civics
- —
Market trends
- HPI YoY
- ▼ -57.44%
- Current HPI
- 194.8986
- Rent YoY
- —
- Metro
- Columbia, SC
- State GDP YoY
- ▲ 4.51%
- F500 in state
- 2
Industry mix (Fortune 500 HQ in SC)
| Industry | F500 HQs | Revenue |
|---|---|---|
| Packaging | 1 | $7B |
|
||
Price history
-6.9% since first listed5 events — show timeline
- 2026-06-18 Listed $247,000 Consolidated MLS
- 2022-11-15 Price Changed $235,280 Consolidated MLS
- 2022-10-10 Price Changed $245,280 Consolidated MLS
- 2022-09-30 Price Changed $255,280 Consolidated MLS
- 2022-08-22 Listed $265,280 Consolidated MLS
Cash-flow waterfall
monthlySold comps — $/sqft
last 12 mo · ≤1 miLoading sold comps…