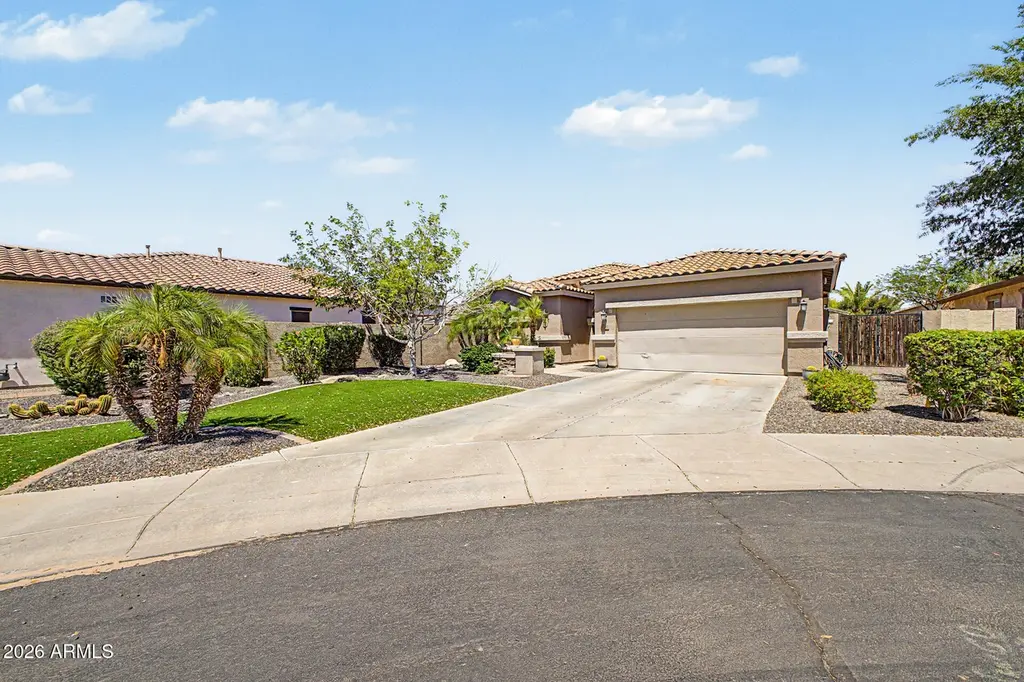
7171 S Sinova Ct · Gilbert, AZ
Flood risk 1/10 · Minimal
- FEMA flood zone
- X (shaded)
- Chance of flooding over 30 yrs
- 0.0%
- Est. flood insurance / yr
- $507 – $1,088
Fire risk 6/10 · Moderate
- Est. fire insurance / yr
- $610 – $1,132
Heat risk 9/10 · Severe
- Hot days now (above 111°F)
- 7 days/yr
- Hot days in 30 yrs
- 19 days/yr
Wind risk 1/10 · Minimal
- Chance of severe wind over 30 yrs
- —
Air-quality risk 2/10 · Minimal
- Unhealthy air days now
- 0 days/yr
- Unhealthy air days in 30 yrs
- 1 days/yr
Risk factors via First Street. Map © Google.
Why this score? — see what drove the D grade
The composite is a weighted blend of 9 inputs, each scored 0–100. Each bar is that input's sub-score; the figure is the points it added to the 100-point composite (weight × sub-score).
- ARV discount +10.7/15.0
- Appreciation +9.2/10.0
- Cash flow +7.1/30.0
- Schools +4.8/10.0
- Livability +4.4/5.0
- Rent growth +3.6/5.0
- Condition / age +2.5/5.0
- DSCR +1.3/10.0
- 1% rule +1.2/10.0
$499,900
🖨 Deal sheet (PDF) 📄 Offer letter ✓ Due diligence
Listing remarks
Opportunity knocks in Seville! Priced Below Market Value for a Quick Cash As-Is Sale This 4-bedroom, 2-bathroom home features a desirable split floor plan, granite countertops, and a spacious layout ready for its next owner. The kitchen opens to the main living areas, creating a functional space for everyday living and entertaining. Step outside to a generously sized backyard complete with a sparkling pool and plenty of room to relax, play, or create your dream outdoor retreat. The split-bedroom design offers privacy for the primary suite while keeping the secondary bedrooms separate. Priced to sell and offering an incredible value in one of Gilbert's most sought-after communities, this hom
Key facts
- Highly rated schools
- Split floor plan
- Granite countertops
Tags
Property features AI
Finance
- Financial info: Conventional financing available
- HOA & community: Homeowner association with semi-annual fee; Association fee includes grounds maintenance; Community amenities: golf, community media room, tennis courts, playground, biking/walking paths, fitness center
Exterior
- Parking: 2 covered parking spaces; 2 open parking spaces; RV gate; 2-car garage
- Utilities: City water; Public sewer
- Home design: Single family residence; Fee simple ownership
- Construction: Stucco and painted wood frame construction; Tile roof
- Exterior features: Private pool; Desert front and back landscaping; Block fencing
Interior
- Kitchen: Built-in microwave; Dishwasher; Disposal; Kitchen island; Pantry; Breakfast bar
- Bedrooms: Up to 4 bedrooms
- Flooring: Carpet; Tile
- Bathrooms: 2 full bathrooms
- Heating & cooling: Natural gas heating; Central air; Programmable thermostat
- Interior features: Granite counters; Double vanity; Eat-in kitchen; Breakfast bar; Kitchen island; Pantry; Separate shower and tub
- Laundry & utility: Indoor laundry
Neighborhood map
What this means for you Summary
Snapshot
- This is a 4-bed/3.0-bath single-family listed at $500k.
Deal economics
- At list price, monthly cash flow is $-703 ($-8k/yr) — negative.
- To cash-flow at today's rent, offer at most $376k (24.8% below list).
- To meet the 1% rule (rent ≥ 1% of price), the offer needs to be $308k (38.3% below list).
- Recommended offer: $308k (38.3% below list) — sets the bar for 1% rule.
- Cap rate 4.6% vs local median 3.2% in Gilbert — top-decile yield for the area; either an underpriced asset or a hidden risk that comps aren't pricing in. Stress-test before assuming the spread holds.
Location & tenants
- Location reads 87/100 on livability (#1 in AZ, #240 nationally) — a professional / high-income tenant draw. Strengths: amenities A+, employment A+, housing A+; Watch: health & safety C-, cost of living F.
- Chandler Unified District #80 (4242) (suburban): math 49% / reading 57% proficiency, ranked #31 of 249 in AZ (top 12%) — acceptable for families but not a draw, mixed tenant base, ~2y average lease.
- Zoned schools: Riggs Elementary (math 56% / reading 63%, grade B-, #148 of 1,109 statewide, top 15%, 833 students, 12% FRL); Arizona College Prep Middle School (math 88% / reading 87%, grade A+, #1 of 218 statewide, top 0%, 744 students, 4% FRL); Dr. Camille Casteel High School (math 45% / reading 53%, grade D, #43 of 381 statewide, top 11%, 3,140 students, 12% FRL) — zoned schools average 9% FRL vs 25% district-wide (16 pts lower); this property's tenant base skews higher-income than the district average.
- Zoned-school proficiency averages 65% at this address vs 53% district-wide (+12 pts) — the actual schools serving this property are materially stronger than the Chandler Unified District #80 (4242) average implies; a family-tenant draw the district grade alone would hide.
- Market conditions: Rents rising fast (+4.3%/yr); 340 active listings in the ZIP; 27 comparable units currently listed for rent nearby; rentals at typical pace (median 17d on market — plan ~3-4 weeks tenant-placement turnaround); high-income renter base; 36,011 units permitted in Maricopa County in 2024 (12,801 in 5+ unit buildings).
Forward outlook
- In year one you build about $45k of equity ($3k loan paydown + $42k appreciation (8.4% local appreciation)).
- Maricopa County population projected at +38% by 2050 — long-run rental-demand tailwind backs the buy-and-hold thesis.
- By year 2, paydown + projected appreciation supports a ~$73k cash-out refi (75% LTV) — recoverable capital for the next deal without selling this one.
Negotiation context
- It's been on market 18 days — a 2% lower offer ($492k) is reasonable based on typical stale-listing flexibility.
Risks & watch-outs
- Climate carrying-cost: major wildfire risk; extreme-heat days projected 7→19/yr by 2055 (HVAC capex compounding) — expect insurance premiums to compound above CPI over the hold.
Questions for the listing agent
- What do current leases actually rent for vs. the listed asking? Can we see a recent rent roll and the last 12 months of T-12 income?
- What does the HOA fee cover, when was the last increase, and are there any pending special assessments or reserve-fund shortfalls?
- Is there a deadline driving the sale (1031 exchange, divorce, estate, relocation)? That informs how much negotiation room exists.
- Schools are A-rated — typically a magnet for longer-tenancy family renters. What's the average tenant stay here, and is there a school-zone premium baked into asking?
- The area grade is low — what's the realistic commute time and amenity access for the typical tenant pool here? Any planned neighborhood developments (good or bad) we should know about?
- What's the average days-on-market for RENTAL listings here right now (not sales)? A rising rental-DOM trend means longer vacancies and softer asking-rent achievability than the comps imply.
- What's the recent tenant-quality profile in this submarket — average credit score on applications, eviction rate, late-payment / NSF rate, and stable-employment percentage? A property-management company in the area should have these aggregated.
- How much new for-sale + rental construction is in the pipeline within 1–3 miles? Heavy new supply typically softens prices + rents 12–24 months out; constrained supply supports both.
Investment metrics
- 1% rule
- 0.62% ✗
- Cap rate
- 4.61%
- Cash-on-cash
- -6.02%
- DSCR
- 0.73
- GRM
- 13.5
CMA / ARV
- ARV (on-the-fly)
- $538,608
- Comps found
- 12
Show comp detail 12 sales within ~0.75 mi
| Address | Dist | Beds/Ba | Sqft | Sold | Price | $/sf | Match |
|---|---|---|---|---|---|---|---|
| 3504 E Ravenswood Dr | 0.16mi | 3/2.0 (-1) | 1,777 (-3%) | 2mo | $575,000 | $324 | 77 |
| 3554 E Ravenswood Dr | 0.23mi | 3/2.0 (-1) | 1,777 (-3%) | 1mo | $571,500 | $322 | 75 |
| 3499 E Lafayette Ave | 0.19mi | 3/2.0 (-1) | 1,750 (-4%) | 1mo | $515,000 | $294 | 74 |
| 3541 E Ravenswood Dr | 0.21mi | 3/2.0 (-1) | 1,777 (-3%) | 4mo | $535,000 | $301 | 73 |
| 7137 S Fawn Ave | 0.26mi | 4/2.5 | 2,039 (+11%) | 4mo | $590,000 | $289 | 64 |
| 6710 S Seton Ave | 0.61mi | 3/2.0 (-1) | 1,750 (-4%) | 2mo | $499,900 | $286 | 54 |
| 6746 S Goldfinch Dr | 0.54mi | 3/2.0 (-1) | 1,750 (-4%) | 7mo | $575,000 | $329 | 53 |
| 17244 E Chestnut Dr | 0.71mi | 3/2.0 (-1) | 1,914 (+4%) | 6mo | $785,000 | $410 | 45 |
| 3006 E Muirfield St | 0.60mi | 4/2.0 | 2,081 (+14%) | 1mo | $500,000 | $240 | 45 |
| 3295 E Castanets Dr | 0.64mi | 4/2.0 | 2,064 (+13%) | 4mo | $560,000 | $271 | 42 |
| 7048 S View Ln | 0.52mi | 3/2.0 (-1) | 2,064 (+13%) | 5mo | $585,000 | $283 | 41 |
| 3266 E Sports Dr | 0.71mi | 3/2.5 (-1) | 1,675 (-9%) | 6mo | $430,000 | $257 | 41 |
Match score weights: distance 35% · size 25% · config 20% · recency 20%. Top-matched comps best support the ARV.
Projected returns pro-forma
8.36% appreciation · 4.31% rent growth · sell at horizon
- IRR
- 16.6%
- Equity multiple
- 2.26×
- Total profit
- $176,810
- Equity at exit
- $392,196
- IRR
- 16.2%
- Equity multiple
- 4.97×
- Total profit
- $555,658
- Equity at exit
- $790,648
Cash invested: $139,972 (down + closing). Projections, not guarantees.
Landlord ↔ Tenant lean methodology
- Overall (STATE)
- 87 Strongly Landlord-Friendly
- State Arizona
- 87 Strongly Landlord-Friendly · R+3
- County
- — inherits STATE
- City
- — inherits STATE
ZIP-level market 85298
- Home prices YoY
- 2.5%
- Rents YoY
- 4.3%
- Active inventory
- 340
- Price-to-rent
- 13.5×
Monthly cashflow live
- Estimated rent
- $3,084 high interval (Pro) →
- Mortgage (P&I)
- −$2,622
- Tax from tax record
- −$207 /mo · $2,480/yr
- Insurance
- −$208
- HOA
- −$103
- Vacancy / Maint / Mgmt
- −$648
- Net cashflow
- $-703
Break-even live
Sensitivity live
| Price | -10% $-420 | -5% $-561 | +0% $-703 | +5% $-844 | +10% $-986 |
|---|---|---|---|---|---|
| Rent | -10% $-946 | -5% $-825 | +0% $-703 | +5% $-581 | +10% $-459 |
| Rate | -1.0pp $-451 | -0.5pp $-576 | base $-703 | +0.5pp $-832 | +1.0pp $-964 |
UW: 25.0% down · 7.5% · 30yr · 1.5% tax · 5.0% vac · 8.0% maint · 8.0% mgmt
Financing live
Cash to close
- Down payment
- $124,975
- Closing costs
- $14,997
- Reserves months
- —
- Total cash needed
- —
Loan-product check · same deal, 3 products live
Conventional
25% down · 7.5% · 30yr
- Down + closing
- —
- Monthly P&I
- —
- Monthly cashflow
- —
- DSCR
- —
- Eligible?
- —
Personal DTI + credit; lowest rate.
DSCR
20% down · 8.5% · 30yr
- Down + closing
- —
- Monthly P&I
- —
- Monthly cashflow
- —
- DSCR
- —
- Eligible?
- —
No personal income docs; deal must DSCR.
Hard money
10% down · 12.0% · 12mo
- Down + closing
- —
- Monthly P&I
- —
- Monthly cashflow
- —
- DSCR
- —
- Eligible?
- —
Short-term bridge; refi at stabilization.
Rent comps 27 comps
| Address | Beds | Baths | Sqft | Rent | $/sqft | DOM | Units | Dist |
|---|---|---|---|---|---|---|---|---|
| 3560 E Merlot St Gilbert, AZ | 3.0 | 2.0 | 1777 | $4,750 | $2.67 | 45d | 1 | 0.26mi |
| 3147 E Vallejo Dr Gilbert, AZ | 3.0 | 2.0 | 2171 | $2,350 | $1.08 | 18d | 1 | 0.35mi |
| 3068 E Ravenswood Dr Gilbert, AZ | 4.0 | 2.0 | 1815 | $2,550 | $1.40 | 14d | 1 | 0.37mi |
| 3068 E Ravenswood Dr Gilbert, AZ | 4.0 | 2.0 | 1815 | $2,550 | $1.40 | 1d | 1 | 0.37mi |
| 3443 E Riopelle Ave Gilbert, AZ | 3.0 | 2.0 | 1284 | $2,350 | $1.83 | 45d | 1 | 0.45mi |
| 6943 S View Ln Gilbert, AZ | 4.0 | 3.0 | 2586 | $2,445 | $0.95 | 7d | 1 | 0.61mi |
| 6770 S Tucana Ln Gilbert, AZ | 3.0 | 2.0 | 2070 | $4,500 | $2.17 | 26d | 1 | 0.68mi |
| 3067 E Palmdale Ln Gilbert, AZ | 3.0 | 2.0 | 1675 | $2,300 | $1.37 | 17d | 1 | 0.79mi |
| 2723 E Mews Rd Gilbert, AZ | 3.0 | 2.0 | 1759 | $2,395 | $1.36 | 4d | 1 | 0.87mi |
| 2723 E Mews Rd Gilbert, AZ | 3.0 | 2.0 | 1759 | $2,495 | $1.42 | 20d | 1 | 0.87mi |
| 3725 E Meadowview Dr Gilbert, AZ | 3.0 | 2.0 | 1404 | $2,750 | $1.96 | 26d | 1 | 0.90mi |
| 3570 E Meadowview Dr Gilbert, AZ | 4.0 | 3.0 | 2536 | $3,200 | $1.26 | 4d | 1 | 0.91mi |
| 2971 E Ridgewood Ln Gilbert, AZ | 3.0 | 2.0 | 1675 | $2,380 | $1.42 | 45d | 1 | 0.92mi |
| 4155 E Clubview Dr Gilbert, AZ | 4.0 | 2.0 | 2064 | $2,600 | $1.26 | 6d | 1 | 1.03mi |
| 3808 E Flower Ct Gilbert, AZ | 3.0 | 2.5 | 1628 | $2,095 | $1.29 | 7d | 1 | 1.13mi |
| 3329 E Powell Ct Gilbert, AZ | 3.0 | 2.0 | 1486 | $2,345 | $1.58 | 17d | 1 | 1.17mi |
| 3462 E Powell Way Gilbert, AZ | 3.0 | 2.0 | 1665 | $2,295 | $1.38 | 26d | 1 | 1.20mi |
| 6334 S Blake St Gilbert, AZ | 3.0 | 2.0 | 1421 | $2,100 | $1.48 | 45d | 1 | 1.22mi |
| 6851 S Birdie Way Gilbert, AZ | 4.0 | 3.0 | 2591 | $2,995 | $1.16 | 7d | 1 | 1.24mi |
| 3868 E Palmer St Gilbert, AZ | 3.0 | 2.5 | 1899 | $2,000 | $1.05 | 45d | 1 | 1.24mi |
| 6659 S Cartier Dr Gilbert, AZ | 3.0 | 2.0 | 1665 | $2,300 | $1.38 | 20d | 1 | 1.29mi |
| 6687 S Classic Way Gilbert, AZ | 3.0 | 2.0 | 2173 | $4,300 | $1.98 | 3d | 1 | 1.33mi |
| 3486 E Anika Ct Gilbert, AZ | 4.0 | 2.0 | 1749 | $2,600 | $1.49 | 45d | 1 | 1.41mi |
| 2965 E Blue Ridge Way Gilbert, AZ | 4.0 | 2.0 | 1651 | $2,400 | $1.45 | 1d | 1 | 1.43mi |
| 2304 E Kelly Dr Gilbert, AZ | 4.0 | 2.0 | 1797 | $2,400 | $1.34 | 1d | 1 | 1.48mi |
| 2304 E Kelly Dr Gilbert, AZ | 4.0 | 2.0 | 1797 | $2,400 | $1.34 | 14d | 1 | 1.48mi |
| 2927 E Mead Dr Gilbert, AZ | 4.0 | 2.0 | 1651 | $2,250 | $1.36 | 20d | 1 | 1.48mi |
HOA detail
- Monthly dues
- $103 · $1,236/yr
- Likely covers
- pool
Listing history 12 events
-
2026-06-21days on market $499,900 Active 18 DOM
-
2026-06-18days on market $499,900 Active 15 DOM
-
2026-06-17days on market $499,900 Active 14 DOM
-
2026-06-16days on market $499,900 Active 13 DOM
-
2026-06-15days on market $499,900 Active 12 DOM
-
2026-06-13days on market $499,900 Active 10 DOM
-
2026-06-13days on market $499,900 Active 9 DOM
-
2026-06-09days on market $499,900 Active 6 DOM
-
2026-06-08days on market $499,900 Active 5 DOM
-
2026-06-07days on market $499,900 Active 4 DOM
-
2026-06-04remarks 699-char remark
-
2026-06-04$499,900 Active 1 DOM
ⓘ Source: listings_history table (triggers on properties + properties_extension) + one-shot
backfill from property_details.listing_events for pre-trigger history.
Tax reassessment forecast AZ · Resets to sale price
- Current annual tax
- $2,480 · $207/mo
- Projected year-2 tax
- $3,299 · $275/mo
- Expected delta
- +$820/yr (+$68/mo · 33.1%)
ⓘ Screening estimate from a state-policy table — verify with the county assessor before closing.
Climate risk First Street
- Flood 1/10 Low FEMA zone X (shaded) · 0% chance over 30 yrs
- Wildfire 6/10 Major
- Heat 9/10 Extreme 7 d/yr ≥111°F today · 19 d/yr by 30 yrs out
- Wind 1/10 Low
- Air quality 2/10 Low 0 unhealthy d/yr today · 1 by 30 yrs out
Nearby sold comps map
Loading sold comps map…
Walkable amenities ~0.75 mi
Loading nearby amenities…
Taxation est. · year 1
- Rental income
- $37,014
- − Mortgage interest
- −$28,002
- − Property taxes
- −$2,480
- − Insurance
- −$2,500
- − Repairs & maintenance
- −$2,961
- − Management
- −$2,961
- − HOA
- −$1,236
- − Depreciation
- −$14,543
- Taxable loss
- −$17,668
- Est. tax savings @ 24.0%
- +$4,240
- After-tax cash flow
- $-4,192/yr
For passive investors: Depreciation is non-cash, so a rental often shows a tax loss while cash-flowing — sheltering income. Rental losses are passive: they offset passive income freely, and up to $25,000/yr can offset ordinary (W-2) income if you actively participate and your MAGI is under $100k (phasing out to $0 by $150k); unused losses carry forward. On sale, claimed depreciation is recaptured at up to 25%, and gains may owe capital-gains tax (a 1031 exchange can defer both). Figures are a year-1 estimate at your 24.0% rate — not tax advice; consult a CPA.
Schools (NCES district)
- District
- Chandler Unified District #80 (4242)
- NCES district ID
- 0401870
- Math proficiency
- 49% ▼ -8.00%
- Reading proficiency
- 57% ▼ -2.00%
- Median HH income
- $74,048
- Composite
- 47.54/100
- National rank
- #2268
- State rank
- #31 of 249 in AZ
Livability — Gilbert
- Score
- 87/100
- State rank
- #1
- US rank
- #240
Category grades
Schools grade is shown separately in the Schools card above.
Census & demographics
- Census place
- Gilbert, AZ
- County
- Maricopa County · 4,537,380 people
- City population
- 281,769
- Metro
- Phoenix-Mesa-Chandler, AZ
- Population (ZIP)
- 44,114
- Household income
- $156,425
- Rent vs Own
- Severe rent burden
- 173.0
Population outlook (Maricopa County) Hauer SSP2
- Today (2025)
- 4,979,203 people
- By 2030
- 5,378,229 · +8.0%
- By 2040
- 6,156,598 · +23.6%
- By 2050
- 6,872,376 · +38.0%
- By 2075
- 8,401,270 · +68.7%
- By 2100
- 9,247,439 · +85.7%
Race, ethnicity, and origin ACS 2023
- Neighborhood character
- Predominantly White (72%)
- Race & ethnicity
- White 72% Hispanic / Latino 14% Two or more races 11% Asian 7% Black 2%
- Hispanic origin (detail)
- Mexican 10%
- Common ancestry
- Italian 4% Romanian 3% Lithuanian 3%
- Foreign-born
- 9% · Canada, China, Vietnam
- Languages at home
- 85% English-only · Spanish 7% Other Indo-European 2% Chinese 1%
Political lean MEDSL · Maricopa
- 2024 margin
- Toss-up / Even · D 47.7% · R 51.2% · Other 1.1%
- 2008→2024 swing
- +7.1pp toward D · 2008: -10.6pp · 2024: -3.5pp
- All cycles
- 2024: R+3.5 2020: D+2.2 2016: R+3.5 2012: R+12.0 2008: R+10.6
Not yet ingested
- Civics
- —
Market trends
- HPI YoY
- ▲ 8.36%
- Current HPI
- 343.6932
- Rent YoY
- ▲ 4.31%
- Metro
- Phoenix-Mesa-Chandler, AZ
- State GDP YoY
- ▲ 4.54%
- F500 in state
- 20
Industry mix (Fortune 500 HQ in AZ)
| Industry | F500 HQs | Revenue |
|---|---|---|
| Technology | 2 | $13B |
|
||
| Mining / Metals | 1 | $23B |
|
||
| Environmental Services | 1 | $16B |
|
||
| Metals / Steel | 1 | $14B |
|
||
| Technology Distribution | 1 | $9B |
|
||
| Homebuilding | 1 | $8B |
|
||
Price history
1 event — show timeline
- 2026-06-03 Listed $499,900 ARMLS
Property tax history
+8.3%/yrLatest (2025): $2,480 · +1.0% YoY. Source: county tax records.
Cash-flow waterfall
monthlySold comps — $/sqft
last 12 mo · ≤1 miLoading sold comps…