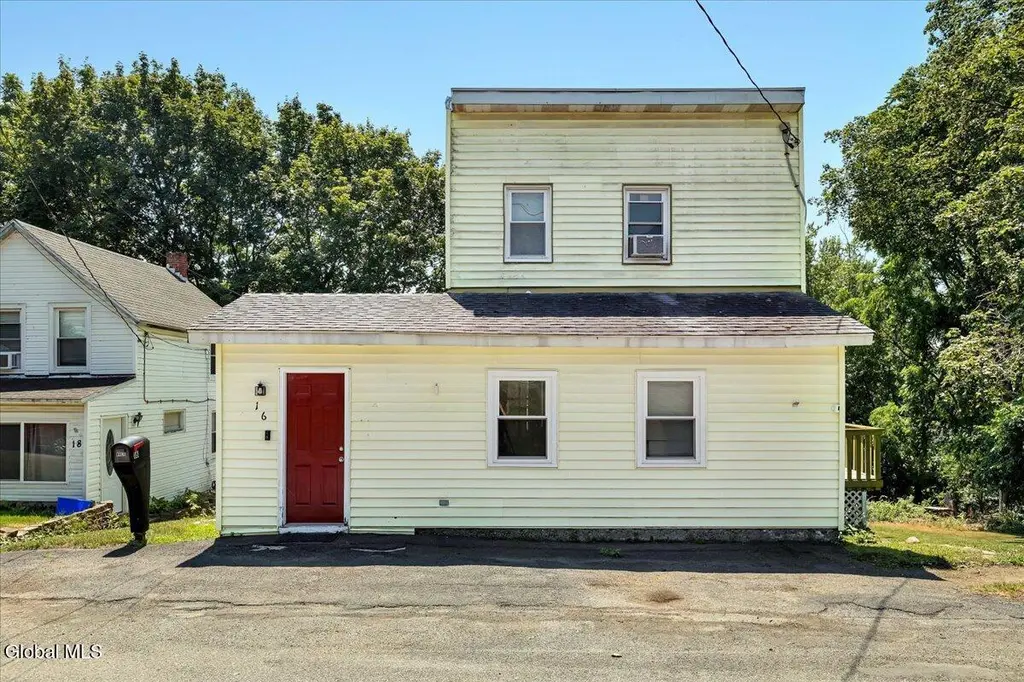
16 Billings Ave · Troy, NY
Flood risk 1/10 · Minimal
- FEMA flood zone
- X
- Chance of flooding over 30 yrs
- 0.0%
- Est. flood insurance / yr
- $473 – $860
Fire risk 3/10 · Minor
- Est. fire insurance / yr
- $691 – $1,283
Heat risk 3/10 · Minor
- Hot days now (above 96°F)
- 7 days/yr
- Hot days in 30 yrs
- 16 days/yr
Wind risk 3/10 · Minor
- Chance of severe wind over 30 yrs
- 6.0%
Air-quality risk 2/10 · Minimal
- Unhealthy air days now
- 0 days/yr
- Unhealthy air days in 30 yrs
- 1 days/yr
Risk factors via First Street. Map © Google.
Why this score? — see what drove the D+ grade
The composite is a weighted blend of 9 inputs, each scored 0–100. Each bar is that input's sub-score; the figure is the points it added to the 100-point composite (weight × sub-score).
- ARV discount +15.0/15.0
- Cash flow +11.4/30.0
- Livability +4.0/5.0
- 1% rule +3.9/10.0
- Schools +3.8/10.0
- Rent growth +3.7/5.0
- DSCR +3.3/10.0
- Condition / age +2.5/5.0
- Appreciation +0.0/10.0
$189,900
🖨 Deal sheet 📄 Offer letter ✓ Due diligence
Listing remarks MLS
A hidden gem on Troy's east side! 16 Billings Ave. is a short distance from all that Main St. has to offer. Located inside the city of Troy, this home has a remarkable amount of space for outdoor entertainment, with a walkout basement, private back yard, and a nice-sized deck. Inside, the open floor plan makes for an ideal and efficient layout and is now complete with brand-new Pergo floors throughout.
Key facts
- Walkout basement
- Open floor plan
- Private back yard
Tags
Neighborhood map
What this means for you Summary
Snapshot
- This is a 2-bed/1.0-bath single-family listed at $190k.
Deal economics
- At list price, monthly cash flow is $-67 ($-806/yr) — negative.
- To cash-flow at today's rent, offer at most $178k (6.2% below list).
- To meet the 1% rule (rent ≥ 1% of price), the offer needs to be $170k (10.6% below list).
- Recommended offer: $167k (12.0% below list) — sets the bar for market timing.
Location & tenants
- Location reads 81/100 on livability (#88 in NY, #1,350 nationally) — a professional / high-income tenant draw. Strengths: amenities A+, commute A+, housing A+; Watch: schools C-, employment C-, crime F.
- Troy City School District (urban): math 44% / reading 46% proficiency, ranked #467 of 590 in NY (top 79%) — families likely to look elsewhere, expect single-tenant / working-renter base with shorter leases; 62% free/reduced lunch — lower-income household profile, screen leases tightly.
- Market conditions: Rents rising fast (+4.9%/yr); 220 active listings in the ZIP; 7 comparable units currently listed for rent nearby; rentals at typical pace (median 24d on market — plan ~3-4 weeks tenant-placement turnaround); solid renter incomes; 405 units permitted in Rensselaer County in 2024 (224 in 5+ unit buildings).
Forward outlook
- Local home prices are declining (-3.0%/yr); year-one equity from $1k of loan paydown is wiped out by about $6k of value loss. Plan a longer hold.
- Rensselaer County population projected to shrink 6% by 2050 — rents likely to lag national; underwrite the cash flow, not the appreciation.
Negotiation context
- It's been on market 133 days — a 12% lower offer ($167k) is reasonable based on typical stale-listing flexibility.
- 7 sale attempts since 9y ago; this cycle's ask has dropped $25k (12%) from the opening price — seller is motivated, your offer sets the floor, not the list.
- Current owner paid $90k; list at $190k implies a 110% gain — meaningful room to come down on a strong offer.
Risks & watch-outs
- Watch-outs: built in 1860 — expect roof / HVAC / electrical / plumbing capex.
Questions for the listing agent
- What do current leases actually rent for vs. the listed asking? Can we see a recent rent roll and the last 12 months of T-12 income?
- It's been on market 133 days. Have you received any prior offers? Is the seller open to a 12% concession, seller financing, or rate buy-down credit?
- Built in 1860 — when were the roof, HVAC, electrical panel, plumbing, and water heater last replaced?
- Why hasn't it sold? Are there any deal-killer items the seller is aware of (foundation, flood, title, zoning, code violations)?
- Is there a deadline driving the sale (1031 exchange, divorce, estate, relocation)? That informs how much negotiation room exists.
- Crime grade is F in this area — have there been break-ins, vandalism, or insurance claims at this property in the last 3 years? What carrier currently insures it and at what premium?
- The area grade is low — what's the realistic commute time and amenity access for the typical tenant pool here? Any planned neighborhood developments (good or bad) we should know about?
- What's the average days-on-market for RENTAL listings here right now (not sales)? A rising rental-DOM trend means longer vacancies and softer asking-rent achievability than the comps imply.
- What's the recent tenant-quality profile in this submarket — average credit score on applications, eviction rate, late-payment / NSF rate, and stable-employment percentage? A property-management company in the area should have these aggregated.
- How much new for-sale + rental construction is in the pipeline within 1–3 miles? Heavy new supply typically softens prices + rents 12–24 months out; constrained supply supports both.
Investment metrics
- 1% rule
- 0.89% ✗
- Cap rate
- 5.87%
- Cash-on-cash
- -1.52%
- DSCR
- 0.93
- GRM
- 9.3
CMA / ARV
- ARV (median comp)
- $254,945
- List price
- $189,900
- Delta
- -25.51%
- Verdict
- UNDERPRICED
- Comps
- 20 within 1.0 mi
Show comp detail 12 sales within ~0.75 mi
| Address | Dist | Beds/Ba | Sqft | Sold | Price | $/sf | Match |
|---|---|---|---|---|---|---|---|
| 10 Jesse Ct | 0.19mi | 2/1.0 | 1,181 (+7%) | 2mo | $256,000 | $217 | 78 |
| 5 Tower Ave | 0.16mi | 3/1.5 (+1) | 1,165 (+6%) | 0mo | $253,700 | $218 | 76 |
| 4 Plum Ave | 0.21mi | 3/1.0 (+1) | 1,009 (-9%) | 2mo | $215,000 | $213 | 69 |
| 19 Parkview Ct | 0.41mi | 3/1.0 (+1) | 1,081 (-2%) | 9mo | $270,000 | $250 | 65 |
| 42 Central Ave | 0.58mi | 3/1.5 (+1) | 1,105 (+0%) | 6mo | $282,500 | $256 | 61 |
| 12 Parkview Ct | 0.44mi | 3/1.0 (+1) | 1,176 (+6%) | 3mo | $235,000 | $200 | 61 |
| 37 Hamilton Ave | 0.34mi | 3/1.5 (+1) | 1,200 (+9%) | 2mo | $328,000 | $273 | 61 |
| 67 Cameron Rd | 0.47mi | 2/2.0 | 1,154 (+4%) | 7mo | $280,000 | $243 | 60 |
| 11 Packer Ave | 0.31mi | 3/1.0 (+1) | 1,212 (+10%) | 9mo | $270,000 | $223 | 57 |
| 14 Parkview Ct | 0.44mi | 3/1.0 (+1) | 1,215 (+10%) | 2mo | $252,000 | $207 | 56 |
| 34 Central Ave | 0.49mi | 3/1.5 (+1) | 1,200 (+9%) | 6mo | $240,000 | $200 | 50 |
| 2 Miller Ave | 0.48mi | 3/1.0 (+1) | 1,248 (+13%) | 7mo | $105,000 | $84 | 45 |
Match score weights: distance 35% · size 25% · config 20% · recency 20%. Top-matched comps best support the ARV.
Projected returns pro-forma
-3.0% appreciation · 4.88% rent growth · sell at horizon
- IRR
- -16.5%
- Equity multiple
- 0.40×
- Total profit
- $-31,691
- Equity at exit
- $28,315
- IRR
- -5.0%
- Equity multiple
- 0.65×
- Total profit
- $-18,804
- Equity at exit
- $16,419
Cash invested: $53,172 (down + closing). Projections, not guarantees.
Landlord ↔ Tenant lean methodology
- Overall (STATE)
- 15 Strongly Tenant-Friendly
- State New York
- 15 Strongly Tenant-Friendly · D+10
- County
- — inherits STATE
- City
- — inherits STATE
ZIP-level market 12180
- Home prices YoY
- -33.3%
- Rents YoY
- 4.9%
- Active inventory
- 220
- Price-to-rent
- 9.3×
Monthly cashflow live
- Estimated rent
- $1,698 high interval (Pro) →
- Mortgage (P&I)
- −$996
- Tax from tax record
- −$334 /mo · $4,004/yr
- Insurance
- −$79
- HOA
- −$0
- Vacancy / Maint / Mgmt
- −$357
- Net cashflow
- $-67
Break-even live
UW: 25.0% down · 7.5% · 30yr · 1.5% tax · 5.0% vac · 8.0% maint · 8.0% mgmt
Financing live
Cash to close
- Down payment
- $47,475
- Closing costs
- $5,697
- Reserves months
- —
- Total cash needed
- —
Loan-product check · same deal, 3 products live
Conventional
25% down · 7.5% · 30yr
- Down + closing
- —
- Monthly P&I
- —
- Monthly cashflow
- —
- DSCR
- —
- Eligible?
- —
Personal DTI + credit; lowest rate.
DSCR
20% down · 8.5% · 30yr
- Down + closing
- —
- Monthly P&I
- —
- Monthly cashflow
- —
- DSCR
- —
- Eligible?
- —
No personal income docs; deal must DSCR.
Hard money
10% down · 12.0% · 12mo
- Down + closing
- —
- Monthly P&I
- —
- Monthly cashflow
- —
- DSCR
- —
- Eligible?
- —
Short-term bridge; refi at stabilization.
Rent comps 7 comps
| Address | Beds | Baths | Sqft | Rent | $/sqft | DOM | Units | Dist |
|---|---|---|---|---|---|---|---|---|
| 499 Pawling Ave Unit 3 Troy, NY | 3.0 | 1.0 | 800 | $2,000 | $2.50 | 21d | 1 | 0.48mi |
| 102 Main Ave Wynantskill, NY | 3.0 | 1.0 | 1316 | $1,600 | $1.22 | 44d | 1 | 0.71mi |
| 110 Colleen Rd Troy, NY | 1.0–2.0 | 1.0 | 955 | $1,550 | $1.62 | 14d | 9 | 0.97mi |
| 136 Maple Ave Unit 2 Troy, NY | 2.0 | 1.0 | 1155 | $2,000 | $1.73 | 43d | 1 | 1.01mi |
| 198 Pawling Ave Troy, NY | 2.0 | 1.0 | 700 | $1,650 | $2.36 | 23d | 1 | 1.20mi |
| 110 Project Rd Unit 1 Troy, NY | 2.0 | 1.0 | 1000 | $1,300 | $1.30 | 23d | 1 | 1.30mi |
| 823 Hampton Place Blvd Troy, NY | 2.0 | 2.0 | 1100 | $2,200 | $2.00 | 14d | 1 | 1.49mi |
Listing history 42 events
-
2026-06-18days on market $189,900 Active 133 DOM
-
2026-06-17days on market $189,900 Active 132 DOM
-
2026-06-16days on market $189,900 Active 131 DOM
-
2026-06-15days on market $189,900 Active 130 DOM
-
2026-06-14days on market $189,900 Active 128 DOM
-
2026-06-13days on market $189,900 Active 127 DOM
-
2026-06-10days on market $189,900 Active 125 DOM
-
2026-06-09days on market $189,900 Active 124 DOM
-
2026-06-08days on market $189,900 Active 123 DOM
-
2026-06-07days on market $189,900 Active 122 DOM
-
2026-06-03days on market $189,900 Active 118 DOM
-
2026-06-02days on market $189,900 Active 117 DOM
-
2026-06-01pricedays on market $189,900 Active 116 DOM
-
2026-05-31days on market $195,000 Active 115 DOM
-
2026-05-31days on market $195,000 Active 114 DOM
-
2026-05-15price $195,000 405-char remark
Show marketing remark (405 chars)
A hidden gem on Troy's east side! 16 Billings Ave. is a short distance from all that Main St. has to offer. Located inside the city of Troy, this home has a remarkable amount of space for outdoor entertainment, with a walkout basement, private back yard, and a nice-sized deck. Inside, the open floor plan makes for an ideal and efficient layout and is now complete with brand-new Pergo floors throughout.
-
2026-04-27status Active 405-char remark
Show marketing remark (405 chars)
A hidden gem on Troy's east side! 16 Billings Ave. is a short distance from all that Main St. has to offer. Located inside the city of Troy, this home has a remarkable amount of space for outdoor entertainment, with a walkout basement, private back yard, and a nice-sized deck. Inside, the open floor plan makes for an ideal and efficient layout and is now complete with brand-new Pergo floors throughout.
-
2026-04-24status Pending 405-char remark
Show marketing remark (405 chars)
A hidden gem on Troy's east side! 16 Billings Ave. is a short distance from all that Main St. has to offer. Located inside the city of Troy, this home has a remarkable amount of space for outdoor entertainment, with a walkout basement, private back yard, and a nice-sized deck. Inside, the open floor plan makes for an ideal and efficient layout and is now complete with brand-new Pergo floors throughout.
-
2026-04-07price $199,000 405-char remark
Show marketing remark (405 chars)
A hidden gem on Troy's east side! 16 Billings Ave. is a short distance from all that Main St. has to offer. Located inside the city of Troy, this home has a remarkable amount of space for outdoor entertainment, with a walkout basement, private back yard, and a nice-sized deck. Inside, the open floor plan makes for an ideal and efficient layout and is now complete with brand-new Pergo floors throughout.
-
2026-03-28price $205,000 405-char remark
Show marketing remark (405 chars)
A hidden gem on Troy's east side! 16 Billings Ave. is a short distance from all that Main St. has to offer. Located inside the city of Troy, this home has a remarkable amount of space for outdoor entertainment, with a walkout basement, private back yard, and a nice-sized deck. Inside, the open floor plan makes for an ideal and efficient layout and is now complete with brand-new Pergo floors throughout.
-
2026-02-25price $210,000 405-char remark
Show marketing remark (405 chars)
A hidden gem on Troy's east side! 16 Billings Ave. is a short distance from all that Main St. has to offer. Located inside the city of Troy, this home has a remarkable amount of space for outdoor entertainment, with a walkout basement, private back yard, and a nice-sized deck. Inside, the open floor plan makes for an ideal and efficient layout and is now complete with brand-new Pergo floors throughout.
-
2026-02-02$215,000 Active 405-char remark
Show marketing remark (405 chars)
A hidden gem on Troy's east side! 16 Billings Ave. is a short distance from all that Main St. has to offer. Located inside the city of Troy, this home has a remarkable amount of space for outdoor entertainment, with a walkout basement, private back yard, and a nice-sized deck. Inside, the open floor plan makes for an ideal and efficient layout and is now complete with brand-new Pergo floors throughout.
-
2025-11-14historical
-
2025-07-17$199,000 Active
-
2025-06-29historical
-
2025-06-28price $219,500
-
2025-06-17price $229,000
-
2025-06-09price $240,000
-
2025-06-02price $245,000
-
2025-05-27$248,500 Active
-
2022-08-30historical
-
2022-08-02price $165,000
-
2022-07-20price $175,000
-
2022-07-15$175,500 Active
-
2022-07-07historical
-
2022-04-21status Pending
-
2022-04-04$150,000 Active
-
2018-03-20soldstatus $90,300
-
2018-03-09soldstatus $90,300 Closed (Final Sale)
-
2018-01-24status Pend (Under Cntr)
-
2017-12-05price $89,900
-
2017-11-14$94,900 New
ⓘ Source: listings_history table (triggers on properties + properties_extension) + one-shot
backfill from property_details.listing_events for pre-trigger history.
Tax reassessment forecast NY · Partial reset (capped growth)
- Current annual tax
- $4,004 · $334/mo
- Projected year-2 tax
- $4,004 · $334/mo
- Expected delta
- $0/yr ($0/mo · 0.0%)
ⓘ Screening estimate from a state-policy table — verify with the county assessor before closing.
Climate risk First Street
- Flood 1/10 Low FEMA zone X · 0% chance over 30 yrs
- Wildfire 3/10 Moderate
- Heat 3/10 Moderate 7 d/yr ≥96°F today · 16 d/yr by 30 yrs out
- Wind 3/10 Moderate 6% chance of damaging wind over 30 yrs
- Air quality 2/10 Low 0 unhealthy d/yr today · 1 by 30 yrs out
Nearby sold comps map
Loading sold comps map…
Walkable amenities ~0.75 mi
Loading nearby amenities…
Taxation est. · year 1
- Rental income
- $20,378
- − Mortgage interest
- −$10,637
- − Property taxes
- −$4,004
- − Insurance
- −$950
- − Repairs & maintenance
- −$1,630
- − Management
- −$1,630
- − Depreciation
- −$5,524
- Taxable loss
- −$3,998
- Est. tax savings @ 24.0%
- +$960
- After-tax cash flow
- $154/yr
For passive investors: Depreciation is non-cash, so a rental often shows a tax loss while cash-flowing — sheltering income. Rental losses are passive: they offset passive income freely, and up to $25,000/yr can offset ordinary (W-2) income if you actively participate and your MAGI is under $100k (phasing out to $0 by $150k); unused losses carry forward. On sale, claimed depreciation is recaptured at up to 25%, and gains may owe capital-gains tax (a 1031 exchange can defer both). Figures are a year-1 estimate at your 24.0% rate — not tax advice; consult a CPA.
Schools (NCES district)
- District
- Troy City School District
- NCES district ID
- 3628950
- Math proficiency
- 44% ▲ 6.00%
- Reading proficiency
- 46% ▲ 6.00%
- Median HH income
- $42,143
- Composite
- 37.89/100
- National rank
- #4318
- State rank
- #467 of 590 in NY
Livability — Troy
- Score
- 81/100
- State rank
- #88
- US rank
- #1350
Category grades
Schools grade is shown separately in the Schools card above.
Census & demographics
- Census place
- Troy, NY
- County
- Rensselaer County · 75,590 people
- City population
- 53,479
- Metro
- Albany-Schenectady-Troy, NY
- Population (ZIP)
- 53,479
- Household income
- $75,851
- Rent vs Own
- Severe rent burden
- 2698.0
Population outlook (Rensselaer County) Hauer SSP2
- Today (2025)
- 162,400 people
- By 2030
- 161,746 · -0.4%
- By 2040
- 158,095 · -2.7%
- By 2050
- 152,966 · -5.8%
- By 2075
- 140,767 · -13.3%
- By 2100
- 124,727 · -23.2%
Race, ethnicity, and origin ACS 2023
- Neighborhood character
- Predominantly White (70%)
- Race & ethnicity
- White 70% Black 12% Hispanic / Latino 8% Two or more races 8% Asian 5%
- Hispanic origin (detail)
- Mexican 1% Puerto Rican 4%
- Common ancestry
- Romanian 5% Lithuanian 5% Slovak 1%
- Foreign-born
- 10% · Canada, China
- Languages at home
- 88% English-only · Spanish 4% Other Indo-European 2% Arabic 2%
Political lean MEDSL · Rensselaer
- 2024 margin
- Toss-up / Even · D 50.7% · R 49.3%
- 2008→2024 swing
- -8.0pp toward R · 2008: 9.3pp · 2024: 1.4pp
- All cycles
- 2024: D+1.4 2020: D+5.6 2016: R+2.9 2012: D+11.8 2008: D+9.3
Not yet ingested
- Civics
- —
Market trends
- HPI YoY
- ▼ -142.53%
- Current HPI
- 285.0762
- Rent YoY
- ▲ 4.88%
- Metro
- Albany-Schenectady-Troy, NY
- State GDP YoY
- ▲ 2.60%
- F500 in state
- 92
Industry mix (Fortune 500 HQ in NY)
| Industry | F500 HQs | Revenue |
|---|---|---|
| Financial Services | 10 | $950B |
|
||
| Consumer Goods | 9 | $162B |
|
||
| Insurance | 4 | $225B |
|
||
| Telecommunications | 2 | $144B |
|
||
| Pharmaceuticals | 2 | $112B |
|
||
| Media / Entertainment | 2 | $69B |
|
||
Price history
+105.5% since first listed27 events — show timeline
- 2026-05-15 Price Changed $195,000 Global MLS
- 2026-04-27 Relisted — Global MLS
- 2026-04-24 Pending — Global MLS
- 2026-04-07 Price Changed $199,000 Global MLS
- 2026-03-28 Price Changed $205,000 Global MLS
- 2026-02-25 Price Changed $210,000 Global MLS
- 2026-02-02 Listed $215,000 Global MLS
- 2025-11-14 Listing Removed — Global MLS
- 2025-07-17 Listed $199,000 Global MLS
- 2025-06-29 Listing Removed — Global MLS
- 2025-06-28 Price Changed $219,500 Global MLS
- 2025-06-17 Price Changed $229,000 Global MLS
- 2025-06-09 Price Changed $240,000 Global MLS
- 2025-06-02 Price Changed $245,000 Global MLS
- 2025-05-27 Listed $248,500 Global MLS
- 2022-08-30 Listing Removed — Global MLS
- 2022-08-02 Price Changed $165,000 Global MLS
- 2022-07-20 Price Changed $175,000 Global MLS
- 2022-07-15 Listed $175,500 Global MLS
- 2022-07-07 Listing Removed — Global MLS
- 2022-04-21 Pending — Global MLS
- 2022-04-04 Listed $150,000 Global MLS
- 2018-03-20 Sold (Public Records) $90,300 Public Records
- 2018-03-09 Sold (MLS) $90,300 Global MLS
- 2018-01-24 Pending — Global MLS
- 2017-12-05 Price Changed $89,900 Global MLS
- 2017-11-14 Listed $94,900 Global MLS
Property tax history
+13.0%/yrLatest (2025): $4,004 · -22.1% YoY. Source: county tax records.
Cash-flow waterfall
monthlySold comps — $/sqft
last 12 mo · ≤1 miLoading sold comps…