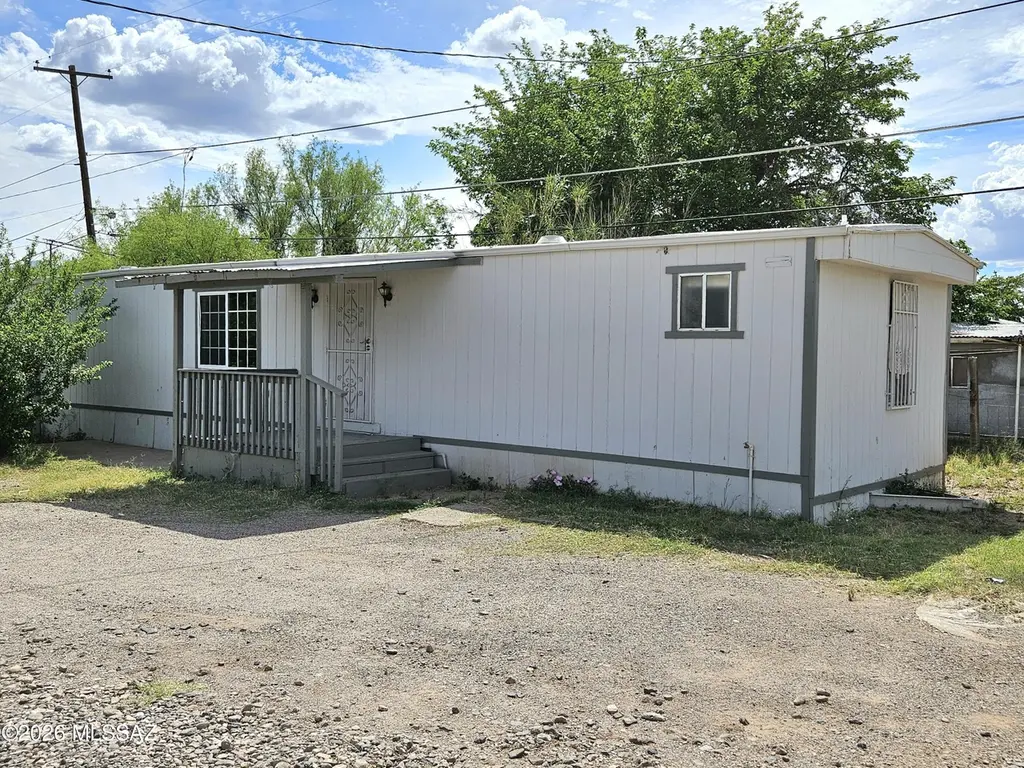
2010 S Bowers St #5 · Bisbee, AZ
Flood risk 1/10 · Minimal
- FEMA flood zone
- A
- Chance of flooding over 30 yrs
- 0.0%
- Est. flood insurance / yr
- $1,009 – $1,996
Fire risk 7/10 · Major
- Est. fire insurance / yr
- $610 – $1,132
Heat risk 5/10 · Moderate
- Hot days now (above 96°F)
- 7 days/yr
- Hot days in 30 yrs
- 17 days/yr
Wind risk 1/10 · Minimal
- Chance of severe wind over 30 yrs
- —
Air-quality risk 1/10 · Minimal
- Unhealthy air days now
- 0 days/yr
- Unhealthy air days in 30 yrs
- 0 days/yr
Risk factors via First Street. Map © Google.
Why this score? — see what drove the B- grade
The composite is a weighted blend of 9 inputs, each scored 0–100. Each bar is that input's sub-score; the figure is the points it added to the 100-point composite (weight × sub-score).
- Cash flow +30.0/30.0
- 1% rule +10.0/10.0
- DSCR +10.0/10.0
- ARV discount +7.5/15.0
- Livability +3.1/5.0
- Condition / age +2.8/5.0
- Rent growth +2.5/5.0
- Schools +1.5/10.0
- Appreciation +0.0/10.0
$30,000
🖨 Deal sheet 📄 Offer letter ✓ Due diligence
Listing remarks
Move in ready, cozy home in a quiet neighborhood. Some nice updates. Newer stainless appliances. Mature trees offer cool and shade. Covered front deck. Metal storage shed. On a rented lot. Great value! Come see this one today!
Key facts
- Covered front deck
- Metal storage shed
- Built 1983
Tags
Property features AI
Finance
- Other: Zoning: Cochise - R-18
- Financial info: No additional financial details provided
- HOA & community: No HOA information provided
Exterior
- Parking: Shared driveway
- Security: Wrought iron security door
- Utilities: Public water; Septic sewer
- Home design: Mobile home; One story
- Construction: Frame construction; Built-up reflective roof
- Exterior features: Covered patio/porch; Deck; Shed(s); Borders common area; Paved road access (city-maintained)
Interior
- Kitchen: Dishwasher; Refrigerator; Electric oven; Microwave
- Bedrooms: Bedrooms not specified
- Flooring: Carpet; Vinyl
- Bathrooms: 2 full bathrooms
- Heating & cooling: Forced air heating (natural gas); Ceiling fans; Evaporative cooling; Window unit(s)
- Interior features: Wrought iron security door; Roll-in shower
- Laundry & utility: Dedicated laundry room
Neighborhood map
What this means for you Summary
Snapshot
- This is a 3-bed/2.0-bath manufactured listed at $30k. Condition is rated average.
Deal economics
- At list price, monthly cash flow is $564 ($7k/yr) — positive.
- The deal already cash-flows at list — no discount required.
- Meets the 1% rule at list price ($1k rent vs $30k).
- Recommended offer: $29k (3.0% below list) — sets the bar for market timing.
- Cap rate 33.8% vs local median 2.1% in Bisbee — top-decile yield for the area; either an underpriced asset or a hidden risk that comps aren't pricing in. Stress-test before assuming the spread holds.
Location & tenants
- Location reads 61/100 on livability (#151 in AZ) — a middle-class / working-renter tenant base. Strengths: crime A+, cost of living A+, housing A; Watch: employment D, schools F, amenities F.
- Naco Elementary District (4176) (rural): math 14% / reading 13% proficiency, ranked #411 of 501 in AZ (top 82%) — low school quality limits family demand, transient renter base, plan for 1-2y turnover; 78% free/reduced lunch — lower-income household profile, screen leases tightly.
- Market conditions: 139 active listings in the ZIP; 437 units permitted in Cochise County in 2024 (6 in 5+ unit buildings).
Forward outlook
- Local home prices are declining (-3.0%/yr); year-one equity from $207 of loan paydown is wiped out by about $900 of value loss. Plan a longer hold.
- Cochise County population projected at -30% by 2050 — secular population decline; favor cash flow + early exit over multi-decade hold.
- At projected returns (-3.0% appreciation + 3.0% rent growth), your $8k cash investment doubles in ~2 years — after that, you're playing with house money.
Negotiation context
- It's been on market 53 days — a 3% lower offer ($29k) is reasonable based on typical stale-listing flexibility.
Risks & watch-outs
- Watch-outs: flood insurance adds $125/mo.
- Climate carrying-cost: in FEMA flood zone A (mandatory federal flood insurance); major wildfire risk; extreme-heat days projected 7→17/yr by 2055 (HVAC capex compounding) — expect insurance premiums to compound above CPI over the hold.
Questions for the listing agent
- It's been on market 53 days. Have you received any prior offers? Is the seller open to a 3% concession, seller financing, or rate buy-down credit?
- What's the actual annual flood-insurance premium (NFIP or private), and is the property in a SFHA with mandatory coverage?
- Is there a deadline driving the sale (1031 exchange, divorce, estate, relocation)? That informs how much negotiation room exists.
- Schools are F-rated, which usually means shorter tenancies and higher turnover. Who's the typical renter profile here, and what's been the actual vacancy rate?
- What's the average days-on-market for RENTAL listings here right now (not sales)? A rising rental-DOM trend means longer vacancies and softer asking-rent achievability than the comps imply.
- What's the recent tenant-quality profile in this submarket — average credit score on applications, eviction rate, late-payment / NSF rate, and stable-employment percentage? A property-management company in the area should have these aggregated.
- How much new for-sale + rental construction is in the pipeline within 1–3 miles? Heavy new supply typically softens prices + rents 12–24 months out; constrained supply supports both.
Investment metrics
- 1% rule
- 3.78% ✓
- Cap rate
- 33.85%
- Cash-on-cash
- 98.41%
- DSCR
- 5.38
- GRM
- 2.2
CMA / ARV
No comps found within radius.
Projected returns pro-forma
-3.0% appreciation · 3.0% rent growth · sell at horizon
- IRR
- 80.8%
- Equity multiple
- 4.71×
- Total profit
- $31,132
- Equity at exit
- $4,473
- IRR
- 84.2%
- Equity multiple
- 9.78×
- Total profit
- $73,716
- Equity at exit
- $2,594
Cash invested: $8,400 (down + closing). Projections, not guarantees.
Landlord ↔ Tenant lean methodology
- Overall (STATE)
- 87 Strongly Landlord-Friendly
- State Arizona
- 87 Strongly Landlord-Friendly · R+3
- County
- — inherits STATE
- City
- — inherits STATE
ZIP-level market 85603
- Active inventory
- 139
- Price-to-rent
- 2.2×
Monthly cashflow live
- Estimated rent
- $1,134 medium interval (Pro) →
- Mortgage (P&I)
- −$157
- Tax est. 1.5%
- −$38 /mo · $450/yr
- Insurance
- −$12
- Flood insurance flood zone
- −$125 /mo · $1,502/yr
- HOA
- −$0
- Vacancy / Maint / Mgmt
- −$238
- Net cashflow
- $564
Break-even live
UW: 25.0% down · 7.5% · 30yr · 1.5% tax · 5.0% vac · 8.0% maint · 8.0% mgmt
Financing live
Cash to close
- Down payment
- $7,500
- Closing costs
- $900
- Reserves months
- —
- Total cash needed
- —
Loan-product check · same deal, 3 products live
Conventional
25% down · 7.5% · 30yr
- Down + closing
- —
- Monthly P&I
- —
- Monthly cashflow
- —
- DSCR
- —
- Eligible?
- —
Personal DTI + credit; lowest rate.
DSCR
20% down · 8.5% · 30yr
- Down + closing
- —
- Monthly P&I
- —
- Monthly cashflow
- —
- DSCR
- —
- Eligible?
- —
No personal income docs; deal must DSCR.
Hard money
10% down · 12.0% · 12mo
- Down + closing
- —
- Monthly P&I
- —
- Monthly cashflow
- —
- DSCR
- —
- Eligible?
- —
Short-term bridge; refi at stabilization.
Listing history 16 events
-
2026-06-19days on market $30,000 Active 53 DOM
-
2026-06-18days on market $30,000 Active 52 DOM
-
2026-06-17days on market $30,000 Active 51 DOM
-
2026-06-16days on market $30,000 Active 50 DOM
-
2026-06-15days on market $30,000 Active 49 DOM
-
2026-06-14days on market $30,000 Active 47 DOM
-
2026-06-12days on market $30,000 Active 46 DOM
-
2026-06-09days on market $30,000 Active 43 DOM
-
2026-06-08days on market $30,000 Active 42 DOM
-
2026-06-07days on market $30,000 Active 41 DOM
-
2026-06-04days on market $30,000 Active 37 DOM
-
2026-06-02days on market $30,000 Active 36 DOM
-
2026-06-01days on market $30,000 Active 35 DOM
-
2026-05-31days on market $30,000 Active 34 DOM
-
2026-05-31days on market $30,000 Active 33 DOM
-
2026-04-24$30,000 Active
ⓘ Source: listings_history table (triggers on properties + properties_extension) + one-shot
backfill from property_details.listing_events for pre-trigger history.
Climate risk First Street
- Flood 1/10 Low FEMA zone A · 0% chance over 30 yrs
- Wildfire 7/10 Severe
- Heat 5/10 Major 7 d/yr ≥96°F today · 17 d/yr by 30 yrs out
- Wind 1/10 Low
- Air quality 1/10 Low 0 unhealthy d/yr today · 0 by 30 yrs out
Nearby sold comps map
Loading sold comps map…
Walkable amenities ~0.75 mi
Loading nearby amenities…
Taxation est. · year 1
- Rental income
- $13,613
- − Mortgage interest
- −$1,680
- − Property taxes
- −$450
- − Insurance
- −$1,652
- − Repairs & maintenance
- −$1,089
- − Management
- −$1,089
- − Depreciation
- −$873
- Taxable income
- $6,779
- Est. tax owed @ 24.0%
- −$1,627
- After-tax cash flow
- $5,137/yr
For passive investors: Depreciation is non-cash, so a rental often shows a tax loss while cash-flowing — sheltering income. Rental losses are passive: they offset passive income freely, and up to $25,000/yr can offset ordinary (W-2) income if you actively participate and your MAGI is under $100k (phasing out to $0 by $150k); unused losses carry forward. On sale, claimed depreciation is recaptured at up to 25%, and gains may owe capital-gains tax (a 1031 exchange can defer both). Figures are a year-1 estimate at your 24.0% rate — not tax advice; consult a CPA.
Condition & rehab AI · 14 photos
The home is move-in ready with some cosmetic updates needed to enhance its curb appeal and value.
Repairs flagged
- Minor Paint — Some chipping and wear visible on interior walls.
- Minor Exterior siding — Some discoloration and minor damage visible.
- Minor Landscaping — Overgrown areas and lack of curb appeal.
Value-add opportunities
- Resale Paint interior walls — Fresh paint can significantly improve the home's appearance and value.
- Resale Replace exterior siding — New siding can enhance the home's curb appeal and increase its value.
- Both Landscaping — Well-maintained landscaping can improve both resale and rental value.
Renovation cost estimate screening
| Repair item | Severity | Est. cost |
|---|---|---|
| Paint · Some chipping and wear visible on interior walls. | Minor | $500–3,000 |
| Exterior siding · Some discoloration and minor damage visible. | Minor | $500–3,000 |
| Landscaping · Overgrown areas and lack of curb appeal. | Minor | $500–3,000 |
| Total estimated repair cost · 3 items | $1,500–9,000 |
Value-add ROI direction
- Resale Paint interior walls — Fresh paint can significantly improve the home's appearance and value. ↑
- Resale Replace exterior siding — New siding can enhance the home's curb appeal and increase its value. ↑
- Both Landscaping — Well-maintained landscaping can improve both resale and rental value. ↑
ⓘ Cost ranges are severity-bucket heuristics (US national rule-of-thumb). Get contractor quotes + a written scope before underwriting a rehab budget.
Schools (NCES district)
- District
- Naco Elementary District (4176)
- NCES district ID
- 0405430
- Math proficiency
- 14% ▼ -3.00%
- Reading proficiency
- 13% ▼ -2.00%
- Median HH income
- $35,862
- Composite
- 14.69/100
- National rank
- #14396
- State rank
- #411 of 501 in AZ
Livability — Bisbee
- Score
- 61/100
- State rank
- #151
- US rank
- #17700
Category grades
Schools grade is shown separately in the Schools card above.
Census & demographics
- Population (ZIP)
- 6,798
Population outlook (Cochise County) Hauer SSP2
- Today (2025)
- 113,402 people
- By 2030
- 106,197 · -6.4%
- By 2040
- 92,166 · -18.7%
- By 2050
- 79,805 · -29.6%
- By 2075
- 56,831 · -49.9%
- By 2100
- 35,103 · -69.0%
Race, ethnicity, and origin ACS 2023
- Neighborhood character
- Majority White (62%)
- Race & ethnicity
- White 62% Hispanic / Latino 33% Two or more races 23% Native American 2%
- Hispanic origin (detail)
- Mexican 30%
- Common ancestry
- Slovak 3% Iranian 2% Serbian 2%
- Foreign-born
- 7% · Canada
- Languages at home
- 78% English-only · Spanish 20% French/Haitian/Cajun 1% German/W. Germanic 1%
Political lean MEDSL · Cochise
- 2024 margin
- Strong R (+23.1) · D 37.8% · R 61.0% · Other 1.2%
- 2008→2024 swing
- -2.5pp toward R · 2008: -20.7pp · 2024: -23.1pp
- All cycles
- 2024: R+23.1 2020: R+19.6 2016: R+22.6 2012: R+24.0 2008: R+20.7
Not yet ingested
- Civics
- —
Market trends
- HPI YoY
- ▼ -180.64%
- Current HPI
- 168.8806
- Rent YoY
- —
- Metro
- —
- State GDP YoY
- ▲ 4.54%
- F500 in state
- 20
Industry mix (Fortune 500 HQ in AZ)
| Industry | F500 HQs | Revenue |
|---|---|---|
| Technology | 2 | $13B |
|
||
| Mining / Metals | 1 | $23B |
|
||
| Environmental Services | 1 | $16B |
|
||
| Metals / Steel | 1 | $14B |
|
||
| Technology Distribution | 1 | $9B |
|
||
| Homebuilding | 1 | $8B |
|
||
Price history
1 event — show timeline
- 2026-04-24 Listed $30,000 MLSSAZ
Cash-flow waterfall
monthlySold comps — $/sqft
last 12 mo · ≤1 miLoading sold comps…