 Duplex
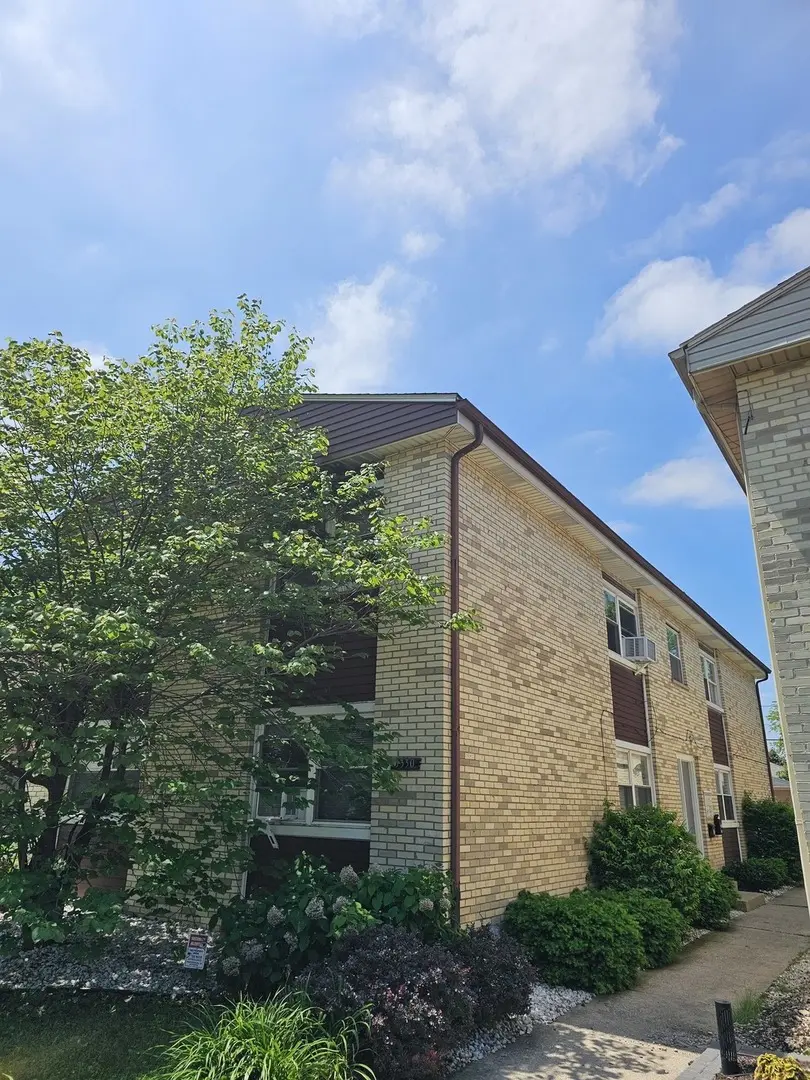
5330 S 73rd Ct · Summit, IL
Flood risk 1/10 · Minimal
- FEMA flood zone
- X (unshaded)
- Chance of flooding over 30 yrs
- 0.0%
- Est. flood insurance / yr
- $473 – $860
Fire risk 1/10 · Minimal
- Est. fire insurance / yr
- $804 – $1,492
Heat risk 3/10 · Minor
- Hot days now (above 100°F)
- 7 days/yr
- Hot days in 30 yrs
- 15 days/yr
Wind risk 2/10 · Minimal
- Chance of severe wind over 30 yrs
- 1.0%
Air-quality risk 4/10 · Minor
- Unhealthy air days now
- 3 days/yr
- Unhealthy air days in 30 yrs
- 5 days/yr
Risk factors via First Street. Map © Google.
Why this score? — see what drove the F grade
The composite is a weighted blend of 9 inputs, each scored 0–100. Each bar is that input's sub-score; the figure is the points it added to the 100-point composite (weight × sub-score).
- ARV discount +7.5/15.0
- Cash flow +4.9/30.0
- Condition / age +3.8/5.0
- Livability +3.7/5.0
- Rent growth +2.5/5.0
- Schools +1.8/10.0
- 1% rule +0.7/10.0
- DSCR +0.0/10.0
- Appreciation +0.0/10.0
$575,000
🖨 Deal sheet 📄 Offer letter ✓ Due diligence
Multi-family units
County records classify this as Multi-Family (2-4 Unit). Listing-text estimate: 2 units. confirmed
Listing remarks
TURNKEY CASH-FLOW MACHINE: INVESTOR OR OWNER-OCCUPANT DREAM IN PRIME SUMMIT! Stop fighting heavy renovation costs and add an immediate, stabilized performer to your portfolio. Units are occupied with steady tenants on active leases generating day-one cash flow. One unit can be delivered VACANT at the end of June. This is a massive advantage: perfect for an owner-occupant looking to "house hack" (live in one, let the others tenant cover the mortgage), or for an investor ready to instantly place a new tenant at top-of-market rent to maximize the Cap Rate. Coin-operated Washer and Dryer for extra income. Solid, low-maintenance brick structure situated in a high-demand rental marke
Key facts
- Turnkey asset
- Cash-flowing
- Unbeatable access
Tags
Property features AI
Finance
- Other: 4 units in the building
- Financial info: Gross annual income reported at $61,260
Exterior
- Parking: 4 parking spaces total; Assigned parking; Off-street parking
- Utilities: Water from Lake Michigan and public supply; Public sewer
- Home design: Two- to four-unit building; Fee simple ownership; Built 61–70 years ago; Built before 1978
- Construction: Vinyl siding and brick exterior
- Exterior features: Lot dimensions approximately 122.95' x 35.88'; Lot roughly 0.25–0.49 acre
Interior
- Kitchen: Stove; Refrigerator
- Bedrooms: 7 bedrooms total
- Bathrooms: 4 full bathrooms
- Heating & cooling: Natural gas heating; Window air conditioners in some units
- Interior features: 15 total rooms; Crawl space basement; Gas water heater
- Laundry & utility: Tenants pay electric and gas (where applicable)
Neighborhood map
What this means for you Summary
Snapshot
- This is a 2 × 2-bed/1.0-bath units multifamily listed at $575k. Condition is rated good.
Deal economics
- At list price, monthly cash flow is $-1k ($-17k/yr) — negative. Per door: $-690/mo.
- To cash-flow at today's rent, offer at most $375k (34.8% below list).
- To meet the 1% rule (rent ≥ 1% of price), the offer needs to be $328k (42.9% below list).
- Recommended offer: $328k (42.9% below list) — sets the bar for 1% rule.
Location & tenants
- Location reads 74/100 on livability (#250 in IL, #4,648 nationally) — a middle-class / working-renter tenant base. Strengths: commute A+, cost of living A+, housing A+; Watch: health & safety C-, employment D+, crime D.
- Argo Chsd 217 (suburban): math 20% / reading 20% proficiency, ranked #423 of 620 in IL (top 68%) — low school quality limits family demand, transient renter base, plan for 1-2y turnover.
- Market conditions: 14 active listings in the ZIP; 6,272 units permitted in Cook County in 2024 (4,658 in 5+ unit buildings).
Forward outlook
- Local home prices are declining (-3.0%/yr); year-one equity from $4k of loan paydown is wiped out by about $17k of value loss. Plan a longer hold.
Negotiation context
- It's been on market 16 days — a 2% lower offer ($566k) is reasonable based on typical stale-listing flexibility.
Questions for the listing agent
- What do current leases actually rent for vs. the listed asking? Can we see a recent rent roll and the last 12 months of T-12 income?
- Can we see the unit-by-unit rent roll, current vacancy, and any below-market leases? What's the average tenancy length?
- What capital expenditures (roof, boiler, parking lot, exteriors) have been made in the last 5 years, and what's planned in the next 2?
- Built in 1963 — when were the roof, HVAC, electrical panel, plumbing, and water heater last replaced?
- Is there a deadline driving the sale (1031 exchange, divorce, estate, relocation)? That informs how much negotiation room exists.
- Schools are F-rated, which usually means shorter tenancies and higher turnover. Who's the typical renter profile here, and what's been the actual vacancy rate?
- Crime grade is D in this area — have there been break-ins, vandalism, or insurance claims at this property in the last 3 years? What carrier currently insures it and at what premium?
- The area grade is low — what's the realistic commute time and amenity access for the typical tenant pool here? Any planned neighborhood developments (good or bad) we should know about?
- What's the average days-on-market for RENTAL listings here right now (not sales)? A rising rental-DOM trend means longer vacancies and softer asking-rent achievability than the comps imply.
- What's the recent tenant-quality profile in this submarket — average credit score on applications, eviction rate, late-payment / NSF rate, and stable-employment percentage? A property-management company in the area should have these aggregated.
- How much new apartment / multifamily construction is in the pipeline within 1–3 miles? Heavy new supply (>2% of stock underway) typically softens rents 12–24 months out; light construction supports rent growth.
Investment metrics
- 1% rule
- 0.57% ✗
- Cap rate
- 3.41%
- Cash-on-cash
- -10.29%
- DSCR
- 0.54
- GRM
- 14.6
CMA / ARV
No comps found within radius.
Show comp detail 4 sales within ~0.75 mi
| Address | Dist | Beds/Ba | Sqft | Sold | Price | $/sf | Match |
|---|---|---|---|---|---|---|---|
| 5211 S 73rd Ct | 0.09mi | 7/4.0 (-1) | — | 10mo | $490,000 | — | 70 |
| 7224 Park Ave | 0.18mi | 7/4.0 (-1) | — | 14mo | $450,000 | — | 63 |
| 5307 S 73rd Ct | 0.05mi | 7/4.0 (-1) | — | 21mo | $425,000 | — | 62 |
| 7222 Park Ave | 0.18mi | 7/3.0 (-1) | — | 12mo | $420,000 | — | 60 |
Match score weights: distance 35% · size 25% · config 20% · recency 20%. Top-matched comps best support the ARV.
Projected returns pro-forma
-3.0% appreciation · 3.0% rent growth · sell at horizon
- IRR
- -34.9%
- Equity multiple
- -0.12×
- Total profit
- $-181,076
- Equity at exit
- $85,734
- IRR
- -45.5%
- Equity multiple
- -0.68×
- Total profit
- $-270,728
- Equity at exit
- $49,715
Cash invested: $161,000 (down + closing). Projections, not guarantees.
Landlord ↔ Tenant lean methodology
- Overall (STATE)
- 43 Moderately Tenant-Leaning
- State Illinois
- 43 Moderately Tenant-Leaning · D+7
- County
- — inherits STATE
- City
- — inherits STATE
ZIP-level market 60501
- Home prices YoY
- -26.3%
- Active inventory
- 14
- Price-to-rent
- 29.2×
Monthly cashflow live
- Estimated rent
- $3,282 high interval (Pro) →
- Mortgage (P&I)
- −$3,015
- Tax est. 1.5%
- −$719 /mo · $8,625/yr
- Insurance
- −$240
- HOA
- −$0
- Vacancy / Maint / Mgmt
- −$689
- Net cashflow
- $-1,381
Break-even live
2-unit breakdown (identical units grouped — click to expand)
| Units | Beds | Baths | Est. rent |
|---|---|---|---|
| 2× units | 2 | 1 | $3,282 |
| #1 | 2 | 1 | $1,641 |
| #2 | 2 | 1 | $1,641 |
| Total (2 units) | $3,282 | ||
UW: 25.0% down · 7.5% · 30yr · 1.5% tax · 5.0% vac · 8.0% maint · 8.0% mgmt
Financing live
Cash to close
- Down payment
- $143,750
- Closing costs
- $17,250
- Reserves months
- —
- Total cash needed
- —
Loan-product check · same deal, 3 products live
Conventional
25% down · 7.5% · 30yr
- Down + closing
- —
- Monthly P&I
- —
- Monthly cashflow
- —
- DSCR
- —
- Eligible?
- —
Personal DTI + credit; lowest rate.
DSCR
20% down · 8.5% · 30yr
- Down + closing
- —
- Monthly P&I
- —
- Monthly cashflow
- —
- DSCR
- —
- Eligible?
- —
No personal income docs; deal must DSCR.
Hard money
10% down · 12.0% · 12mo
- Down + closing
- —
- Monthly P&I
- —
- Monthly cashflow
- —
- DSCR
- —
- Eligible?
- —
Short-term bridge; refi at stabilization.
Listing history 9 events
-
2026-06-18days on market $575,000 Active 16 DOM
-
2026-06-17days on market $575,000 Active 15 DOM
-
2026-06-16days on market $575,000 Active 14 DOM
-
2026-06-15days on market $575,000 Active 13 DOM
-
2026-06-13days on market $575,000 Active 11 DOM
-
2026-06-09days on market $575,000 Active 7 DOM
-
2026-06-08days on market $575,000 Active 6 DOM
-
2026-06-07remarks 689-char remark
-
2026-06-07$575,000 Active 5 DOM
ⓘ Source: listings_history table (triggers on properties + properties_extension) + one-shot
backfill from property_details.listing_events for pre-trigger history.
Climate risk First Street
- Flood 1/10 Low FEMA zone X (unshaded) · 0% chance over 30 yrs
- Wildfire 1/10 Low
- Heat 3/10 Moderate 7 d/yr ≥100°F today · 15 d/yr by 30 yrs out
- Wind 2/10 Low 100% chance of damaging wind over 30 yrs
- Air quality 4/10 Moderate 3 unhealthy d/yr today · 5 by 30 yrs out
Nearby sold comps map
Loading sold comps map…
Walkable amenities ~0.75 mi
Loading nearby amenities…
Taxation est. · year 1
- Rental income
- $39,384
- − Mortgage interest
- −$32,209
- − Property taxes
- −$8,625
- − Insurance
- −$2,875
- − Repairs & maintenance
- −$3,151
- − Management
- −$3,151
- − Depreciation
- −$16,727
- Taxable loss
- −$27,354
- Est. tax savings @ 24.0%
- +$6,565
- After-tax cash flow
- $-10,006/yr
For passive investors: Depreciation is non-cash, so a rental often shows a tax loss while cash-flowing — sheltering income. Rental losses are passive: they offset passive income freely, and up to $25,000/yr can offset ordinary (W-2) income if you actively participate and your MAGI is under $100k (phasing out to $0 by $150k); unused losses carry forward. On sale, claimed depreciation is recaptured at up to 25%, and gains may owe capital-gains tax (a 1031 exchange can defer both). Figures are a year-1 estimate at your 24.0% rate — not tax advice; consult a CPA.
Condition & rehab AI · 13 photos
This multi-family property is in good condition with minimal repairs needed. Fresh paint and maintaining the landscaping would significantly enhance its curb appeal and value.
Value-add opportunities
- Both Paint exterior — Fresh paint enhances curb appeal and value
- Both Landscaping — Well-maintained landscaping improves curb appeal and rental value
Renovation cost estimate screening
Value-add ROI direction
- Both Paint exterior — Fresh paint enhances curb appeal and value ↑
- Both Landscaping — Well-maintained landscaping improves curb appeal and rental value ↑
ⓘ Cost ranges are severity-bucket heuristics (US national rule-of-thumb). Get contractor quotes + a written scope before underwriting a rehab budget.
Schools (NCES district)
- District
- Argo Chsd 217
- NCES district ID
- 1704020
- Math proficiency
- 20% ▼ -7.00%
- Reading proficiency
- 20% ▼ -6.00%
- Median HH income
- $47,451
- Composite
- 17.68/100
- National rank
- #9026
- State rank
- #423 of 620 in IL
Livability — Summit
- Score
- 74/100
- State rank
- #250
- US rank
- #4648
Category grades
Schools grade is shown separately in the Schools card above.
Census & demographics
- Census place
- Summit, IL
- Population (ZIP)
- 11,490
Population outlook (Cook County) Hauer SSP2
- Today (2025)
- 5,347,519 people
- By 2030
- 5,357,703 · +0.2%
- By 2040
- 5,324,924 · -0.4%
- By 2050
- 5,230,762 · -2.2%
- By 2075
- 4,785,735 · -10.5%
- By 2100
- 4,188,836 · -21.7%
Race, ethnicity, and origin ACS 2023
- Neighborhood character
- Predominantly Hispanic (74%)
- Race & ethnicity
- Hispanic / Latino 74% Two or more races 23% White 14% Black 7% Asian 3% Native American 2%
- Hispanic origin (detail)
- Mexican 67% Puerto Rican 2%
- Common ancestry
- Romanian 4% Danish 1% Armenian 1%
- Foreign-born
- 41% · Canada, South Korea
- Languages at home
- 30% English-only · Spanish 63% Other Indo-European 3% Russian/Polish/Slavic 2%
Political lean MEDSL · Cook
- 2024 margin
- Solid D (+42.0) · D 70.4% · R 28.4% · Other 1.2%
- 2008→2024 swing
- -11.4pp toward R · 2008: 53.4pp · 2024: 42.0pp
- All cycles
- 2024: D+42.0 2020: D+50.3 2016: D+53.0 2012: D+49.4 2008: D+53.4
Not yet ingested
- Civics
- —
Market trends
- HPI YoY
- ▼ -96.97%
- Current HPI
- 271.3104
- Rent YoY
- —
- Metro
- —
- State GDP YoY
- ▲ 1.59%
- F500 in state
- 60
Industry mix (Fortune 500 HQ in IL)
| Industry | F500 HQs | Revenue |
|---|---|---|
| Insurance | 4 | $201B |
|
||
| Consumer Goods | 4 | $87B |
|
||
| Industrial Machinery | 3 | $64B |
|
||
| Healthcare | 2 | $55B |
|
||
| Retail / Pharmacy | 1 | $148B |
|
||
| Agriculture / Food | 1 | $86B |
|
||
Cash-flow waterfall
monthlySold comps — $/sqft
last 12 mo · ≤1 miLoading sold comps…