732 Avenue A · Selmont-West Selmont, AL
Flood risk 1/10 · Minimal
- FEMA flood zone
- X (unshaded)
- Chance of flooding over 30 yrs
- 0.0%
- Est. flood insurance / yr
- $507 – $1,088
Fire risk 4/10 · Minor
- Est. fire insurance / yr
- $916 – $1,700
Heat risk 8/10 · Major
- Hot days now (above 108°F)
- 7 days/yr
- Hot days in 30 yrs
- 20 days/yr
Wind risk 8/10 · Major
- Chance of severe wind over 30 yrs
- 80.0%
Air-quality risk 2/10 · Minimal
- Unhealthy air days now
- 0 days/yr
- Unhealthy air days in 30 yrs
- 1 days/yr
Risk factors via First Street. Map © Google.
Why this score? — see what drove the D grade
The composite is a weighted blend of 9 inputs, each scored 0–100. Each bar is that input's sub-score; the figure is the points it added to the 100-point composite (weight × sub-score).
- Cash flow +15.0/30.0
- ARV discount +7.5/15.0
- 1% rule +5.0/10.0
- DSCR +5.0/10.0
- Rent growth +2.5/5.0
- Livability +2.5/5.0
- Condition / age +2.5/5.0
- Schools +1.0/10.0
- Appreciation +0.0/10.0
$5,900
🖨 Deal sheet 📄 Offer letter ✓ Due diligence
Listing remarks
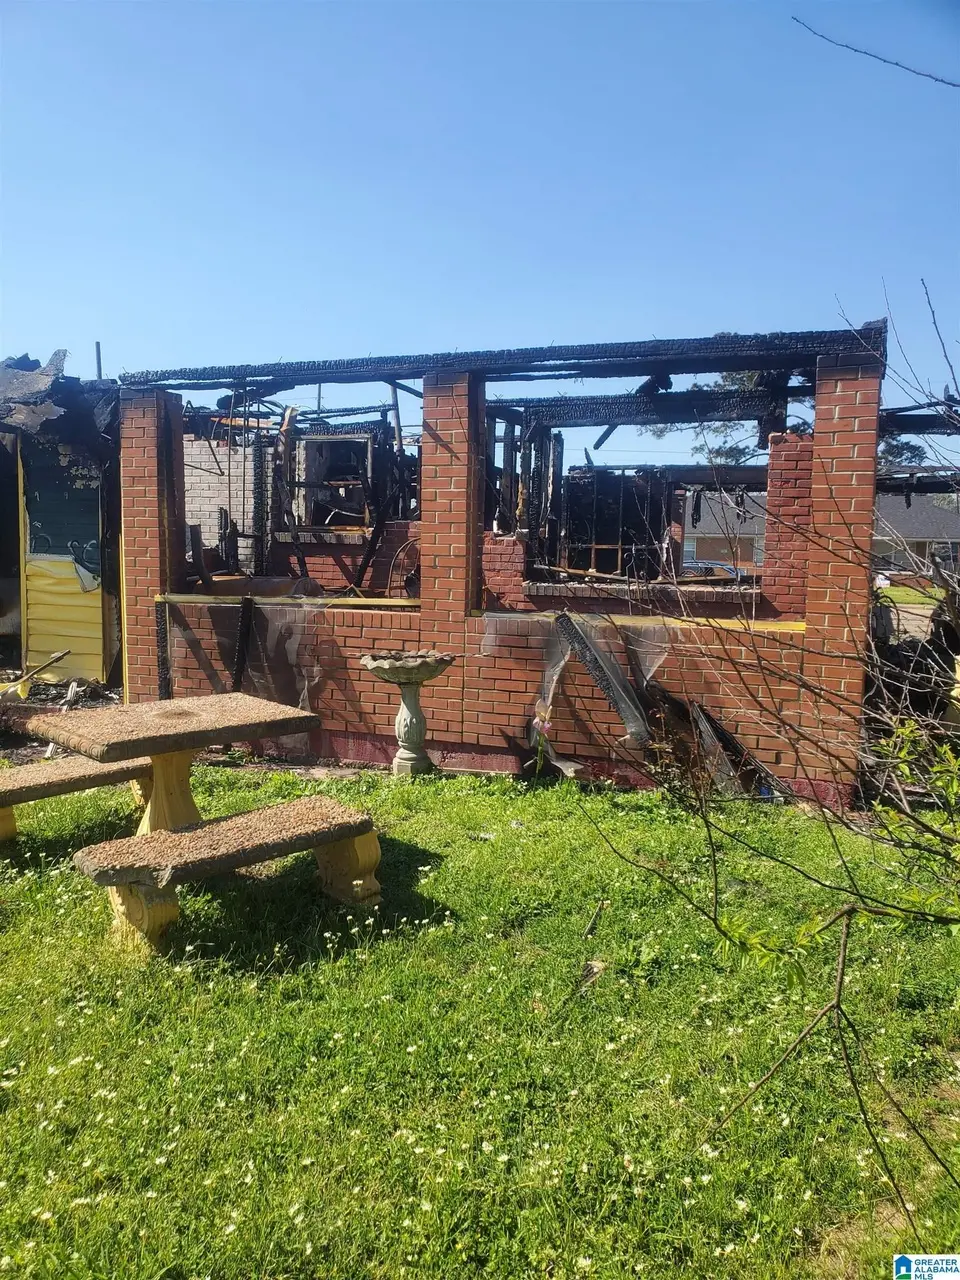
Attention investors and DIY enthusiasts! Multiple exit strategies: finish this remodel then either flip, rent or move in! Home being sold as is. Cash preferred but will consider financed all offers. Seller is assisted by an Attorney in Fact. Do not knock on door or approach house without prior communication.
Key facts
- 0.38 acre lot
- Built 1983
- Listed 32 days
Property features AI
Finance
- Other: Property parcel ID available
- Financial info: No financial details provided
- HOA & community: No subdivision/HOA listed
Exterior
- Parking: Off-street parking
- Security: No security features listed
- Utilities: Public water; Gas water heater; Underground utilities; Internet availability: Unknown
- Home design: Existing construction; Single-story entry layout (all main-level rooms)
- Construction: Siding (other) exterior; Slab foundation
- Exterior features: No patio, deck, garden, or pool; Not waterfront; Lot has no notable view; Flood plain: No
Interior
- Kitchen: Kitchen on main level
- Bedrooms: Three bedrooms, all on the main level
- Flooring: Hardwood laminate flooring
- Bathrooms: One full bathroom with tub/shower combo
- Heating & cooling: Central heating; Central cooling
- Interior features: Ceilings: Other (see remarks); No additional interior features listed
- Laundry & utility: No laundry details provided
Neighborhood map
What this means for you Summary
Snapshot
- This is a 3-bed/1.0-bath single-family listed at $6k.
Deal economics
- At list price, monthly cash flow is $746 ($9k/yr) — positive.
- The deal already cash-flows at list — no discount required.
- Meets the 1% rule at list price ($1k rent vs $6k).
- Recommended offer: $6k (3.0% below list) — sets the bar for market timing.
Location & tenants
- Location reads: area grade D — affects rentability + tenant quality, not the cash-flow math above.
- Dallas County (rural): math 2% / reading 22% proficiency, ranked #115 of 129 in AL (top 89%) — low school quality limits family demand, transient renter base, plan for 1-2y turnover; 79% free/reduced lunch — lower-income household profile, screen leases tightly.
- Zoned schools: Southside Primary School (151 students, 93% FRL); Southside High School (math 2% / reading 2%, grade F, #291 of 305 statewide, top 100%, 296 students, 91% FRL).
- Market conditions: 104 active listings in the ZIP; 1 comparable units currently listed for rent nearby; 7 units permitted in Dallas County in 2024 (0 in 5+ unit buildings).
Forward outlook
- Local home prices are declining (-3.0%/yr); year-one equity from $41 of loan paydown is wiped out by about $177 of value loss. Plan a longer hold.
- Dallas County population projected at -36% by 2050 — secular population decline; favor cash flow + early exit over multi-decade hold.
- At projected returns (-3.0% appreciation + 3.0% rent growth), your $2k cash investment doubles in ~1 year — after that, you're playing with house money.
Negotiation context
- It's been on market 32 days — a 3% lower offer ($6k) is reasonable based on typical stale-listing flexibility.
Risks & watch-outs
- Climate carrying-cost: severe wind risk, 80% chance of damaging wind over 30y; extreme-heat days projected 7→20/yr by 2055 (HVAC capex compounding) — expect insurance premiums to compound above CPI over the hold.
Questions for the listing agent
- It's been on market 32 days. Have you received any prior offers? Is the seller open to a 3% concession, seller financing, or rate buy-down credit?
- Is there a deadline driving the sale (1031 exchange, divorce, estate, relocation)? That informs how much negotiation room exists.
- The area grade is low — what's the realistic commute time and amenity access for the typical tenant pool here? Any planned neighborhood developments (good or bad) we should know about?
- What's the average days-on-market for RENTAL listings here right now (not sales)? A rising rental-DOM trend means longer vacancies and softer asking-rent achievability than the comps imply.
- What's the recent tenant-quality profile in this submarket — average credit score on applications, eviction rate, late-payment / NSF rate, and stable-employment percentage? A property-management company in the area should have these aggregated.
- How much new for-sale + rental construction is in the pipeline within 1–3 miles? Heavy new supply typically softens prices + rents 12–24 months out; constrained supply supports both.
Investment metrics
- 1% rule
- 16.95% ✓
- Cap rate
- 158.00%
- Cash-on-cash
- 541.82%
- DSCR
- 25.11
- GRM
- 0.5
CMA / ARV
- ARV (on-the-fly)
- $51,702
- Comps found
- 2
Show comp detail 2 sales within ~0.75 mi
| Address | Dist | Beds/Ba | Sqft | Sold | Price | $/sf | Match |
|---|---|---|---|---|---|---|---|
| 701 Avenue A St | 0.03mi | 3/1.0 | 1,272 (+3%) | 2mo | $48,000 | $38 | 92 |
| 865 Columbus Ct Unit A & B | 0.23mi | 3/2.0 | 1,222 (-1%) | 13mo | $50,991 | $42 | 73 |
Match score weights: distance 35% · size 25% · config 20% · recency 20%. Top-matched comps best support the ARV.
Projected returns pro-forma
-3.0% appreciation · 3.0% rent growth · sell at horizon
- IRR
- —
- Equity multiple
- 29.19×
- Total profit
- $46,568
- Equity at exit
- $880
- IRR
- —
- Equity multiple
- 62.62×
- Total profit
- $101,794
- Equity at exit
- $510
Cash invested: $1,652 (down + closing). Projections, not guarantees.
Landlord ↔ Tenant lean methodology
- Overall (STATE)
- 90 Strongly Landlord-Friendly
- State Alabama
- 90 Strongly Landlord-Friendly · R+15
- County
- — inherits STATE
- City
- — inherits STATE
ZIP-level market 36701
- Home prices YoY
- -6.3%
- Active inventory
- 104
- Price-to-rent
- 0.5×
Monthly cashflow live
- Estimated rent
- $1,000 medium interval (Pro) →
- Mortgage (P&I)
- −$31
- Tax from tax record
- −$11 /mo · $128/yr
- Insurance
- −$2
- HOA
- −$0
- Vacancy / Maint / Mgmt
- −$210
- Net cashflow
- $746
Break-even live
UW: 25.0% down · 7.5% · 30yr · 1.5% tax · 5.0% vac · 8.0% maint · 8.0% mgmt
Financing live
Cash to close
- Down payment
- $1,475
- Closing costs
- $177
- Reserves months
- —
- Total cash needed
- —
Loan-product check · same deal, 3 products live
Conventional
25% down · 7.5% · 30yr
- Down + closing
- —
- Monthly P&I
- —
- Monthly cashflow
- —
- DSCR
- —
- Eligible?
- —
Personal DTI + credit; lowest rate.
DSCR
20% down · 8.5% · 30yr
- Down + closing
- —
- Monthly P&I
- —
- Monthly cashflow
- —
- DSCR
- —
- Eligible?
- —
No personal income docs; deal must DSCR.
Hard money
10% down · 12.0% · 12mo
- Down + closing
- —
- Monthly P&I
- —
- Monthly cashflow
- —
- DSCR
- —
- Eligible?
- —
Short-term bridge; refi at stabilization.
Rent comps 1 comps
| Address | Beds | Baths | Sqft | Rent | $/sqft | DOM | Units | Dist |
|---|---|---|---|---|---|---|---|---|
| 4915 U.S. 80 Selma, AL | 3.0 | 2.0 | 1050 | $1,000 | $0.95 | 43d | 1 | 0.43mi |
Listing history 18 events
-
2026-06-19days on market $5,900 Active 32 DOM
-
2026-06-18days on market $5,900 Active 31 DOM
-
2026-06-17days on market $5,900 Active 30 DOM
-
2026-06-16days on market $5,900 Active 29 DOM
-
2026-06-15days on market $5,900 Active 28 DOM
-
2026-06-14days on market $5,900 Active 26 DOM
-
2026-06-12days on market $5,900 Active 25 DOM
-
2026-06-09days on market $5,900 Active 22 DOM
-
2026-06-08days on market $5,900 Active 21 DOM
-
2026-06-07days on market $5,900 Active 20 DOM
-
2026-06-07days on market $5,900 Active 19 DOM
-
2026-06-04days on market $5,900 Active 16 DOM
-
2026-06-02days on market $5,900 Active 15 DOM
-
2026-06-01days on market $5,900 Active 14 DOM
-
2026-05-31days on market $5,900 Active 13 DOM
-
2026-05-31days on market $5,900 Active 12 DOM
-
2026-05-18$14,900 Active
-
2012-08-30soldstatus $25,000
ⓘ Source: listings_history table (triggers on properties + properties_extension) + one-shot
backfill from property_details.listing_events for pre-trigger history.
Tax reassessment forecast AL · Resets to sale price
- Current annual tax
- $128 · $11/mo
- Projected year-2 tax
- $128 · $11/mo
- Expected delta
- $0/yr ($0/mo · 0.0%)
ⓘ Screening estimate from a state-policy table — verify with the county assessor before closing.
Climate risk First Street
- Flood 1/10 Low FEMA zone X (unshaded) · 0% chance over 30 yrs
- Wildfire 4/10 Moderate
- Heat 8/10 Severe 7 d/yr ≥108°F today · 20 d/yr by 30 yrs out
- Wind 8/10 Severe 80% chance of damaging wind over 30 yrs
- Air quality 2/10 Low 0 unhealthy d/yr today · 1 by 30 yrs out
Nearby sold comps map
Loading sold comps map…
Walkable amenities ~0.75 mi
Loading nearby amenities…
Taxation est. · year 1
- Rental income
- $12,000
- − Mortgage interest
- −$330
- − Property taxes
- −$128
- − Insurance
- −$30
- − Repairs & maintenance
- −$960
- − Management
- −$960
- − Depreciation
- −$172
- Taxable income
- $9,420
- Est. tax owed @ 24.0%
- −$2,261
- After-tax cash flow
- $6,690/yr
For passive investors: Depreciation is non-cash, so a rental often shows a tax loss while cash-flowing — sheltering income. Rental losses are passive: they offset passive income freely, and up to $25,000/yr can offset ordinary (W-2) income if you actively participate and your MAGI is under $100k (phasing out to $0 by $150k); unused losses carry forward. On sale, claimed depreciation is recaptured at up to 25%, and gains may owe capital-gains tax (a 1031 exchange can defer both). Figures are a year-1 estimate at your 24.0% rate — not tax advice; consult a CPA.
Schools (NCES district)
- District
- Dallas County
- NCES district ID
- 0101110
- Math proficiency
- 2% ▼ -28.00%
- Reading proficiency
- 22% ▼ -7.00%
- Median HH income
- $32,660
- Composite
- 9.54/100
- National rank
- #9847
- State rank
- #115 of 129 in AL
Livability — Selmont-West Selmont
No livability data for this city. (Only ~50 U.S. cities are tracked.)
Census & demographics
- Population (ZIP)
- 22,358
Population outlook (Dallas County) Hauer SSP2
- Today (2025)
- 35,464 people
- By 2030
- 32,631 · -8.0%
- By 2040
- 27,246 · -23.2%
- By 2050
- 22,691 · -36.0%
- By 2075
- 14,867 · -58.1%
- By 2100
- 10,285 · -71.0%
Race, ethnicity, and origin ACS 2023
- Neighborhood character
- Predominantly Black (69%)
- Race & ethnicity
- Black 69% White 28% Hispanic / Latino 2%
- Common ancestry
- Serbian 1% Lithuanian 1% Slovak 1%
- Foreign-born
- 2% · Canada
- Languages at home
- 98% English-only · Spanish 1%
Political lean MEDSL · Dallas
- 2024 margin
- Solid D (+32.5) · D 65.9% · R 33.4%
- 2008→2024 swing
- -2.0pp toward R · 2008: 34.5pp · 2024: 32.5pp
- All cycles
- 2024: D+32.5 2020: D+37.5 2016: D+37.6 2012: D+39.7 2008: D+34.5
Not yet ingested
- Civics
- —
Market trends
- HPI YoY
- ▼ -11.98%
- Current HPI
- 176.6034
- Rent YoY
- —
- Metro
- —
- State GDP YoY
- ▲ 2.94%
- F500 in state
- 4
Industry mix (Fortune 500 HQ in AL)
| Industry | F500 HQs | Revenue |
|---|---|---|
| Financial Services | 1 | $8B |
|
||
| Healthcare | 1 | $5B |
|
||
Price history
-40.4% since first listed2 events — show timeline
- 2026-05-18 Listed $14,900 Greater Alabama MLS
- 2012-08-30 Sold (Public Records) $25,000 Public Records
Property tax history
-8.0%/yrLatest (2023): $128 · +6.2% YoY. Source: county tax records.
Cash-flow waterfall
monthlySold comps — $/sqft
last 12 mo · ≤1 miLoading sold comps…