1720 Cornell Dr · Augusta-Richmond County consolidated government (balance), GA
Flood risk 1/10 · Minimal
- FEMA flood zone
- X (unshaded)
- Chance of flooding over 30 yrs
- 0.0%
- Est. flood insurance / yr
- $507 – $1,088
Fire risk 1/10 · Minimal
- Est. fire insurance / yr
- $963 – $1,789
Heat risk 7/10 · Major
- Hot days now (above 108°F)
- 7 days/yr
- Hot days in 30 yrs
- 17 days/yr
Wind risk 6/10 · Moderate
- Chance of severe wind over 30 yrs
- 66.0%
Air-quality risk 4/10 · Minor
- Unhealthy air days now
- 4 days/yr
- Unhealthy air days in 30 yrs
- 4 days/yr
Risk factors via First Street. Map © Google.
Why this score? — see what drove the C+ grade
The composite is a weighted blend of 9 inputs, each scored 0–100. Each bar is that input's sub-score; the figure is the points it added to the 100-point composite (weight × sub-score).
- Cash flow +25.4/30.0
- ARV discount +15.0/15.0
- DSCR +8.4/10.0
- 1% rule +6.0/10.0
- Rent growth +3.6/5.0
- Livability +2.5/5.0
- Condition / age +2.5/5.0
- Schools +1.3/10.0
- Appreciation +0.0/10.0
$140,000
🖨 Deal sheet 📄 Offer letter ✓ Due diligence
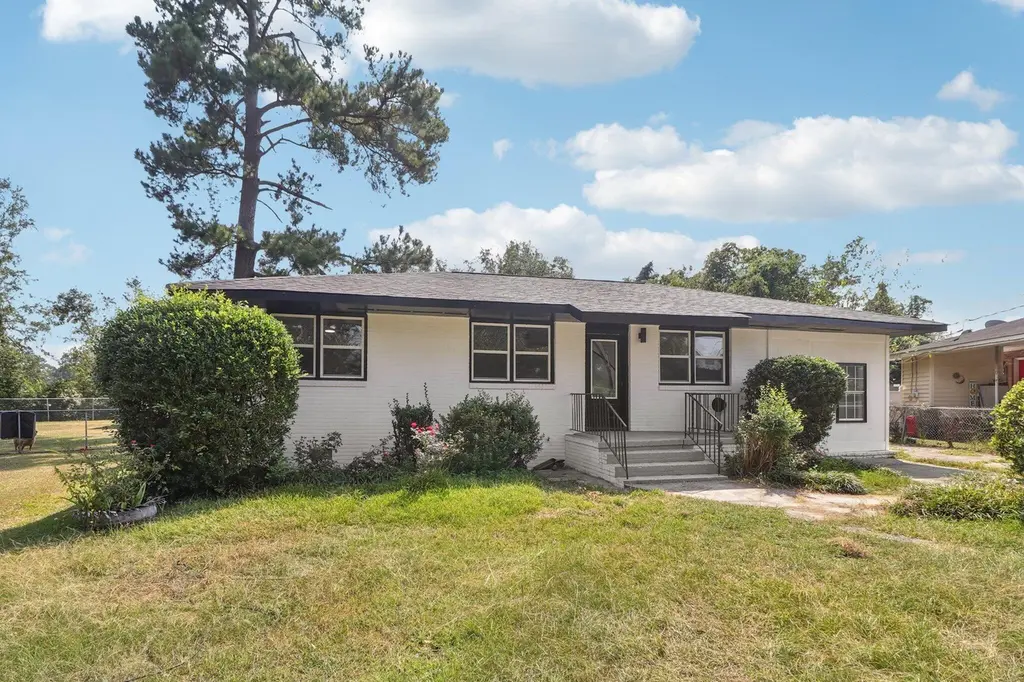
Listing remarks
Fully Renovated & Move-In Ready! This 1,584-sq-ft home has been beautifully updated inside and out, offering modern comfort in a quiet neighborhood. Enjoy peace of mind with a brand-new roof, new water heater, and all-new appliances. The bright interior features fresh finishes, a versatile bonus room, and a 4th bedroom that's perfect for an office, nursery, or flex space. Out back, you'll find a manageable yard that's easy to maintain — ideal for relaxing without the upkeep. Every detail has been thoughtfully refreshed so you can move right in and make it your own.
Key facts
- 0.36 acre lot
- Built 1955
Neighborhood map
What this means for you Summary
Snapshot
- This is a 3-bed/2.0-bath single-family listed at $140k.
Deal economics
- At list price, monthly cash flow is $323 ($4k/yr) — positive.
- The deal already cash-flows at list — no discount required.
- Meets the 1% rule at list price ($2k rent vs $140k).
- Cap rate 9.1% vs local median 5.3% in Augusta-Richmond County consolidated government (balance) — top-decile yield for the area; either an underpriced asset or a hidden risk that comps aren't pricing in. Stress-test before assuming the spread holds.
Location & tenants
- Location reads: area grade C — affects rentability + tenant quality, not the cash-flow math above.
- Richmond County (urban): math 12% / reading 20% proficiency, ranked #154 of 174 in GA (top 88%) — low school quality limits family demand, transient renter base, plan for 1-2y turnover; 72% free/reduced lunch — lower-income household profile, screen leases tightly.
- Zoned schools: Wilkinson Gardens Elementary School (math 2% / reading 8%, grade F, #1,160 of 1,228 statewide, top 98%, 466 students, 98% FRL) — zoned schools average 98% FRL vs 72% district-wide (26 pts higher); higher-poverty schools than district average — tighter screening recommended.
- Market conditions: Rents rising fast (+4.3%/yr); 222 active listings in the ZIP; 40 comparable units currently listed for rent nearby; rentals lingering (median 44d on market — plan ~5-8 weeks vacancy on turnover, expect pricing pressure); 52% of comp listings sitting > 30 days — soft ceiling on asking rent; 561 units permitted in Richmond County in 2024 (0 in 5+ unit buildings).
- This rent runs 40% of the median local income ($47k/yr) — at the standard rent-burdened threshold; future hikes will face affordability resistance.
Forward outlook
- Local home prices are declining (-3.0%/yr); year-one equity from $968 of loan paydown is wiped out by about $4k of value loss. Plan a longer hold.
- Richmond County population projected to shrink 5% by 2050 — rents likely to lag national; underwrite the cash flow, not the appreciation.
- At projected returns (-3.0% appreciation + 4.3% rent growth), your $39k cash investment doubles in ~10 years — after that, you're playing with house money.
Negotiation context
- Only 0 days on market — expect competitive offers; lowballing is unlikely to land.
- 7 sale attempts since 2y ago with the ask held roughly flat each time — persistent listings suggest the price (not the market) is what's stuck; bring a comps-based counter.
Risks & watch-outs
- Watch-outs: built in 1955 — expect roof / HVAC / electrical / plumbing capex.
- Climate carrying-cost: major wind risk, 66% chance of damaging wind over 30y; extreme-heat days projected 7→17/yr by 2055 (HVAC capex compounding) — expect insurance premiums to compound above CPI over the hold.
Questions for the listing agent
- Built in 1955 — when were the roof, HVAC, electrical panel, plumbing, and water heater last replaced?
- Is there a deadline driving the sale (1031 exchange, divorce, estate, relocation)? That informs how much negotiation room exists.
- What's the average days-on-market for RENTAL listings here right now (not sales)? A rising rental-DOM trend means longer vacancies and softer asking-rent achievability than the comps imply.
- What's the recent tenant-quality profile in this submarket — average credit score on applications, eviction rate, late-payment / NSF rate, and stable-employment percentage? A property-management company in the area should have these aggregated.
- How much new for-sale + rental construction is in the pipeline within 1–3 miles? Heavy new supply typically softens prices + rents 12–24 months out; constrained supply supports both.
Investment metrics
- 1% rule
- 1.10% ✓
- Cap rate
- 9.06%
- Cash-on-cash
- 9.89%
- DSCR
- 1.44
- GRM
- 7.6
CMA / ARV
- ARV (on-the-fly)
- $220,176
- Comps found
- 12
Show comp detail 12 sales within ~0.75 mi
| Address | Dist | Beds/Ba | Sqft | Sold | Price | $/sf | Match |
|---|---|---|---|---|---|---|---|
| 2010 Cook Rd | 0.29mi | 3/1.0 | 1,560 (-2%) | 13mo | $101,834 | $65 | 69 |
| 1745 Oak Dr | 0.50mi | 4/2.0 (+1) | 1,574 (-1%) | 9mo | $218,000 | $139 | 63 |
| 1731 Oak Dr | 0.50mi | 3/2.0 | 1,437 (-9%) | 3mo | $120,000 | $84 | 59 |
| 2280 Raleigh Dr | 0.71mi | 3/2.0 | 1,500 (-5%) | 6mo | $180,000 | $120 | 53 |
| 1750 Kings Wood Dr | 0.53mi | 3/1.0 | 1,482 (-6%) | 12mo | $220,000 | $148 | 51 |
| 1506 Myrtle Ln | 0.67mi | 3/2.0 | 1,768 (+12%) | 7mo | $298,000 | $169 | 44 |
| 1535 Essie Mcintyre Blvd. Blvd | 0.59mi | 3/2.0 | 1,457 (-8%) | 20mo | $148,700 | $102 | 42 |
| 1508 Myrtle Ln | 0.65mi | 2/1.0 (-1) | 1,386 (-12%) | 1mo | $199,900 | $144 | 39 |
| 2240 Darlington Dr | 0.58mi | 3/2.0 | 1,375 (-13%) | 15mo | $170,000 | $124 | 38 |
| 1706 King Woods Dr | 0.56mi | 3/1.5 | 1,379 (-13%) | 21mo | $230,200 | $167 | 33 |
| 1822 Kissingbower RD Rd | 0.69mi | 3/1.5 | 1,810 (+14%) | 12mo | $140,000 | $77 | 32 |
| 2284 Darlington Dr | 0.74mi | 3/2.0 | 1,428 (-10%) | 22mo | $215,900 | $151 | 31 |
Match score weights: distance 35% · size 25% · config 20% · recency 20%. Top-matched comps best support the ARV.
Projected returns pro-forma
-3.0% appreciation · 4.29% rent growth · sell at horizon
- IRR
- -0.1%
- Equity multiple
- 1.00×
- Total profit
- $-104
- Equity at exit
- $20,874
- IRR
- 10.8%
- Equity multiple
- 1.89×
- Total profit
- $34,870
- Equity at exit
- $12,105
Cash invested: $39,200 (down + closing). Projections, not guarantees.
Landlord ↔ Tenant lean methodology
- Overall (STATE)
- 90 Strongly Landlord-Friendly
- State Georgia
- 90 Strongly Landlord-Friendly · R+3
- County
- — inherits STATE
- City
- — inherits STATE
ZIP-level market 30904
- Rents YoY
- 4.3%
- Active inventory
- 222
- Price-to-rent
- 7.6×
Monthly cashflow live
- Estimated rent
- $1,544 high interval (Pro) →
- Mortgage (P&I)
- −$734
- Tax from tax record
- −$105 /mo · $1,254/yr
- Insurance
- −$58
- HOA
- −$0
- Vacancy / Maint / Mgmt
- −$324
- Net cashflow
- $323
Break-even live
UW: 25.0% down · 7.5% · 30yr · 1.5% tax · 5.0% vac · 8.0% maint · 8.0% mgmt
Financing live
Cash to close
- Down payment
- $35,000
- Closing costs
- $4,200
- Reserves months
- —
- Total cash needed
- —
Loan-product check · same deal, 3 products live
Conventional
25% down · 7.5% · 30yr
- Down + closing
- —
- Monthly P&I
- —
- Monthly cashflow
- —
- DSCR
- —
- Eligible?
- —
Personal DTI + credit; lowest rate.
DSCR
20% down · 8.5% · 30yr
- Down + closing
- —
- Monthly P&I
- —
- Monthly cashflow
- —
- DSCR
- —
- Eligible?
- —
No personal income docs; deal must DSCR.
Hard money
10% down · 12.0% · 12mo
- Down + closing
- —
- Monthly P&I
- —
- Monthly cashflow
- —
- DSCR
- —
- Eligible?
- —
Short-term bridge; refi at stabilization.
Rent comps 40 comps
| Address | Beds | Baths | Sqft | Rent | $/sqft | DOM | Units | Dist |
|---|---|---|---|---|---|---|---|---|
| 2128 Roosevelt Dr Augusta, GA | 3.0 | 2.0 | 1050 | $1,340 | $1.28 | 23d | 1 | 0.39mi |
| 1914 1/2 Kratha Dr Augusta, GA | 2.0 | 1.0 | 1400 | $995 | $0.71 | 13d | 1 | 0.57mi |
| 1712 Morgan St Augusta, GA | 3.0 | 1.0 | 1209 | $1,330 | $1.10 | 23d | 1 | 0.58mi |
| 1712 Kissingbower Rd Augusta, GA | 2.0 | 1.0 | 1072 | $1,400 | $1.31 | 13d | 1 | 0.59mi |
| 1719 Kissingbower Rd Augusta, GA | 2.0 | 1.0 | 1185 | $1,195 | $1.01 | 21d | 1 | 0.62mi |
| 1508 Heard Ave Augusta, GA | 3.0 | 2.0 | 1314 | $1,400 | $1.07 | 43d | 1 | 0.63mi |
| 1509 Troupe St Augusta, GA | 3.0 | 2.0 | 1200 | $1,695 | $1.41 | 13d | 1 | 0.67mi |
| 2201 Walden Dr Unit DRIVEA2 Augusta, GA | 2.0 | 1.5 | 1063 | $1,050 | $0.99 | 43d | 1 | 0.70mi |
| 2201 Walden Dr Unit DRIVEB2 Augusta, GA | 2.0 | 1.5 | 1063 | $1,100 | $1.03 | 43d | 1 | 0.70mi |
| 2201 Walden Dr Augusta, GA | 2.0 | 1.0 | 1063 | $1,100 | $1.03 | 43d | 1 | 0.70mi |
| 1613 Pendleton Rd Augusta, GA | 3.0 | 2.0 | 1418 | $1,695 | $1.20 | 13d | 1 | 0.72mi |
| 1432 Heard Ave Augusta, GA | 3.0 | 2.0 | 1278 | $1,500 | $1.17 | 43d | 1 | 0.77mi |
| 1812 Slaton St Augusta, GA | 2.0 | 2.0 | 1615 | $1,665 | $1.03 | 23d | 10 | 0.81mi |
| 2219 Archer Augusta, GA | 2.0 | 2.0 | 1103 | $1,495 | $1.36 | 43d | 1 | 0.84mi |
| 2221 Archer LN Augusta, GA | 2.0 | 2.0 | 1103 | $1,495 | $1.36 | 43d | 1 | 0.85mi |
| 2139 Holt St Augusta, GA | 3.0 | 2.0 | 1611 | $1,550 | $0.96 | 43d | 1 | 0.87mi |
| 2139 Holt St Augusta, GA | 3.0 | 2.0 | 1611 | $1,475 | $0.92 | 23d | 1 | 0.87mi |
| 2031 Wrightsboro Rd Augusta, GA | 2.0 | 2.0 | 1240 | $1,750 | $1.41 | 43d | 1 | 0.90mi |
| 2128 Grand Blvd Augusta, GA | 3.0 | 1.0 | 1150 | $1,150 | $1.00 | 43d | 1 | 0.93mi |
| 2240 Walden Dr Augusta, GA | 3.0 | 2.0 | 1107 | $1,495 | $1.35 | 23d | 1 | 0.99mi |
| 2120 Whitney South Dr Augusta, GA | 2.0 | 2.0 | 1118 | $1,500 | $1.34 | 43d | 1 | 1.00mi |
| 2120 Whitney South Dr Augusta, GA | 2.0 | 2.0 | 1118 | $1,500 | $1.34 | 44d | 1 | 1.00mi |
| 1917 Lazenby Dr Augusta, GA | 3.0 | 2.0 | 1606 | $1,300 | $0.81 | 44d | 1 | 1.02mi |
| 1917 Lazenby Dr Augusta, GA | 3.0 | 2.0 | 1606 | $1,300 | $0.81 | 43d | 1 | 1.02mi |
| 19 Trapp Ct Unit 19 Augusta, GA | 2.0 | 1.5 | 1050 | $995 | $0.95 | 43d | 1 | 1.03mi |
| 1315 Merry St Augusta, GA | 3.0 | 2.0 | 1610 | $1,450 | $0.90 | 23d | 1 | 1.05mi |
| 2730 Lakewood Dr Augusta, GA | 3.0 | 1.5 | 1460 | $1,550 | $1.06 | 23d | 1 | 1.06mi |
| 2730 Lakewood Dr Augusta, GA | 3.0 | 1.5 | 1460 | $1,550 | $1.06 | 43d | 1 | 1.06mi |
| 1812 Central Ave Augusta, GA | 3.0 | 1.5 | 1568 | $2,200 | $1.40 | 23d | 1 | 1.09mi |
| 1812 Central Ave Augusta, GA | 3.0 | 1.5 | 1568 | $2,200 | $1.40 | 43d | 1 | 1.09mi |
| 1812 Central Ave Unit 1 Augusta, GA | 3.0 | 1.5 | 1528 | $2,600 | $1.70 | 43d | 1 | 1.09mi |
| 1861 Central Ave Unit A Augusta, GA | 2.0 | 2.5 | 1611 | $1,750 | $1.09 | 43d | 1 | 1.10mi |
| 1861 Central Ave Unit A Augusta, GA | 2.0 | 2.5 | 1611 | $1,750 | $1.09 | 23d | 1 | 1.10mi |
| 1804 Central Ave Augusta, GA | 2.0 | 1.0 | 1200 | $1,100 | $0.92 | 23d | 1 | 1.10mi |
| 1326 Wingfield St Augusta, GA | 2.0 | 1.0 | 1507 | $1,700 | $1.13 | 13d | 1 | 1.13mi |
| 2020 Garr Dr Augusta, GA | 3.0 | 1.0 | 1100 | $1,200 | $1.09 | 13d | 1 | 1.21mi |
| 1480 Wrightsboro Rd Augusta, GA | 1.0–3.0 | 1.0–2.0 | 1046 | $2,375 | $2.27 | 21d | 13 | 1.25mi |
| 2224 Queens Way Augusta, GA | 2.0 | 1.0 | 1239 | $995 | $0.80 | 43d | 1 | 1.32mi |
| 1105 Merry St Augusta, GA | 3.0 | 1.0 | 1281 | $1,350 | $1.05 | 23d | 1 | 1.35mi |
| 1549 Craig St Unit 00 1559 Augusta, GA | 3.0 | 3.0 | 1359 | $1,600 | $1.18 | 43d | 1 | 1.44mi |
Listing history 19 events
-
2025-12-23soldstatus $130,000
-
2025-11-25historical
-
2025-11-24historical
-
2025-11-24historical
-
2025-11-06$140,000
-
2025-11-06$140,000
-
2025-10-31historical
-
2025-10-19price $145,000
-
2025-10-15price $152,500
-
2025-10-01price $162,500
-
2025-09-20$165,000 New
-
2024-10-31historical
-
2024-10-31historical
-
2024-10-12$81,000
-
2024-10-12$81,000
-
2024-08-19historical
-
2024-08-19historical
-
2024-08-01$81,000
-
2024-08-01$81,000
ⓘ Source: listings_history table (triggers on properties + properties_extension) + one-shot
backfill from property_details.listing_events for pre-trigger history.
Tax reassessment forecast GA · Resets to sale price
- Current annual tax
- $1,254 · $105/mo
- Projected year-2 tax
- $1,288 · $107/mo
- Expected delta
- +$34/yr (+$3/mo · 2.7%)
ⓘ Screening estimate from a state-policy table — verify with the county assessor before closing.
Climate risk First Street
- Flood 1/10 Low FEMA zone X (unshaded) · 0% chance over 30 yrs
- Wildfire 1/10 Low
- Heat 7/10 Severe 7 d/yr ≥108°F today · 17 d/yr by 30 yrs out
- Wind 6/10 Major 66% chance of damaging wind over 30 yrs
- Air quality 4/10 Moderate 4 unhealthy d/yr today · 4 by 30 yrs out
Nearby sold comps map
Loading sold comps map…
Walkable amenities ~0.75 mi
Loading nearby amenities…
Taxation est. · year 1
- Rental income
- $18,532
- − Mortgage interest
- −$7,842
- − Property taxes
- −$1,254
- − Insurance
- −$700
- − Repairs & maintenance
- −$1,483
- − Management
- −$1,483
- − Depreciation
- −$4,073
- Taxable income
- $1,698
- Est. tax owed @ 24.0%
- −$407
- After-tax cash flow
- $3,469/yr
For passive investors: Depreciation is non-cash, so a rental often shows a tax loss while cash-flowing — sheltering income. Rental losses are passive: they offset passive income freely, and up to $25,000/yr can offset ordinary (W-2) income if you actively participate and your MAGI is under $100k (phasing out to $0 by $150k); unused losses carry forward. On sale, claimed depreciation is recaptured at up to 25%, and gains may owe capital-gains tax (a 1031 exchange can defer both). Figures are a year-1 estimate at your 24.0% rate — not tax advice; consult a CPA.
Schools (NCES district)
- District
- Richmond County
- NCES district ID
- 1304380
- Math proficiency
- 12% ▼ -9.00%
- Reading proficiency
- 20% ▼ -6.00%
- Median HH income
- $38,069
- Composite
- 13.43/100
- National rank
- #9524
- State rank
- #154 of 174 in GA
Livability — Augusta-Richmond County consolidated government (balance)
No livability data for this city. (Only ~50 U.S. cities are tracked.)
Census & demographics
- Census place
- Augusta-Richmond County consolidated government (balance), GA
- County
- Richmond County · 190,917 people
- City population
- 154,035
- Metro
- Augusta-Richmond County, GA-SC
- Population (ZIP)
- 23,400
- Household income
- $46,696
- Rent vs Own
- Severe rent burden
- 1594.0
Population outlook (Richmond County) Hauer SSP2
- Today (2025)
- 200,753 people
- By 2030
- 200,232 · -0.3%
- By 2040
- 196,813 · -2.0%
- By 2050
- 190,347 · -5.2%
- By 2075
- 172,496 · -14.1%
- By 2100
- 146,284 · -27.1%
Race, ethnicity, and origin ACS 2023
- Neighborhood character
- Diverse neighborhood (Simpson 0.61)
- Race & ethnicity
- Black 47% White 41% Hispanic / Latino 6% Two or more races 6% Asian 2%
- Hispanic origin (detail)
- Mexican 1%
- Common ancestry
- Italian 1% Slovak 1% Romanian 1%
- Foreign-born
- 3% · Canada, South Korea, Jamaica
- Languages at home
- 93% English-only · Spanish 4% Korean 1%
Political lean MEDSL · Richmond
- 2024 margin
- Solid D (+36.1) · D 67.8% · R 31.7%
- 2008→2024 swing
- +4.3pp toward D · 2008: 31.8pp · 2024: 36.1pp
- All cycles
- 2024: D+36.1 2020: D+37.2 2016: D+32.4 2012: D+33.8 2008: D+31.8
Not yet ingested
- Civics
- —
Market trends
- HPI YoY
- ▼ -211.97%
- Current HPI
- 199.0807
- Rent YoY
- ▲ 4.29%
- Metro
- Augusta-Richmond County, GA-SC
- State GDP YoY
- ▲ 2.66%
- F500 in state
- 28
Industry mix (Fortune 500 HQ in GA)
| Industry | F500 HQs | Revenue |
|---|---|---|
| Paper / Packaging | 2 | $29B |
|
||
| Retail | 1 | $160B |
|
||
| Transportation / Logistics | 1 | $91B |
|
||
| Airlines | 1 | $62B |
|
||
| Consumer Goods | 1 | $47B |
|
||
| Utilities | 1 | $25B |
|
||
Price history
+60.5% since first listed19 events — show timeline
- 2025-12-23 Sold (Public Records) $130,000 Public Records
- 2025-11-25 Listing Removed — Hive MLS
- 2025-11-24 Listing Removed — Hive MLS
- 2025-11-24 Listing Removed — Hive MLS
- 2025-11-06 Listed $140,000 Hive MLS
- 2025-11-06 Listed $140,000 Hive MLS
- 2025-10-31 Listing Removed — GAMLS
- 2025-10-19 Price Changed $145,000 GAMLS
- 2025-10-15 Price Changed $152,500 GAMLS
- 2025-10-01 Price Changed $162,500 GAMLS
- 2025-09-20 Listed $165,000 GAMLS
- 2024-10-31 Listing Removed — Hive MLS
- 2024-10-31 Listing Removed — Hive MLS
- 2024-10-12 Listed $81,000 Hive MLS
- 2024-10-12 Listed $81,000 Hive MLS
- 2024-08-19 Listing Removed — Hive MLS
- 2024-08-19 Listing Removed — Hive MLS
- 2024-08-01 Listed $81,000 Hive MLS
- 2024-08-01 Listed $81,000 Hive MLS
Property tax history
+4.2%/yrLatest (2025): $1,254 · -15.9% YoY. Source: county tax records.
Cash-flow waterfall
monthlySold comps — $/sqft
last 12 mo · ≤1 miLoading sold comps…