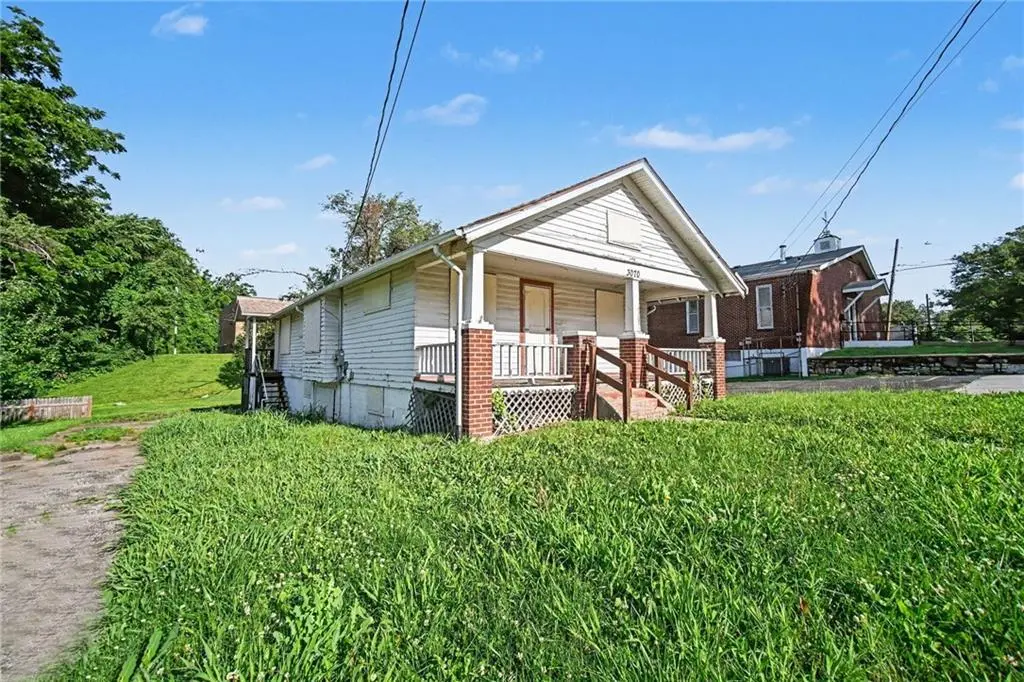
3070 N 33rd St · Kansas City, KS
Flood risk 1/10 · Minimal
- FEMA flood zone
- X (unshaded)
- Chance of flooding over 30 yrs
- 0.0%
- Est. flood insurance / yr
- $473 – $860
Fire risk 1/10 · Minimal
- Est. fire insurance / yr
- $1,154 – $2,142
Heat risk 4/10 · Minor
- Hot days now (above 106°F)
- 7 days/yr
- Hot days in 30 yrs
- 17 days/yr
Wind risk 2/10 · Minimal
- Chance of severe wind over 30 yrs
- —
Air-quality risk 2/10 · Minimal
- Unhealthy air days now
- 2 days/yr
- Unhealthy air days in 30 yrs
- 2 days/yr
Risk factors via First Street. Map © Google.
Why this score? — see what drove the B- grade
The composite is a weighted blend of 9 inputs, each scored 0–100. Each bar is that input's sub-score; the figure is the points it added to the 100-point composite (weight × sub-score).
- Cash flow +30.0/30.0
- 1% rule +10.0/10.0
- DSCR +10.0/10.0
- ARV discount +7.5/15.0
- Livability +3.6/5.0
- Rent growth +2.5/5.0
- Condition / age +2.5/5.0
- Schools +0.9/10.0
- Appreciation +0.0/10.0
$120,000
🖨 Deal sheet 📄 Offer letter ✓ Due diligence
Listing remarks MLS
Fixer-Upper with Big Potential This boarded-up home is priced well below market, offering a great opportunity for buyers ready to put in some work. Perfect for investors or anyone looking to build equity. Bring your vision and make it your own!
Key facts
- Full basement
- 6,055 sq ft lot
- Built 1926
Tags
Property features AI
Finance
- Other: Above-grade finished area reported as 1,136; Below-grade finished area reported as 1,128; Total living area reported as 2,264
- HOA & community: No association fees; No community maintenance provided
Exterior
- Parking: Off-street parking
- Utilities: Public water; Public sewer
- Home design: Single-family residence; Residential property; Bungalow style
- Construction: Composition roof; Other construction materials; Home age approximately 76–100 years
- Exterior features: Lot approximately 50 x 100 feet
Interior
- Bedrooms: 3 bedrooms
- Bathrooms: 2 full bathrooms
- Heating & cooling: Hot water heating; Natural gas heating; No central cooling
- Interior features: Full basement; Bungalow floor plan
Neighborhood map
What this means for you Summary
Snapshot
- This is a 3-bed/1.0-bath single-family listed at $120k.
Deal economics
- At list price, monthly cash flow is $671 ($8k/yr) — positive.
- The deal already cash-flows at list — no discount required.
- Meets the 1% rule at list price ($2k rent vs $120k).
- Recommended offer: $118k (1.5% below list) — sets the bar for market timing.
- Cap rate 13.0% vs local median 4.8% in Kansas City — top-decile yield for the area; either an underpriced asset or a hidden risk that comps aren't pricing in. Stress-test before assuming the spread holds.
Location & tenants
- Location reads 72/100 on livability (#103 in KS) — a middle-class / working-renter tenant base. Strengths: commute A+, cost of living A+, housing A+; Watch: schools F, crime F, employment D-.
- Kansas City (urban): math 8% / reading 15% proficiency, ranked #169 of 169 in KS (top 100%) — low school quality limits family demand, transient renter base, plan for 1-2y turnover; 81% free/reduced lunch — lower-income household profile, screen leases tightly.
- Market conditions: 150 active listings in the ZIP; 369 units permitted in Wyandotte County in 2024 (236 in 5+ unit buildings).
Forward outlook
- Local home prices are declining (-3.0%/yr); year-one equity from $830 of loan paydown is wiped out by about $4k of value loss. Plan a longer hold.
- Wyandotte County population projected at +17% by 2050 — long-run rental-demand tailwind backs the buy-and-hold thesis.
- At projected returns (-3.0% appreciation + 3.0% rent growth), your $34k cash investment doubles in ~6 years — after that, you're playing with house money.
Negotiation context
- It's been on market 16 days — a 2% lower offer ($118k) is reasonable based on typical stale-listing flexibility.
- 4 sale attempts since 23y ago with the ask held roughly flat each time — persistent listings suggest the price (not the market) is what's stuck; bring a comps-based counter.
Risks & watch-outs
- Watch-outs: built in 1926 — expect roof / HVAC / electrical / plumbing capex.
Questions for the listing agent
- Built in 1926 — when were the roof, HVAC, electrical panel, plumbing, and water heater last replaced?
- Is there a deadline driving the sale (1031 exchange, divorce, estate, relocation)? That informs how much negotiation room exists.
- Schools are F-rated, which usually means shorter tenancies and higher turnover. Who's the typical renter profile here, and what's been the actual vacancy rate?
- Crime grade is F in this area — have there been break-ins, vandalism, or insurance claims at this property in the last 3 years? What carrier currently insures it and at what premium?
- What's the average days-on-market for RENTAL listings here right now (not sales)? A rising rental-DOM trend means longer vacancies and softer asking-rent achievability than the comps imply.
- What's the recent tenant-quality profile in this submarket — average credit score on applications, eviction rate, late-payment / NSF rate, and stable-employment percentage? A property-management company in the area should have these aggregated.
- How much new for-sale + rental construction is in the pipeline within 1–3 miles? Heavy new supply typically softens prices + rents 12–24 months out; constrained supply supports both.
Investment metrics
- 1% rule
- 1.56% ✓
- Cap rate
- 13.01%
- Cash-on-cash
- 23.98%
- DSCR
- 2.07
- GRM
- 5.3
CMA / ARV
No comps found within radius.
Projected returns pro-forma
-3.0% appreciation · 3.0% rent growth · sell at horizon
- IRR
- 17.2%
- Equity multiple
- 1.69×
- Total profit
- $23,336
- Equity at exit
- $17,892
- IRR
- 25.7%
- Equity multiple
- 3.25×
- Total profit
- $75,454
- Equity at exit
- $10,375
Cash invested: $33,600 (down + closing). Projections, not guarantees.
Landlord ↔ Tenant lean methodology
- Overall (STATE)
- 83 Strongly Landlord-Friendly
- State Kansas
- 83 Strongly Landlord-Friendly · R+10
- County
- — inherits STATE
- City
- — inherits STATE
ZIP-level market 66104
- Home prices YoY
- -20.1%
- Active inventory
- 150
- Price-to-rent
- 5.3×
Monthly cashflow live
- Estimated rent
- $1,875 medium interval (Pro) →
- Mortgage (P&I)
- −$629
- Tax from tax record
- −$131 /mo · $1,567/yr
- Insurance
- −$50
- HOA
- −$0
- Vacancy / Maint / Mgmt
- −$394
- Net cashflow
- $671
Break-even live
UW: 25.0% down · 7.5% · 30yr · 1.5% tax · 5.0% vac · 8.0% maint · 8.0% mgmt
Financing live
Cash to close
- Down payment
- $30,000
- Closing costs
- $3,600
- Reserves months
- —
- Total cash needed
- —
Loan-product check · same deal, 3 products live
Conventional
25% down · 7.5% · 30yr
- Down + closing
- —
- Monthly P&I
- —
- Monthly cashflow
- —
- DSCR
- —
- Eligible?
- —
Personal DTI + credit; lowest rate.
DSCR
20% down · 8.5% · 30yr
- Down + closing
- —
- Monthly P&I
- —
- Monthly cashflow
- —
- DSCR
- —
- Eligible?
- —
No personal income docs; deal must DSCR.
Hard money
10% down · 12.0% · 12mo
- Down + closing
- —
- Monthly P&I
- —
- Monthly cashflow
- —
- DSCR
- —
- Eligible?
- —
Short-term bridge; refi at stabilization.
Listing history 12 events
-
2026-06-18days on market $120,000 Active 16 DOM
-
2026-06-17days on market $120,000 Active 15 DOM
-
2026-06-16days on market $120,000 Active 14 DOM
-
2026-06-15days on market $120,000 Active 13 DOM
-
2026-06-13days on market $120,000 Active 11 DOM
-
2026-06-13days on market $120,000 Active 10 DOM
-
2026-06-09days on market $120,000 Active 7 DOM
-
2026-06-08days on market $120,000 Active 6 DOM
-
2026-06-07days on market $120,000 Active 5 DOM
-
2026-06-05days on market $120,000 Active 2 DOM
-
2026-06-03remarks 615-char remark
-
2026-06-03$120,000 Active 1 DOM
ⓘ Source: listings_history table (triggers on properties + properties_extension) + one-shot
backfill from property_details.listing_events for pre-trigger history.
Tax reassessment forecast KS · Resets to sale price
- Current annual tax
- $1,567 · $131/mo
- Projected year-2 tax
- $1,692 · $141/mo
- Expected delta
- +$125/yr (+$10/mo · 8.0%)
ⓘ Screening estimate from a state-policy table — verify with the county assessor before closing.
Climate risk First Street
- Flood 1/10 Low FEMA zone X (unshaded) · 0% chance over 30 yrs
- Wildfire 1/10 Low
- Heat 4/10 Moderate 7 d/yr ≥106°F today · 17 d/yr by 30 yrs out
- Wind 2/10 Low
- Air quality 2/10 Low 2 unhealthy d/yr today · 2 by 30 yrs out
Nearby sold comps map
Loading sold comps map…
Walkable amenities ~0.75 mi
Loading nearby amenities…
Taxation est. · year 1
- Rental income
- $22,501
- − Mortgage interest
- −$6,722
- − Property taxes
- −$1,567
- − Insurance
- −$600
- − Repairs & maintenance
- −$1,800
- − Management
- −$1,800
- − Depreciation
- −$3,491
- Taxable income
- $6,521
- Est. tax owed @ 24.0%
- −$1,565
- After-tax cash flow
- $6,492/yr
For passive investors: Depreciation is non-cash, so a rental often shows a tax loss while cash-flowing — sheltering income. Rental losses are passive: they offset passive income freely, and up to $25,000/yr can offset ordinary (W-2) income if you actively participate and your MAGI is under $100k (phasing out to $0 by $150k); unused losses carry forward. On sale, claimed depreciation is recaptured at up to 25%, and gains may owe capital-gains tax (a 1031 exchange can defer both). Figures are a year-1 estimate at your 24.0% rate — not tax advice; consult a CPA.
Schools (NCES district)
- District
- Kansas City
- NCES district ID
- 2007950
- Math proficiency
- 8% ▼ -10.00%
- Reading proficiency
- 15% ▼ -4.00%
- Median HH income
- $34,774
- Composite
- 9.38/100
- National rank
- #9856
- State rank
- #169 of 169 in KS
Livability — Kansas City
- Score
- 72/100
- State rank
- #103
- US rank
- #6054
Category grades
Schools grade is shown separately in the Schools card above.
Census & demographics
- Census place
- Kansas City, KS
- City population
- 130,206
- Population (ZIP)
- 26,820
Population outlook (Wyandotte County) Hauer SSP2
- Today (2025)
- 177,063 people
- By 2030
- 183,212 · +3.5%
- By 2040
- 195,697 · +10.5%
- By 2050
- 207,897 · +17.4%
- By 2075
- 236,169 · +33.4%
- By 2100
- 255,790 · +44.5%
Race, ethnicity, and origin ACS 2023
- Neighborhood character
- Highly diverse neighborhood (Simpson 0.72)
- Race & ethnicity
- Hispanic / Latino 37% Black 32% White 20% Two or more races 15% Asian 5% Native American 3%
- Hispanic origin (detail)
- Mexican 28%
- Common ancestry
- Iranian 1%
- Foreign-born
- 20% · Canada, Philippines
- Languages at home
- 61% English-only · Spanish 32% Other Asian/Pacific 4% Vietnamese 1%
Political lean MEDSL · Wyandotte
- 2024 margin
- Strong D (+23.9) · D 61.1% · R 37.3% · Other 1.6%
- 2008→2024 swing
- -17.0pp toward R · 2008: 40.9pp · 2024: 23.9pp
- All cycles
- 2024: D+23.9 2020: D+30.9 2016: D+29.1 2012: D+36.4 2008: D+40.9
Not yet ingested
- Civics
- —
Market trends
- HPI YoY
- ▼ -131.50%
- Current HPI
- 523.3956
- Rent YoY
- —
- Metro
- —
- State GDP YoY
- —
- F500 in state
- 0
Price history
+570.4% since first listed10 events — show timeline
- 2026-06-02 Listed $120,000 Heartland MLS as Distributed by MLS Grid
- 2025-06-05 Sold (MLS) — Heartland MLS as Distributed by MLS Grid
- 2025-06-03 Sold (Public Records) — Public Records
- 2025-05-01 Pending — Heartland MLS as Distributed by MLS Grid
- 2025-04-25 Listed $99,500 Heartland MLS as Distributed by MLS Grid
- 2011-12-23 Sold (MLS) — Heartland MLS as Distributed by MLS Grid
- 2011-06-20 Listed $15,750 Heartland MLS as Distributed by MLS Grid
- 2004-01-08 Sold (MLS) — Heartland MLS as Distributed by MLS Grid
- 2003-11-03 Listed $17,900 Heartland MLS as Distributed by MLS Grid
- 1999-11-02 Sold (Public Records) — Public Records
Property tax history
+10.4%/yrLatest (2025): $1,567 · +20.8% YoY. Source: county tax records.
Cash-flow waterfall
monthlySold comps — $/sqft
last 12 mo · ≤1 miLoading sold comps…