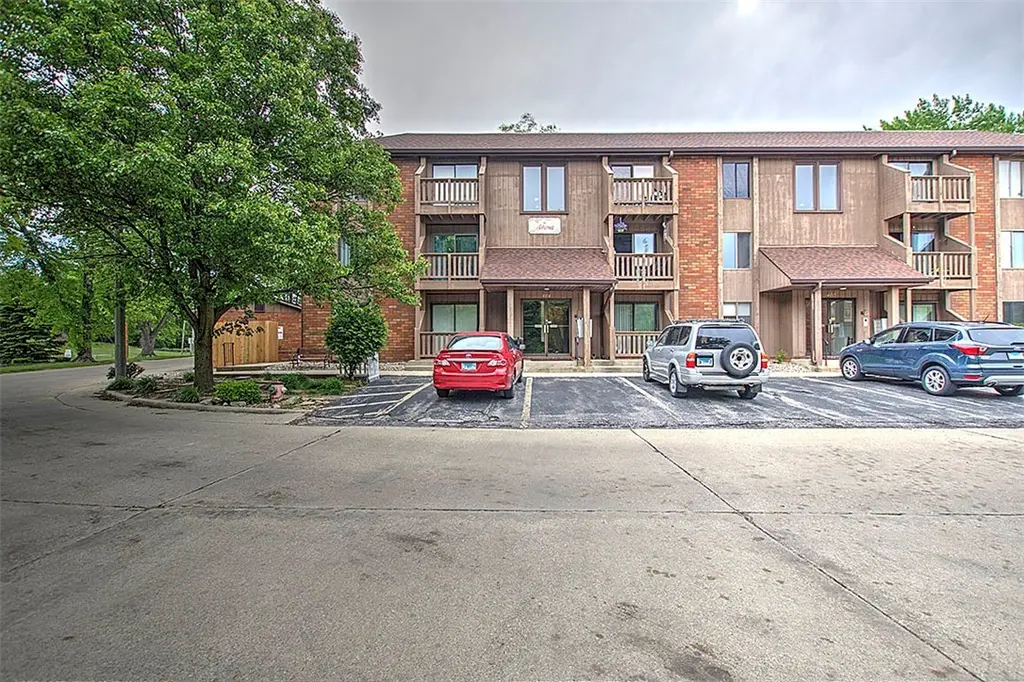
464 Woodside Trl Unit A-2 · Decatur, IL
Flood risk 1/10 · Minimal
- FEMA flood zone
- X (unshaded)
- Chance of flooding over 30 yrs
- 0.0%
- Est. flood insurance / yr
- $507 – $1,088
Fire risk 1/10 · Minimal
- Est. fire insurance / yr
- $804 – $1,492
Heat risk 3/10 · Minor
- Hot days now (above 106°F)
- 7 days/yr
- Hot days in 30 yrs
- 18 days/yr
Wind risk 2/10 · Minimal
- Chance of severe wind over 30 yrs
- 2.0%
Air-quality risk 2/10 · Minimal
- Unhealthy air days now
- 1 days/yr
- Unhealthy air days in 30 yrs
- 1 days/yr
Risk factors via First Street. Map © Google.
Why this score? — see what drove the C- grade
The composite is a weighted blend of 9 inputs, each scored 0–100. Each bar is that input's sub-score; the figure is the points it added to the 100-point composite (weight × sub-score).
- Cash flow +25.8/30.0
- 1% rule +9.1/10.0
- DSCR +8.6/10.0
- Livability +3.0/5.0
- Condition / age +2.8/5.0
- Rent growth +2.5/5.0
- ARV discount +0.9/15.0
- Schools +0.4/10.0
- Appreciation +0.0/10.0
$55,000
🖨 Deal sheet 📄 Offer letter ✓ Due diligence
Listing remarks
Ground-Floor Level Condo - No Stairs - Maintenance free living! One bedroom, one bathroom condo in the well-desired Woodside Trail Condominiums. Recently enhanced with LVP flooring throughout the living space, updated kitchen, and paint.
Key facts
- Ground-floor level
- Updated kitchen
- Lvp flooring
Tags
Property features AI
Finance
- HOA & community: Homeowners association present with a $100 fee
Exterior
- Utilities: Public water; Public sewer
- Home design: Condominium; One-level; 1 story
- Construction: Brick and wood siding exterior; Shingle roof; Slab foundation; Built as a residential condominium
- Exterior features: Deck; Patio; Asphalt road access
Interior
- Kitchen: Dishwasher; Range; Refrigerator
- Bedrooms: Total of 4 rooms
- Bathrooms: 1 full bathroom
- Heating & cooling: Central air conditioning; Natural gas forced-air heating
- Interior features: Dishwasher; Gas water heater; Range; Refrigerator
- Laundry & utility: Laundry on main level
Neighborhood map
What this means for you Summary
Snapshot
- This is a 1-bed/1.0-bath single-family listed at $55k. Condition is rated average.
Deal economics
- At list price, monthly cash flow is $133 ($2k/yr) — positive.
- The deal already cash-flows at list — no discount required.
- Meets the 1% rule at list price ($776 rent vs $55k).
- Cap rate 9.2% vs local median 7.0% in Decatur — top-decile yield for the area; either an underpriced asset or a hidden risk that comps aren't pricing in. Stress-test before assuming the spread holds.
Location & tenants
- Location reads 59/100 on livability (#1,076 in IL) — a working-class tenant base; expect higher turnover. Strengths: cost of living A+, housing A+; Watch: schools F, crime F, amenities F.
- Decatur SD 61 (urban): math 3% / reading 6% proficiency, ranked #605 of 620 in IL (top 98%) — low school quality limits family demand, transient renter base, plan for 1-2y turnover; 73% free/reduced lunch — lower-income household profile, screen leases tightly.
- Market conditions: 193 active listings in the ZIP; 63 units permitted in Macon County in 2024 (0 in 5+ unit buildings).
- This rent is only 14% of the median local income ($66k/yr) — well below the 30% rent-burden line; pricing power to push rent on renewal without tenant pushback.
Forward outlook
- Local home prices are declining (-3.0%/yr); year-one equity from $380 of loan paydown is wiped out by about $2k of value loss. Plan a longer hold.
- Macon County population projected at -24% by 2050 — secular population decline; favor cash flow + early exit over multi-decade hold.
Negotiation context
- Only 8 days on market — expect competitive offers; lowballing is unlikely to land.
- 2 sale attempts; this cycle's ask has dropped $5k (8%) from the opening price — seller is motivated, your offer sets the floor, not the list.
Questions for the listing agent
- What does the HOA fee cover, when was the last increase, and are there any pending special assessments or reserve-fund shortfalls?
- Is there a deadline driving the sale (1031 exchange, divorce, estate, relocation)? That informs how much negotiation room exists.
- Schools are F-rated, which usually means shorter tenancies and higher turnover. Who's the typical renter profile here, and what's been the actual vacancy rate?
- Crime grade is F in this area — have there been break-ins, vandalism, or insurance claims at this property in the last 3 years? What carrier currently insures it and at what premium?
- What's the average days-on-market for RENTAL listings here right now (not sales)? A rising rental-DOM trend means longer vacancies and softer asking-rent achievability than the comps imply.
- What's the recent tenant-quality profile in this submarket — average credit score on applications, eviction rate, late-payment / NSF rate, and stable-employment percentage? A property-management company in the area should have these aggregated.
- How much new for-sale + rental construction is in the pipeline within 1–3 miles? Heavy new supply typically softens prices + rents 12–24 months out; constrained supply supports both.
Investment metrics
- 1% rule
- 1.41% ✓
- Cap rate
- 9.20%
- Cash-on-cash
- 10.37%
- DSCR
- 1.46
- GRM
- 5.9
CMA / ARV
- ARV (median comp)
- $48,005
- List price
- $55,000
- Delta
- 14.57%
- Verdict
- OVERPRICED
- Comps
- 7 within 1.0 mi
Projected returns pro-forma
-3.0% appreciation · 3.0% rent growth · sell at horizon
- IRR
- -0.6%
- Equity multiple
- 0.98×
- Total profit
- $-362
- Equity at exit
- $8,201
- IRR
- 9.2%
- Equity multiple
- 1.71×
- Total profit
- $10,899
- Equity at exit
- $4,755
Cash invested: $15,400 (down + closing). Projections, not guarantees.
Landlord ↔ Tenant lean methodology
- Overall (STATE)
- 43 Moderately Tenant-Leaning
- State Illinois
- 43 Moderately Tenant-Leaning · D+7
- County
- — inherits STATE
- City
- — inherits STATE
ZIP-level market 62521
- Home prices YoY
- -9.0%
- Active inventory
- 193
- Price-to-rent
- 5.9×
Monthly cashflow live
- Estimated rent
- $776 medium interval (Pro) →
- Mortgage (P&I)
- −$288
- Tax est. 1.5%
- −$69 /mo · $825/yr
- Insurance
- −$23
- HOA
- −$100
- Vacancy / Maint / Mgmt
- −$163
- Net cashflow
- $133
Break-even live
UW: 25.0% down · 7.5% · 30yr · 1.5% tax · 5.0% vac · 8.0% maint · 8.0% mgmt
Financing live
Cash to close
- Down payment
- $13,750
- Closing costs
- $1,650
- Reserves months
- —
- Total cash needed
- —
Loan-product check · same deal, 3 products live
Conventional
25% down · 7.5% · 30yr
- Down + closing
- —
- Monthly P&I
- —
- Monthly cashflow
- —
- DSCR
- —
- Eligible?
- —
Personal DTI + credit; lowest rate.
DSCR
20% down · 8.5% · 30yr
- Down + closing
- —
- Monthly P&I
- —
- Monthly cashflow
- —
- DSCR
- —
- Eligible?
- —
No personal income docs; deal must DSCR.
Hard money
10% down · 12.0% · 12mo
- Down + closing
- —
- Monthly P&I
- —
- Monthly cashflow
- —
- DSCR
- —
- Eligible?
- —
Short-term bridge; refi at stabilization.
HOA detail
- Monthly dues
- $100 · $1,200/yr
Listing history 4 events
-
2026-05-13status Pending 237-char remark
-
2026-05-11price $55,000 237-char remark
-
2026-05-05$60,000 Active 237-char remark
-
2025-11-05$45,000 Active
ⓘ Source: listings_history table (triggers on properties + properties_extension) + one-shot
backfill from property_details.listing_events for pre-trigger history.
Climate risk First Street
- Flood 1/10 Low FEMA zone X (unshaded) · 0% chance over 30 yrs
- Wildfire 1/10 Low
- Heat 3/10 Moderate 7 d/yr ≥106°F today · 18 d/yr by 30 yrs out
- Wind 2/10 Low 2% chance of damaging wind over 30 yrs
- Air quality 2/10 Low 1 unhealthy d/yr today · 1 by 30 yrs out
Nearby sold comps map
Loading sold comps map…
Walkable amenities ~0.75 mi
Loading nearby amenities…
Taxation est. · year 1
- Rental income
- $9,314
- − Mortgage interest
- −$3,081
- − Property taxes
- −$825
- − Insurance
- −$275
- − Repairs & maintenance
- −$745
- − Management
- −$745
- − HOA
- −$1,200
- − Depreciation
- −$1,600
- Taxable income
- $843
- Est. tax owed @ 24.0%
- −$202
- After-tax cash flow
- $1,395/yr
For passive investors: Depreciation is non-cash, so a rental often shows a tax loss while cash-flowing — sheltering income. Rental losses are passive: they offset passive income freely, and up to $25,000/yr can offset ordinary (W-2) income if you actively participate and your MAGI is under $100k (phasing out to $0 by $150k); unused losses carry forward. On sale, claimed depreciation is recaptured at up to 25%, and gains may owe capital-gains tax (a 1031 exchange can defer both). Figures are a year-1 estimate at your 24.0% rate — not tax advice; consult a CPA.
Condition & rehab AI · 10 photos
This ground-floor condo in Woodside Trail Condominiums is in average condition with cosmetic updates needed to modernize the kitchen and bathroom and improve the exterior. The property has a maintenance-free living environment and is ready for a fresh renovation to increase its resale and rental value.
Repairs flagged
- Moderate kitchen cabinets — dated and worn
- Moderate kitchen countertops — dated and worn
- Moderate kitchen appliances — dated and worn
- Moderate bathroom fixtures — dated and worn
- Moderate exterior siding — moderate wear
Value-add opportunities
- Both new kitchen cabinets and countertops — modernizes kitchen and increases appeal
- Both new kitchen appliances — modernizes kitchen and increases appeal
- Both new bathroom fixtures — modernizes bathroom and increases appeal
- Both new exterior siding — improves curb appeal and increases value
Renovation cost estimate screening
| Repair item | Severity | Est. cost |
|---|---|---|
| kitchen cabinets · dated and worn | Moderate | $3,000–15,000 |
| kitchen countertops · dated and worn | Moderate | $3,000–15,000 |
| kitchen appliances · dated and worn | Moderate | $3,000–15,000 |
| bathroom fixtures · dated and worn | Moderate | $3,000–15,000 |
| exterior siding · moderate wear | Moderate | $3,000–15,000 |
| Total estimated repair cost · 5 items | $15,000–75,000 |
Value-add ROI direction
- Both new kitchen cabinets and countertops — modernizes kitchen and increases appeal ↑
- Both new kitchen appliances — modernizes kitchen and increases appeal ↑
- Both new bathroom fixtures — modernizes bathroom and increases appeal ↑
- Both new exterior siding — improves curb appeal and increases value ↑
ⓘ Cost ranges are severity-bucket heuristics (US national rule-of-thumb). Get contractor quotes + a written scope before underwriting a rehab budget.
Schools (NCES district)
- District
- Decatur SD 61
- NCES district ID
- 1711850
- Math proficiency
- 3% ▼ -4.00%
- Reading proficiency
- 6% ▼ -6.00%
- Median HH income
- $38,864
- Composite
- 3.99/100
- National rank
- #10059
- State rank
- #605 of 620 in IL
Livability — Decatur
- Score
- 59/100
- State rank
- #1076
- US rank
- #20533
Category grades
Schools grade is shown separately in the Schools card above.
Census & demographics
- Census place
- Decatur, IL
- County
- Macon County · 78,333 people
- City population
- 78,333
- Metro
- Decatur, IL
- Population (ZIP)
- 32,665
- Household income
- $66,337
- Rent vs Own
- Severe rent burden
- 640.0
Population outlook (Macon County) Hauer SSP2
- Today (2025)
- 99,568 people
- By 2030
- 94,973 · -4.6%
- By 2040
- 85,250 · -14.4%
- By 2050
- 75,920 · -23.8%
- By 2075
- 55,962 · -43.8%
- By 2100
- 36,468 · -63.4%
Race, ethnicity, and origin ACS 2023
- Neighborhood character
- Predominantly White (75%)
- Race & ethnicity
- White 75% Black 17% Two or more races 5% Hispanic / Latino 3%
- Common ancestry
- Slovak 3% Romanian 2% Lithuanian 2%
- Foreign-born
- 3% · Canada
- Languages at home
- 96% English-only · Spanish 2% Russian/Polish/Slavic 1% Other Indo-European 0%
Political lean MEDSL · Macon
- 2024 margin
- R (+18.9) · D 39.8% · R 58.7% · Other 1.4%
- 2008→2024 swing
- -20.0pp toward R · 2008: 1.1pp · 2024: -18.9pp
- All cycles
- 2024: R+18.9 2020: R+17.7 2016: R+18.1 2012: R+5.2 2008: D+1.1
Not yet ingested
- Civics
- —
Market trends
- HPI YoY
- ▼ -17.96%
- Current HPI
- 180.9274
- Rent YoY
- —
- Metro
- Decatur, IL
- State GDP YoY
- ▲ 1.59%
- F500 in state
- 60
Industry mix (Fortune 500 HQ in IL)
| Industry | F500 HQs | Revenue |
|---|---|---|
| Insurance | 4 | $201B |
|
||
| Consumer Goods | 4 | $87B |
|
||
| Industrial Machinery | 3 | $64B |
|
||
| Healthcare | 2 | $55B |
|
||
| Retail / Pharmacy | 1 | $148B |
|
||
| Agriculture / Food | 1 | $86B |
|
||
Price history
+22.2% since first listed5 events — show timeline
- 2026-06-01 Sold (MLS) $55,000 CIBR
- 2026-05-13 Pending — CIBR
- 2026-05-11 Price Changed $55,000 CIBR
- 2026-05-05 Listed $60,000 CIBR
- 2025-11-05 Listed $45,000 CIBR
Cash-flow waterfall
monthlySold comps — $/sqft
last 12 mo · ≤1 miLoading sold comps…