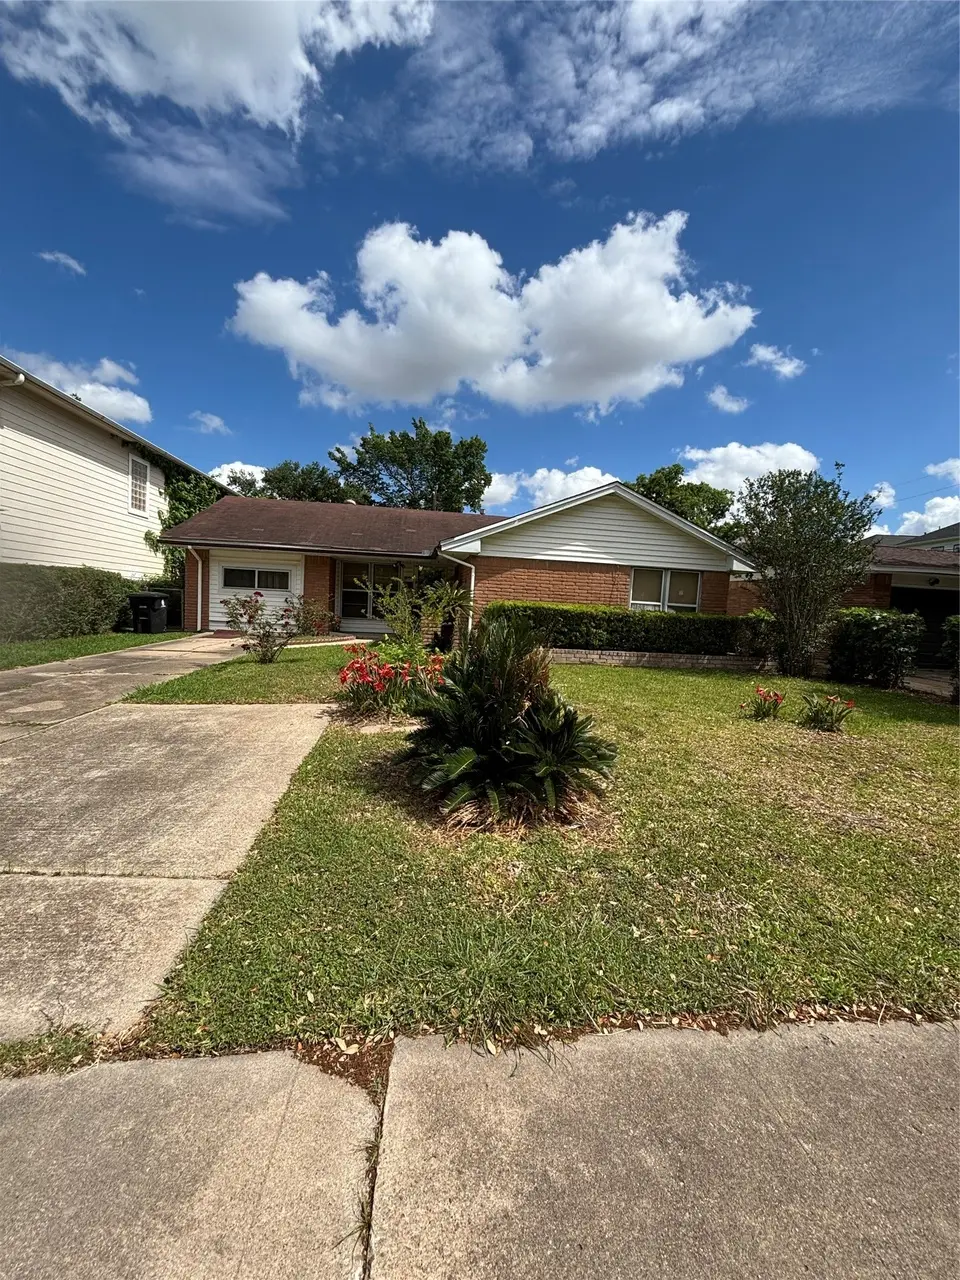
2630 Tidewater Dr · Houston, TX
Flood risk 4/10 · Minor
- FEMA flood zone
- X (unshaded)
- Chance of flooding over 30 yrs
- 0.22%
- Est. flood insurance / yr
- $507 – $1,088
Fire risk 1/10 · Minimal
- Est. fire insurance / yr
- $1,222 – $2,270
Heat risk 9/10 · Severe
- Hot days now (above 109°F)
- 7 days/yr
- Hot days in 30 yrs
- 24 days/yr
Wind risk 9/10 · Severe
- Chance of severe wind over 30 yrs
- 99.0%
Air-quality risk 2/10 · Minimal
- Unhealthy air days now
- 2 days/yr
- Unhealthy air days in 30 yrs
- 2 days/yr
Risk factors via First Street. Map © Google.
Why this score? — see what drove the C- grade
The composite is a weighted blend of 9 inputs, each scored 0–100. Each bar is that input's sub-score; the figure is the points it added to the 100-point composite (weight × sub-score).
- Cash flow +17.2/30.0
- ARV discount +15.0/15.0
- 1% rule +5.7/10.0
- DSCR +5.4/10.0
- Livability +3.7/5.0
- Schools +2.7/10.0
- Condition / age +2.5/5.0
- Rent growth +1.9/5.0
- Appreciation +0.0/10.0
$160,000
🖨 Deal sheet 📄 Offer letter ✓ Due diligence
Listing remarks MLS
Welcome to 2630 Tidewater, this would be a great investment property. With some TLC you can truly make this one your own style. No HOA, low taxes. good location.
Key facts
- Investment property
- Low taxes
- Good location
Tags
Neighborhood map
What this means for you Summary
Snapshot
- This is a 3-bed/2.0-bath single-family listed at $160k.
Deal economics
- At list price, monthly cash flow is $115 ($1k/yr) — positive.
- The deal already cash-flows at list — no discount required.
- Meets the 1% rule at list price ($2k rent vs $160k).
- Recommended offer: $155k (3.0% below list) — sets the bar for market timing.
- Cap rate 7.2% vs local median 3.2% in Houston — top-decile yield for the area; either an underpriced asset or a hidden risk that comps aren't pricing in. Stress-test before assuming the spread holds.
Location & tenants
- Location reads 74/100 on livability (#184 in TX, #4,771 nationally) — a middle-class / working-renter tenant base. Strengths: amenities A+, cost of living A+, housing A+; Watch: schools D, crime F.
- Houston ISD (urban): math 27% / reading 35% proficiency, ranked #593 of 826 in TX (top 72%) — families likely to look elsewhere, expect single-tenant / working-renter base with shorter leases; 71% free/reduced lunch — lower-income household profile, screen leases tightly.
- Market conditions: Rents soft (-2.4%/yr); 135 active listings in the ZIP; 22 comparable units currently listed for rent nearby; rentals at typical pace (median 16d on market — plan ~3-4 weeks tenant-placement turnaround); 29,883 units permitted in Harris County in 2024 (8,621 in 5+ unit buildings).
- This rent runs 34% of the median local income ($60k/yr) — at the standard rent-burdened threshold; future hikes will face affordability resistance.
Forward outlook
- Local home prices are declining (-3.0%/yr); year-one equity from $1k of loan paydown is wiped out by about $5k of value loss. Plan a longer hold.
- Harris County population projected at +47% by 2050 — long-run rental-demand tailwind backs the buy-and-hold thesis.
Negotiation context
- It's been on market 38 days — a 3% lower offer ($155k) is reasonable based on typical stale-listing flexibility.
- 8 sale attempts since 4y ago; this cycle's ask is 19% above the opening price — seller raised mid-cycle; expect resistance to lowballs.
Risks & watch-outs
- Climate carrying-cost: severe wind risk, 99% chance of damaging wind over 30y; extreme-heat days projected 7→24/yr by 2055 (HVAC capex compounding) — expect insurance premiums to compound above CPI over the hold.
Questions for the listing agent
- It's been on market 38 days. Have you received any prior offers? Is the seller open to a 3% concession, seller financing, or rate buy-down credit?
- Built in 1960 — when were the roof, HVAC, electrical panel, plumbing, and water heater last replaced?
- Is there a deadline driving the sale (1031 exchange, divorce, estate, relocation)? That informs how much negotiation room exists.
- Schools are D-rated, which usually means shorter tenancies and higher turnover. Who's the typical renter profile here, and what's been the actual vacancy rate?
- Crime grade is F in this area — have there been break-ins, vandalism, or insurance claims at this property in the last 3 years? What carrier currently insures it and at what premium?
- What's the average days-on-market for RENTAL listings here right now (not sales)? A rising rental-DOM trend means longer vacancies and softer asking-rent achievability than the comps imply.
- What's the recent tenant-quality profile in this submarket — average credit score on applications, eviction rate, late-payment / NSF rate, and stable-employment percentage? A property-management company in the area should have these aggregated.
- How much new for-sale + rental construction is in the pipeline within 1–3 miles? Heavy new supply typically softens prices + rents 12–24 months out; constrained supply supports both.
Investment metrics
- 1% rule
- 1.07% ✓
- Cap rate
- 7.16%
- Cash-on-cash
- 3.09%
- DSCR
- 1.14
- GRM
- 7.8
CMA / ARV
- ARV (median comp)
- $211,456
- List price
- $160,000
- Delta
- -24.33%
- Verdict
- UNDERPRICED
- Comps
- 20 within 1.0 mi
Show comp detail 12 sales within ~0.75 mi
| Address | Dist | Beds/Ba | Sqft | Sold | Price | $/sf | Match |
|---|---|---|---|---|---|---|---|
| 2630 Tidewater Dr | 0.00mi | 3/2.0 | 1,742 (0%) | 0mo | $160,000 | $92 | 100 |
| 2630 Umiak Dr | 0.18mi | 4/2.0 (+1) | 1,752 (+1%) | 2mo | $270,000 | $154 | 84 |
| 2623 Sockeye Dr | 0.11mi | 4/2.0 (+1) | 1,679 (-4%) | 2mo | $275,000 | $164 | 82 |
| 2811 Sockeye Dr | 0.24mi | 4/2.0 (+1) | 1,639 (-6%) | 6mo | $240,000 | $146 | 69 |
| 2910 Meiko Dr | 0.39mi | 3/2.0 | 1,576 (-10%) | 0mo | $260,000 | $165 | 66 |
| 11710 Harristown Dr | 0.72mi | 3/2.0 | 1,720 (-1%) | 1mo | $265,000 | $154 | 64 |
| 3018 Windy Royal Dr | 0.69mi | 3/2.0 | 1,776 (+2%) | 4mo | $191,990 | $108 | 61 |
| 2739 Painted Sunrise Trl | 0.66mi | 3/2.0 | 1,738 (-0%) | 13mo | $312,888 | $180 | 58 |
| 3203 Ripplebrook Dr | 0.75mi | 3/2.0 | 1,707 (-2%) | 6mo | $184,900 | $108 | 57 |
| 2926 Umiak Dr | 0.41mi | 3/2.0 | 1,512 (-13%) | 10mo | $249,000 | $165 | 50 |
| 3139 Wuthering Heights Dr | 0.64mi | 3/2.0 | 1,584 (-9%) | 12mo | $199,000 | $126 | 45 |
| 12534 Chiswick Rd | 0.59mi | 4/2.5 (+1) | 1,968 (+13%) | 1mo | $263,000 | $134 | 43 |
Match score weights: distance 35% · size 25% · config 20% · recency 20%. Top-matched comps best support the ARV.
Projected returns pro-forma
-3.0% appreciation · 0.0% rent growth · sell at horizon
- IRR
- -15.2%
- Equity multiple
- 0.48×
- Total profit
- $-23,480
- Equity at exit
- $23,857
- IRR
- -13.5%
- Equity multiple
- 0.33×
- Total profit
- $-29,888
- Equity at exit
- $13,834
Cash invested: $44,800 (down + closing). Projections, not guarantees.
Landlord ↔ Tenant lean methodology
- Overall (STATE)
- 87 Strongly Landlord-Friendly
- State Texas
- 87 Strongly Landlord-Friendly · R+5
- County
- — inherits STATE
- City
- — inherits STATE
ZIP-level market 77045
- Home prices YoY
- -7.4%
- Rents YoY
- -2.4%
- Active inventory
- 135
- Price-to-rent
- 7.8×
Monthly cashflow live
- Estimated rent
- $1,705 high interval (Pro) →
- Mortgage (P&I)
- −$839
- Tax from tax record
- −$326 /mo · $3,914/yr
- Insurance
- −$67
- HOA
- −$0
- Vacancy / Maint / Mgmt
- −$358
- Net cashflow
- $115
Break-even live
UW: 25.0% down · 7.5% · 30yr · 1.5% tax · 5.0% vac · 8.0% maint · 8.0% mgmt
Financing live
Cash to close
- Down payment
- $40,000
- Closing costs
- $4,800
- Reserves months
- —
- Total cash needed
- —
Loan-product check · same deal, 3 products live
Conventional
25% down · 7.5% · 30yr
- Down + closing
- —
- Monthly P&I
- —
- Monthly cashflow
- —
- DSCR
- —
- Eligible?
- —
Personal DTI + credit; lowest rate.
DSCR
20% down · 8.5% · 30yr
- Down + closing
- —
- Monthly P&I
- —
- Monthly cashflow
- —
- DSCR
- —
- Eligible?
- —
No personal income docs; deal must DSCR.
Hard money
10% down · 12.0% · 12mo
- Down + closing
- —
- Monthly P&I
- —
- Monthly cashflow
- —
- DSCR
- —
- Eligible?
- —
Short-term bridge; refi at stabilization.
Rent comps 22 comps
| Address | Beds | Baths | Sqft | Rent | $/sqft | DOM | Units | Dist |
|---|---|---|---|---|---|---|---|---|
| 3103 Kelling St Houston, TX | 4.0 | 2.0 | 1311 | $1,619 | $1.23 | 7d | 1 | 0.55mi |
| 3119 Kelling St Houston, TX | 4.0 | 2.0 | 1311 | $1,599 | $1.22 | 43d | 1 | 0.58mi |
| 3135 Kelling St Houston, TX | 4.0 | 2.0 | 1311 | $1,599 | $1.22 | 22d | 1 | 0.61mi |
| 3150 Kelling St Houston, TX | 4.0 | 2.0 | 1311 | $1,619 | $1.23 | 7d | 1 | 0.63mi |
| 6 W Orem Dr Houston, TX | 2.0 | 2.0 | 1138 | $1,380 | $1.21 | 43d | 1 | 0.67mi |
| 3215 Boynton Dr Houston, TX | 4.0 | 2.0 | 1311 | $1,599 | $1.22 | 24d | 1 | 0.69mi |
| 3234 Kelling St Houston, TX | 4.0 | 2.0 | 1311 | $1,599 | $1.22 | 24d | 1 | 0.70mi |
| 2201 W Orem Dr Unit 2148 Houston, TX | 2.0 | 2.0 | 1138 | $1,546 | $1.36 | 3d | 1 | 0.70mi |
| 2201 W Orem Dr Unit 2238 Houston, TX | 2.0 | 2.0 | 1138 | $1,578 | $1.39 | 11d | 1 | 0.70mi |
| 2201 W Orem Dr Unit 2238 Houston, TX | 2.0 | 2.0 | 1138 | $1,579 | $1.39 | 43d | 1 | 0.70mi |
| 2201 W Orem Dr Apt 424 Houston, TX | 2.0 | 2.0 | 1138 | $1,554 | $1.37 | 7d | 1 | 0.70mi |
| 3239 Kelling St Houston, TX | 4.0 | 2.0 | 1311 | $1,589 | $1.21 | 16d | 1 | 0.72mi |
| 2201 W Orem Dr Unit 2047 Houston, TX | 2.0 | 2.0 | 1138 | $1,589 | $1.40 | 11d | 1 | 0.73mi |
| 11826 Fortune Park Dr Houston, TX | 3.0 | 2.0 | 1913 | $2,100 | $1.10 | 43d | 1 | 0.87mi |
| 11900 Oakmoor Pkwy Houston, TX | 1.0–3.0 | 1.0–2.0 | 892 | $1,469 | $1.65 | 3d | 12 | 1.02mi |
| 14435 Acuna Ln Houston, TX | 3.0 | 2.0 | 1496 | $1,805 | $1.21 | 43d | 1 | 1.13mi |
| 12806 Buffalo Speedway Houston, TX | 1.0–2.0 | 1.0–2.0 | 916 | $1,636 | $1.79 | 1d | 18 | 1.21mi |
| 1661 Nichole Woods Dr Houston, TX | 3.0 | 2.0 | 1152 | $1,746 | $1.52 | 5d | 1 | 1.31mi |
| 11915 Sanspereil Dr Houston, TX | 3.0 | 2.0 | 1308 | $1,695 | $1.30 | 3d | 1 | 1.39mi |
| 11900 City Park Central Ln Houston, TX | 1.0–2.0 | 1.0–2.0 | 877 | $1,726 | $1.97 | 2d | 23 | 1.44mi |
| 11806 City Park Central Ln Houston, TX | 2.0 | 2.0 | 1107 | $1,636 | $1.48 | 16d | 1 | 1.48mi |
| 11806 City Park Central Ln Houston, TX | 2.0 | 2.0 | 1107 | $1,636 | $1.48 | 43d | 1 | 1.48mi |
Listing history 32 events
-
2026-05-17status Pending 161-char remark
Show marketing remark (161 chars)
Welcome to 2630 Tidewater, this would be a great investment property. With some TLC you can truly make this one your own style. No HOA, low taxes. good location.
-
2026-05-07status Pending 161-char remark
Show marketing remark (161 chars)
Welcome to 2630 Tidewater, this would be a great investment property. With some TLC you can truly make this one your own style. No HOA, low taxes. good location.
-
2026-04-10price $160,000 161-char remark
Show marketing remark (161 chars)
Welcome to 2630 Tidewater, this would be a great investment property. With some TLC you can truly make this one your own style. No HOA, low taxes. good location.
-
2026-04-08$135,000 Active 161-char remark
Show marketing remark (161 chars)
Welcome to 2630 Tidewater, this would be a great investment property. With some TLC you can truly make this one your own style. No HOA, low taxes. good location.
-
2025-07-12historical
-
2025-06-02$180,000 Active
-
2025-06-02historical
-
2025-04-07status Active
-
2025-04-03historical
-
2025-03-28price $180,000
-
2025-03-10price $186,000
-
2025-01-27price $188,000
-
2024-12-30price $190,000
-
2024-11-20price $192,000
-
2024-11-06price $195,000
-
2024-10-24$198,000 Active
-
2022-09-23soldstatus Sold
-
2022-09-23soldstatus
-
2022-09-18status Pending
-
2022-09-09status Option Pending
-
2022-09-01status Active
-
2022-08-30price $1,590
-
2022-08-26status Option Pending
-
2022-08-19price $157,000
-
2022-08-10status Active
-
2022-08-08price $1,660
-
2022-08-05status Option Pending
-
2022-07-27status Active
-
2022-07-25status Pending
-
2022-07-20status Option Pending
-
2022-07-07$165,000 Active
-
1988-01-02soldstatus
ⓘ Source: listings_history table (triggers on properties + properties_extension) + one-shot
backfill from property_details.listing_events for pre-trigger history.
Tax reassessment forecast TX · Resets to sale price
- Current annual tax
- $3,914 · $326/mo
- Projected year-2 tax
- $3,914 · $326/mo
- Expected delta
- $0/yr ($0/mo · 0.0%)
ⓘ Screening estimate from a state-policy table — verify with the county assessor before closing.
Climate risk First Street
- Flood 4/10 Moderate FEMA zone X (unshaded) · 22% chance over 30 yrs
- Wildfire 1/10 Low
- Heat 9/10 Extreme 7 d/yr ≥109°F today · 24 d/yr by 30 yrs out
- Wind 9/10 Extreme 99% chance of damaging wind over 30 yrs
- Air quality 2/10 Low 2 unhealthy d/yr today · 2 by 30 yrs out
Nearby sold comps map
Loading sold comps map…
Walkable amenities ~0.75 mi
Loading nearby amenities…
Taxation est. · year 1
- Rental income
- $20,464
- − Mortgage interest
- −$8,962
- − Property taxes
- −$3,914
- − Insurance
- −$800
- − Repairs & maintenance
- −$1,637
- − Management
- −$1,637
- − Depreciation
- −$4,655
- Taxable loss
- −$1,142
- Est. tax savings @ 24.0%
- +$274
- After-tax cash flow
- $1,657/yr
For passive investors: Depreciation is non-cash, so a rental often shows a tax loss while cash-flowing — sheltering income. Rental losses are passive: they offset passive income freely, and up to $25,000/yr can offset ordinary (W-2) income if you actively participate and your MAGI is under $100k (phasing out to $0 by $150k); unused losses carry forward. On sale, claimed depreciation is recaptured at up to 25%, and gains may owe capital-gains tax (a 1031 exchange can defer both). Figures are a year-1 estimate at your 24.0% rate — not tax advice; consult a CPA.
Schools (NCES district)
- District
- Houston ISD
- NCES district ID
- 4823640
- Math proficiency
- 27% ▼ -18.00%
- Reading proficiency
- 35% ▼ -6.00%
- Median HH income
- $46,054
- Composite
- 26.63/100
- National rank
- #7173
- State rank
- #593 of 826 in TX
Livability — Houston
- Score
- 74/100
- State rank
- #184
- US rank
- #4771
Category grades
Schools grade is shown separately in the Schools card above.
Census & demographics
- Census place
- Houston, TX
- County
- Harris County · 4,702,590 people
- City population
- 3,226,434
- Metro
- Houston-The Woodlands-Sugar Land, TX
- Population (ZIP)
- 33,563
- Household income
- $59,688
- Rent vs Own
- Severe rent burden
- 803.0
Population outlook (Harris County) Hauer SSP2
- Today (2025)
- 5,571,493 people
- By 2030
- 6,089,821 · +9.3%
- By 2040
- 7,142,806 · +28.2%
- By 2050
- 8,185,864 · +46.9%
- By 2075
- 10,574,329 · +89.8%
- By 2100
- 12,109,958 · +117.4%
Race, ethnicity, and origin ACS 2023
- Neighborhood character
- Diverse neighborhood (Simpson 0.56)
- Race & ethnicity
- Hispanic / Latino 54% Black 37% Two or more races 25% White 4% Asian 2% Native American 1%
- Hispanic origin (detail)
- Mexican 37%
- Common ancestry
- Ukrainian 1% Lithuanian 1%
- Foreign-born
- 23% · Canada, Jamaica, China
- Languages at home
- 47% English-only · Spanish 49% Arabic 2% Tagalog/Filipino 1%
Political lean MEDSL · Harris
- 2024 margin
- Lean D (+5.5) · D 52.0% · R 46.4% · Other 1.6%
- 2008→2024 swing
- +3.9pp toward D · 2008: 1.6pp · 2024: 5.5pp
- All cycles
- 2024: D+5.5 2020: D+13.3 2016: D+12.4 2012: D+0.1 2008: D+1.6
Not yet ingested
- Civics
- —
Market trends
- HPI YoY
- ▼ -22.49%
- Current HPI
- 282.5426
- Rent YoY
- ▼ -2.35%
- Metro
- Houston-The Woodlands-Sugar Land, TX
- State GDP YoY
- ▲ 3.95%
- F500 in state
- 110
Industry mix (Fortune 500 HQ in TX)
| Industry | F500 HQs | Revenue |
|---|---|---|
| Energy | 16 | $1,198B |
|
||
| Technology | 5 | $198B |
|
||
| Engineering / Construction | 4 | $72B |
|
||
| Energy Services | 3 | $60B |
|
||
| Utilities | 3 | $41B |
|
||
| Healthcare | 2 | $330B |
|
||
Price history
-3.0% since first listed32 events — show timeline
- 2026-05-17 Pending — HARMLS
- 2026-05-07 Pending — HARMLS
- 2026-04-10 Price Changed $160,000 HARMLS
- 2026-04-08 Listed $135,000 HARMLS
- 2025-07-12 Listing Removed — HARMLS
- 2025-06-02 Listing Removed — HARMLS
- 2025-06-02 Listed $180,000 HARMLS
- 2025-04-07 Relisted — HARMLS
- 2025-04-03 Listing Removed — HARMLS
- 2025-03-28 Price Changed $180,000 HARMLS
- 2025-03-10 Price Changed $186,000 HARMLS
- 2025-01-27 Price Changed $188,000 HARMLS
- 2024-12-30 Price Changed $190,000 HARMLS
- 2024-11-20 Price Changed $192,000 HARMLS
- 2024-11-06 Price Changed $195,000 HARMLS
- 2024-10-24 Listed $198,000 HARMLS
- 2022-09-23 Sold (Public Records) — Public Records
- 2022-09-23 Sold (MLS) — HARMLS
- 2022-09-18 Pending — HARMLS
- 2022-09-09 Pending — HARMLS
- 2022-09-01 Relisted — HARMLS
- 2022-08-30 Price Changed $1,590 RENT.
- 2022-08-26 Pending — HARMLS
- 2022-08-19 Price Changed $157,000 HARMLS
- 2022-08-10 Relisted — HARMLS
- 2022-08-08 Price Changed $1,660 RENT.
- 2022-08-05 Pending — HARMLS
- 2022-07-27 Relisted — HARMLS
- 2022-07-25 Pending — HARMLS
- 2022-07-20 Pending — HARMLS
- 2022-07-07 Listed $165,000 HARMLS
- 1988-01-02 Sold (Public Records) — Public Records
Property tax history
+5.8%/yrLatest (2025): $3,914 · -4.2% YoY. Source: county tax records.
Cash-flow waterfall
monthlySold comps — $/sqft
last 12 mo · ≤1 miLoading sold comps…