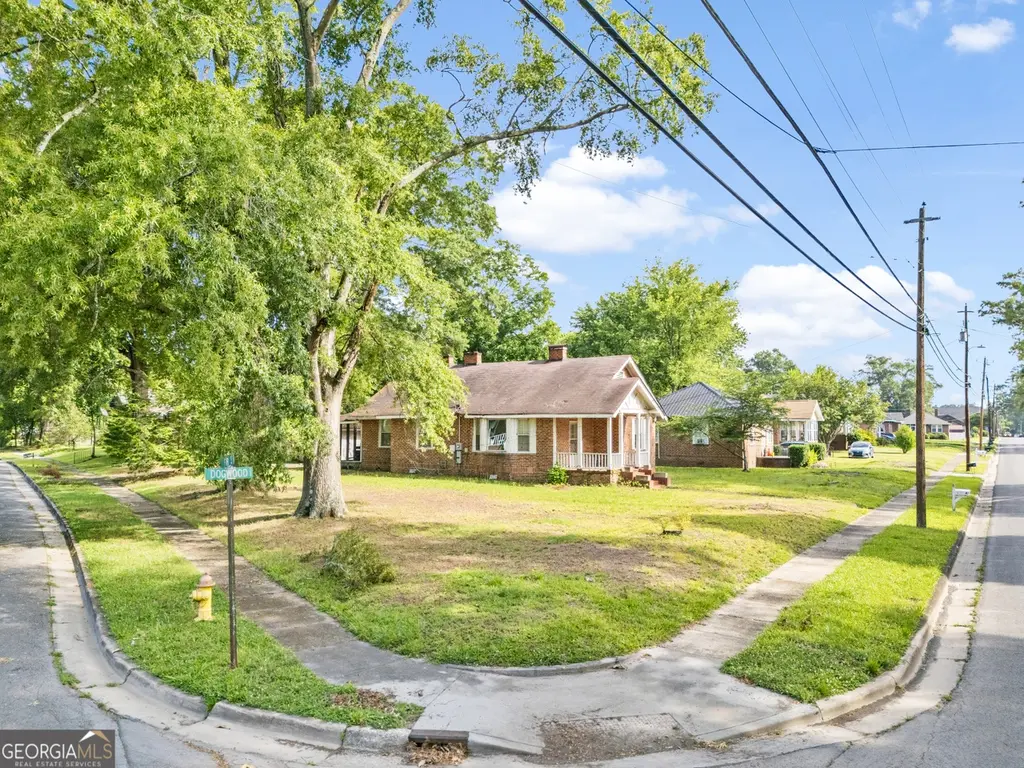
4 Dogwood St NE · Rome, GA
Flood risk 1/10 · Minimal
- FEMA flood zone
- X (unshaded)
- Chance of flooding over 30 yrs
- 0.0%
- Est. flood insurance / yr
- $507 – $1,088
Fire risk 2/10 · Minimal
- Est. fire insurance / yr
- $963 – $1,789
Heat risk 6/10 · Moderate
- Hot days now (above 105°F)
- 7 days/yr
- Hot days in 30 yrs
- 20 days/yr
Wind risk 4/10 · Minor
- Chance of severe wind over 30 yrs
- 15.0%
Air-quality risk 3/10 · Minor
- Unhealthy air days now
- 3 days/yr
- Unhealthy air days in 30 yrs
- 3 days/yr
Risk factors via First Street. Map © Google.
Why this score? — see what drove the B grade
The composite is a weighted blend of 9 inputs, each scored 0–100. Each bar is that input's sub-score; the figure is the points it added to the 100-point composite (weight × sub-score).
- Cash flow +28.8/30.0
- ARV discount +15.0/15.0
- DSCR +10.0/10.0
- 1% rule +7.8/10.0
- Rent growth +4.1/5.0
- Schools +3.5/10.0
- Livability +3.2/5.0
- Condition / age +2.5/5.0
- Appreciation +0.0/10.0
$115,000
🖨 Deal sheet 📄 Offer letter ✓ Due diligence
Listing remarks MLS
Opportunity knocks in Celanese Village! This 2-bedroom, 1-bath home is centrally located in Rome with convenient access to Highways 27, 53, and 411, as well as nearby hospitals, medical facilities, shopping, and dining. Sold as-is and in need of substantial repairs and updates, this property offers tremendous potential for investors, flippers, landlords, or buyers looking to build equity through renovation. With a desirable location and endless possibilities, this is your chance to unlock value and bring new life to a property with promising upside.
Key facts
- 0.32 acre lot
- 2 parking spots
- Built 1935
Property features AI
Finance
- Financial info: Sold/Offered As Is; Financing: Cash, Conventional, FHA
- HOA & community: No HOA
Exterior
- Parking: Off-street parking; Parking pad; Parking shed; Open parking available
- Utilities: Public water; Public sewer; No additional utilities listed
- Home design: Single-family house; Residential property; Built in 1935
- Construction: Brick, concrete, and wood siding construction; Composition roof; Built in 1935; No basement
- Exterior features: Porch with screened area; Corner, level lot; Outbuilding on the property
Interior
- Kitchen: Appliances: Other
- Bedrooms: Two bedrooms on the main level
- Flooring: Hardwood; Tile; Other
- Bathrooms: One full bathroom on the main level
- Heating & cooling: Central heating; Central air; Ceiling fan(s)
- Interior features: One-level living; Den; Other interior features
- Laundry & utility: Laundry located in the kitchen
Neighborhood map
What this means for you Summary
Snapshot
- This is a 2-bed/1.0-bath single-family listed at $115k.
Deal economics
- At list price, monthly cash flow is $387 ($5k/yr) — positive.
- The deal already cash-flows at list — no discount required.
- Meets the 1% rule at list price ($1k rent vs $115k).
- Cap rate 10.3% vs local median 3.3% in Rome — top-decile yield for the area; either an underpriced asset or a hidden risk that comps aren't pricing in. Stress-test before assuming the spread holds.
Location & tenants
- Location reads 64/100 on livability (#266 in GA) — a middle-class / working-renter tenant base. Strengths: cost of living A+, housing A+, health & safety A+; Watch: crime F, amenities F, commute F.
- Floyd County (rural): math 41% / reading 40% proficiency, ranked #45 of 174 in GA (top 26%) — families likely to look elsewhere, expect single-tenant / working-renter base with shorter leases.
- Zoned schools: Model Elementary School (math 50% / reading 48%, grade D, #280 of 1,228 statewide, top 23%, 489 students, 56% FRL); Model Middle School (math 47% / reading 53%, grade C, #68 of 470 statewide, top 15%, 519 students, 41% FRL); Model High (math 36% / reading 43%, grade F, #57 of 424 statewide, top 13%, 912 students, 32% FRL).
- Market conditions: Rents rising fast (+6.3%/yr); 411 active listings in the ZIP; 5 comparable units currently listed for rent nearby; rentals lingering (median 44d on market — plan ~5-8 weeks vacancy on turnover, expect pricing pressure); 100% of comp listings sitting > 30 days — soft ceiling on asking rent; 355 units permitted in Floyd County in 2024 (0 in 5+ unit buildings).
Forward outlook
- Local home prices are declining (-3.0%/yr); year-one equity from $795 of loan paydown is wiped out by about $3k of value loss. Plan a longer hold.
- Floyd County population projected to shrink 6% by 2050 — rents likely to lag national; underwrite the cash flow, not the appreciation.
- At projected returns (-3.0% appreciation + 6.3% rent growth), your $32k cash investment doubles in ~7 years — after that, you're playing with house money.
Negotiation context
- Only 10 days on market — expect competitive offers; lowballing is unlikely to land.
- 2 sale attempts with the ask held roughly flat each time — persistent listings suggest the price (not the market) is what's stuck; bring a comps-based counter.
- Current owner paid $92k; 25% above their basis — modest negotiation headroom, anchor on the comps not their cost.
Risks & watch-outs
- Watch-outs: built in 1935 — expect roof / HVAC / electrical / plumbing capex.
- Climate carrying-cost: extreme-heat days projected 7→20/yr by 2055 (HVAC capex compounding) — expect insurance premiums to compound above CPI over the hold.
Questions for the listing agent
- Built in 1935 — when were the roof, HVAC, electrical panel, plumbing, and water heater last replaced?
- Is there a deadline driving the sale (1031 exchange, divorce, estate, relocation)? That informs how much negotiation room exists.
- Schools are F-rated, which usually means shorter tenancies and higher turnover. Who's the typical renter profile here, and what's been the actual vacancy rate?
- Crime grade is F in this area — have there been break-ins, vandalism, or insurance claims at this property in the last 3 years? What carrier currently insures it and at what premium?
- What's the average days-on-market for RENTAL listings here right now (not sales)? A rising rental-DOM trend means longer vacancies and softer asking-rent achievability than the comps imply.
- What's the recent tenant-quality profile in this submarket — average credit score on applications, eviction rate, late-payment / NSF rate, and stable-employment percentage? A property-management company in the area should have these aggregated.
- How much new for-sale + rental construction is in the pipeline within 1–3 miles? Heavy new supply typically softens prices + rents 12–24 months out; constrained supply supports both.
Investment metrics
- 1% rule
- 1.28% ✓
- Cap rate
- 10.33%
- Cash-on-cash
- 14.42%
- DSCR
- 1.64
- GRM
- 6.5
CMA / ARV
- ARV (on-the-fly)
- $184,030
- Comps found
- 10
Show comp detail 10 sales within ~0.75 mi
| Address | Dist | Beds/Ba | Sqft | Sold | Price | $/sf | Match |
|---|---|---|---|---|---|---|---|
| 7 Ash St NE | 0.18mi | 2/1.0 | 1,105 (-8%) | 2mo | $215,000 | $195 | 78 |
| 5 Poplar St NE | 0.14mi | 2/1.0 | 1,263 (+6%) | 11mo | $169,500 | $134 | 75 |
| 13 Elmwood St NE | 0.14mi | 3/1.0 (+1) | 1,171 (-2%) | 15mo | $229,000 | $196 | 73 |
| 24 Ash St | 0.21mi | 2/1.0 | 1,232 (+3%) | 16mo | $179,000 | $145 | 71 |
| 66 Ash St NE | 0.39mi | 2/2.0 | 1,225 (+2%) | 4mo | $215,000 | $176 | 70 |
| 21 Elmwood St NE | 0.18mi | 3/2.0 (+1) | 1,201 (+0%) | 16mo | $185,000 | $154 | 68 |
| 1 Poplar St | 0.13mi | 2/1.0 | 1,362 (+14%) | 5mo | $178,000 | $131 | 67 |
| 10 Elmwood St NE | 0.09mi | 3/1.0 (+1) | 1,312 (+10%) | 22mo | $189,000 | $144 | 57 |
| 48 Hickory St NE | 0.34mi | 2/1.0 | 1,345 (+13%) | 9mo | $235,500 | $175 | 56 |
| 205 Couper St NE | 0.66mi | 2/1.0 | 1,349 (+13%) | 6mo | $189,900 | $141 | 42 |
Match score weights: distance 35% · size 25% · config 20% · recency 20%. Top-matched comps best support the ARV.
Projected returns pro-forma
-3.0% appreciation · 6.28% rent growth · sell at horizon
- IRR
- 8.4%
- Equity multiple
- 1.34×
- Total profit
- $11,033
- Equity at exit
- $17,147
- IRR
- 20.2%
- Equity multiple
- 2.97×
- Total profit
- $63,395
- Equity at exit
- $9,943
Cash invested: $32,200 (down + closing). Projections, not guarantees.
Landlord ↔ Tenant lean methodology
- Overall (STATE)
- 90 Strongly Landlord-Friendly
- State Georgia
- 90 Strongly Landlord-Friendly · R+3
- County
- — inherits STATE
- City
- — inherits STATE
ZIP-level market 30161
- Rents YoY
- 6.3%
- Active inventory
- 411
- Price-to-rent
- 6.5×
Monthly cashflow live
- Estimated rent
- $1,471 high interval (Pro) →
- Mortgage (P&I)
- −$603
- Tax from tax record
- −$124 /mo · $1,491/yr
- Insurance
- −$48
- HOA
- −$0
- Vacancy / Maint / Mgmt
- −$309
- Net cashflow
- $387
Break-even live
UW: 25.0% down · 7.5% · 30yr · 1.5% tax · 5.0% vac · 8.0% maint · 8.0% mgmt
Financing live
Cash to close
- Down payment
- $28,750
- Closing costs
- $3,450
- Reserves months
- —
- Total cash needed
- —
Loan-product check · same deal, 3 products live
Conventional
25% down · 7.5% · 30yr
- Down + closing
- —
- Monthly P&I
- —
- Monthly cashflow
- —
- DSCR
- —
- Eligible?
- —
Personal DTI + credit; lowest rate.
DSCR
20% down · 8.5% · 30yr
- Down + closing
- —
- Monthly P&I
- —
- Monthly cashflow
- —
- DSCR
- —
- Eligible?
- —
No personal income docs; deal must DSCR.
Hard money
10% down · 12.0% · 12mo
- Down + closing
- —
- Monthly P&I
- —
- Monthly cashflow
- —
- DSCR
- —
- Eligible?
- —
Short-term bridge; refi at stabilization.
Rent comps 5 comps
| Address | Beds | Baths | Sqft | Rent | $/sqft | DOM | Units | Dist |
|---|---|---|---|---|---|---|---|---|
| 19 Poplar St NE Unit Na Rome, GA | 2.0 | 1.0 | 1020 | $1,550 | $1.52 | 43d | 1 | 0.19mi |
| 1 Roseway Cir NE Rome, GA | 2.0 | 1.0 | 875 | $1,200 | $1.37 | 43d | 1 | 0.92mi |
| 105 W Callahan St Rome, GA | 3.0 | 2.0 | 1500 | $2,000 | $1.33 | 43d | 1 | 0.99mi |
| 3 Forsyth St NE Rome, GA | 3.0 | 2.0 | 1134 | $1,795 | $1.58 | 43d | 1 | 1.08mi |
| 525 W 13th St NE Rome, GA | 2.0–3.0 | 2.0 | 1059 | $1,349 | $1.27 | 43d | 12 | 1.27mi |
Listing history 9 events
-
2026-06-19days on market $115,000 Active 10 DOM
-
2026-06-18days on market $115,000 Active 9 DOM
-
2026-06-17days on market $115,000 Active 8 DOM
-
2026-06-16days on market $115,000 Active 7 DOM
-
2026-06-15days on market $115,000 Active 6 DOM
-
2026-06-14days on market $115,000 Active 4 DOM
-
2026-06-13statusdays on market $115,000 Active 3 DOM
-
2026-06-10remarks 555-char remark
-
2026-06-10$115,000 New 1 DOM
ⓘ Source: listings_history table (triggers on properties + properties_extension) + one-shot
backfill from property_details.listing_events for pre-trigger history.
Tax reassessment forecast GA · Resets to sale price
- Current annual tax
- $1,491 · $124/mo
- Projected year-2 tax
- $1,491 · $124/mo
- Expected delta
- $0/yr ($0/mo · 0.0%)
ⓘ Screening estimate from a state-policy table — verify with the county assessor before closing.
Climate risk First Street
- Flood 1/10 Low FEMA zone X (unshaded) · 0% chance over 30 yrs
- Wildfire 2/10 Low
- Heat 6/10 Major 7 d/yr ≥105°F today · 20 d/yr by 30 yrs out
- Wind 4/10 Moderate 15% chance of damaging wind over 30 yrs
- Air quality 3/10 Moderate 3 unhealthy d/yr today · 3 by 30 yrs out
Nearby sold comps map
Loading sold comps map…
Walkable amenities ~0.75 mi
Loading nearby amenities…
Taxation est. · year 1
- Rental income
- $17,653
- − Mortgage interest
- −$6,442
- − Property taxes
- −$1,491
- − Insurance
- −$575
- − Repairs & maintenance
- −$1,412
- − Management
- −$1,412
- − Depreciation
- −$3,345
- Taxable income
- $2,975
- Est. tax owed @ 24.0%
- −$714
- After-tax cash flow
- $3,929/yr
For passive investors: Depreciation is non-cash, so a rental often shows a tax loss while cash-flowing — sheltering income. Rental losses are passive: they offset passive income freely, and up to $25,000/yr can offset ordinary (W-2) income if you actively participate and your MAGI is under $100k (phasing out to $0 by $150k); unused losses carry forward. On sale, claimed depreciation is recaptured at up to 25%, and gains may owe capital-gains tax (a 1031 exchange can defer both). Figures are a year-1 estimate at your 24.0% rate — not tax advice; consult a CPA.
Schools (NCES district)
- District
- Floyd County
- NCES district ID
- 1302190
- Math proficiency
- 41% ▼ -5.00%
- Reading proficiency
- 40% ▼ -4.00%
- Median HH income
- $47,083
- Composite
- 34.64/100
- National rank
- #5143
- State rank
- #45 of 174 in GA
Livability — Rome
- Score
- 64/100
- State rank
- #266
- US rank
- #14459
Category grades
Schools grade is shown separately in the Schools card above.
Census & demographics
- County
- Floyd County · 77,706 people
- City population
- 77,706
- Metro
- Rome, GA
- Population (ZIP)
- 34,705
- Household income
- $61,667
- Rent vs Own
- Severe rent burden
- 1104.0
Population outlook (Floyd County) Hauer SSP2
- Today (2025)
- 96,321 people
- By 2030
- 95,532 · -0.8%
- By 2040
- 93,332 · -3.1%
- By 2050
- 90,850 · -5.7%
- By 2075
- 84,989 · -11.8%
- By 2100
- 76,097 · -21.0%
Race, ethnicity, and origin ACS 2023
- Neighborhood character
- Predominantly White (68%)
- Race & ethnicity
- White 68% Black 20% Hispanic / Latino 7% Two or more races 6% Asian 1%
- Hispanic origin (detail)
- Mexican 2%
- Common ancestry
- Slovak 3% Serbian 2% Italian 2%
- Foreign-born
- 5% · Canada
- Languages at home
- 91% English-only · Spanish 5% Other Indo-European 1%
Political lean MEDSL · Floyd
- 2024 margin
- Solid R (+42.0) · D 28.8% · R 70.7%
- 2008→2024 swing
- -5.6pp toward R · 2008: -36.4pp · 2024: -42.0pp
- All cycles
- 2024: R+42.0 2020: R+41.1 2016: R+43.5 2012: R+39.9 2008: R+36.4
Not yet ingested
- Civics
- —
Market trends
- HPI YoY
- ▼ -186.06%
- Current HPI
- 257.8168
- Rent YoY
- ▲ 6.28%
- Metro
- Rome, GA
- State GDP YoY
- ▲ 2.66%
- F500 in state
- 28
Industry mix (Fortune 500 HQ in GA)
| Industry | F500 HQs | Revenue |
|---|---|---|
| Paper / Packaging | 2 | $29B |
|
||
| Retail | 1 | $160B |
|
||
| Transportation / Logistics | 1 | $91B |
|
||
| Airlines | 1 | $62B |
|
||
| Consumer Goods | 1 | $47B |
|
||
| Utilities | 1 | $25B |
|
||
Price history
+79.7% since first listed4 events — show timeline
- 2026-06-02 Listed $115,000 FMLS
- 2026-06-02 Listed $115,000 GAMLS
- 2006-09-07 Sold (Public Records) $92,000 Public Records
- 2004-05-07 Sold (Public Records) $64,000 Public Records
Property tax history
+4.1%/yrLatest (2025): $1,491 · -0.6% YoY. Source: county tax records.
Cash-flow waterfall
monthlySold comps — $/sqft
last 12 mo · ≤1 miLoading sold comps…