658 S 57th St #14 · Springfield, OR
Flood risk 4/10 · Minor
- FEMA flood zone
- X (unshaded)
- Chance of flooding over 30 yrs
- 0.22%
- Est. flood insurance / yr
- $507 – $1,088
Fire risk 5/10 · Moderate
- Est. fire insurance / yr
- $498 – $926
Heat risk 4/10 · Minor
- Hot days now (above 91°F)
- 7 days/yr
- Hot days in 30 yrs
- 16 days/yr
Wind risk 1/10 · Minimal
- Chance of severe wind over 30 yrs
- —
Air-quality risk 10/10 · Severe
- Unhealthy air days now
- 13 days/yr
- Unhealthy air days in 30 yrs
- 15 days/yr
Risk factors via First Street. Map © Google.
Why this score? — see what drove the D grade
The composite is a weighted blend of 9 inputs, each scored 0–100. Each bar is that input's sub-score; the figure is the points it added to the 100-point composite (weight × sub-score).
- Cash flow +11.5/30.0
- 1% rule +10.0/10.0
- ARV discount +7.5/15.0
- Livability +4.2/5.0
- DSCR +3.4/10.0
- Rent growth +3.3/5.0
- Condition / age +2.5/5.0
- Schools +2.4/10.0
- Appreciation +0.0/10.0
$160,000
🖨 Deal sheet 📄 Offer letter ✓ Due diligence
Listing remarks MLS
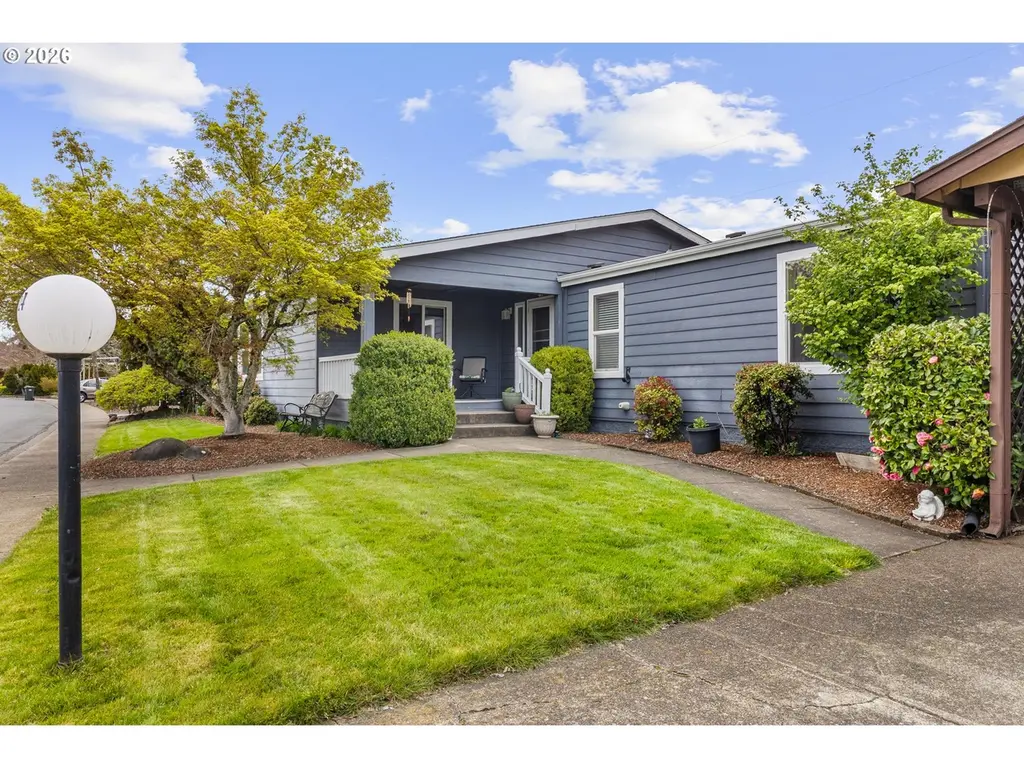
If space is at the top of your list, this one delivers.Located in the 55+ Emerald Isle Mobile Home Park, this triple-wide home offers 2,012 sq ft with 3 bedrooms, 2 bathrooms, and a bonus office—giving you room to live, work, and relax without feeling cramped.The oversized living room is the heart of the home, flowing into a large kitchen and dining area that’s made for hosting or just enjoying everyday life. There’s also a separate laundry room to keep things practical.Out front, you’ve got a covered porch overlooking a beautifully kept yard that instantly feels welcoming. Out back, two deck spaces (one covered) give you options for morning coffee, evening dinners, or just soaking up some fresh air. Storage is dialed in with a shed plus additional space attached to the covered carport.And when summer hits, the community pool is ready for you. Home is being sold as-is, offering a great opportunity to make it your own.
Key facts
- Covered porch
- Shed
- Community pool
Tags
Neighborhood map
What this means for you Summary
Snapshot
- This is a 3-bed/2.0-bath manufactured listed at $160k.
Deal economics
- At list price, monthly cash flow is $-53 ($-641/yr) — negative.
- To cash-flow at today's rent, offer at most $151k (5.9% below list).
- Meets the 1% rule at list price ($2k rent vs $160k).
- Recommended offer: $150k (6.0% below list) — sets the bar for market timing.
- Cap rate 5.9% vs local median 3.0% in Springfield — top-decile yield for the area; either an underpriced asset or a hidden risk that comps aren't pricing in. Stress-test before assuming the spread holds.
Location & tenants
- Location reads 83/100 on livability (#40 in OR, #934 nationally) — a professional / high-income tenant draw. Strengths: amenities A+, commute A+, housing A+; Watch: schools D+, crime D+, employment D+.
- Springfield SD 19 (suburban): math 19% / reading 38% proficiency, ranked #48 of 58 in OR (top 83%) — low school quality limits family demand, transient renter base, plan for 1-2y turnover.
- Market conditions: Rents rising (+3.4%/yr); 263 active listings in the ZIP; solid renter incomes; 1,808 units permitted in Lane County in 2024 (972 in 5+ unit buildings).
- This rent runs 37% of the median local income ($80k/yr) — at the standard rent-burdened threshold; future hikes will face affordability resistance.
Forward outlook
- Local home prices are declining (-3.0%/yr); year-one equity from $1k of loan paydown is wiped out by about $5k of value loss. Plan a longer hold.
- Lane County population projected at +15% by 2050 — long-run rental-demand tailwind backs the buy-and-hold thesis.
Negotiation context
- It's been on market 77 days — a 6% lower offer ($150k) is reasonable based on typical stale-listing flexibility.
Risks & watch-outs
- Watch-outs: HOA is 40% of rent.
- Climate carrying-cost: moderate wildfire risk — expect insurance premiums to compound above CPI over the hold.
Questions for the listing agent
- What do current leases actually rent for vs. the listed asking? Can we see a recent rent roll and the last 12 months of T-12 income?
- It's been on market 77 days. Have you received any prior offers? Is the seller open to a 6% concession, seller financing, or rate buy-down credit?
- What does the HOA fee cover, when was the last increase, and are there any pending special assessments or reserve-fund shortfalls?
- Why hasn't it sold? Are there any deal-killer items the seller is aware of (foundation, flood, title, zoning, code violations)?
- Is there a deadline driving the sale (1031 exchange, divorce, estate, relocation)? That informs how much negotiation room exists.
- Schools are D-rated, which usually means shorter tenancies and higher turnover. Who's the typical renter profile here, and what's been the actual vacancy rate?
- Crime grade is D in this area — have there been break-ins, vandalism, or insurance claims at this property in the last 3 years? What carrier currently insures it and at what premium?
- The area grade is low — what's the realistic commute time and amenity access for the typical tenant pool here? Any planned neighborhood developments (good or bad) we should know about?
- What's the average days-on-market for RENTAL listings here right now (not sales)? A rising rental-DOM trend means longer vacancies and softer asking-rent achievability than the comps imply.
- What's the recent tenant-quality profile in this submarket — average credit score on applications, eviction rate, late-payment / NSF rate, and stable-employment percentage? A property-management company in the area should have these aggregated.
- How much new for-sale + rental construction is in the pipeline within 1–3 miles? Heavy new supply typically softens prices + rents 12–24 months out; constrained supply supports both.
Investment metrics
- 1% rule
- 1.54% ✓
- Cap rate
- 5.89%
- Cash-on-cash
- -1.43%
- DSCR
- 0.94
- GRM
- 5.4
CMA / ARV
- ARV (median comp)
- $331,588
- List price
- $160,000
- Delta
- -51.75%
- Verdict
- UNDERPRICED
- Comps
- 9 within 1.0 mi
Projected returns pro-forma
-3.0% appreciation · 3.38% rent growth · sell at horizon
- IRR
- -17.4%
- Equity multiple
- 0.38×
- Total profit
- $-27,792
- Equity at exit
- $23,857
- IRR
- -7.5%
- Equity multiple
- 0.50×
- Total profit
- $-22,271
- Equity at exit
- $13,834
Cash invested: $44,800 (down + closing). Projections, not guarantees.
Landlord ↔ Tenant lean methodology
- Overall (STATE)
- 28 Tenant-Leaning
- State Oregon
- 28 Tenant-Leaning · D+6
- County
- — inherits STATE
- City
- — inherits STATE
ZIP-level market 97478
- Rents YoY
- 3.4%
- Active inventory
- 263
- Price-to-rent
- 5.4×
Monthly cashflow live
- Estimated rent
- $2,468 medium interval (Pro) →
- Mortgage (P&I)
- −$839
- Tax from tax record
- −$113 /mo · $1,354/yr
- Insurance
- −$67
- HOA
- −$985
- Vacancy / Maint / Mgmt
- −$518
- Net cashflow
- $-53
Break-even live
UW: 25.0% down · 7.5% · 30yr · 1.5% tax · 5.0% vac · 8.0% maint · 8.0% mgmt
Financing live
Cash to close
- Down payment
- $40,000
- Closing costs
- $4,800
- Reserves months
- —
- Total cash needed
- —
Loan-product check · same deal, 3 products live
Conventional
25% down · 7.5% · 30yr
- Down + closing
- —
- Monthly P&I
- —
- Monthly cashflow
- —
- DSCR
- —
- Eligible?
- —
Personal DTI + credit; lowest rate.
DSCR
20% down · 8.5% · 30yr
- Down + closing
- —
- Monthly P&I
- —
- Monthly cashflow
- —
- DSCR
- —
- Eligible?
- —
No personal income docs; deal must DSCR.
Hard money
10% down · 12.0% · 12mo
- Down + closing
- —
- Monthly P&I
- —
- Monthly cashflow
- —
- DSCR
- —
- Eligible?
- —
Short-term bridge; refi at stabilization.
HOA detail
- Monthly dues
- $985 · $11,820/yr
- Likely covers
- pool
Listing history 18 events
-
2026-06-18days on market $160,000 Active 77 DOM
-
2026-06-17price $160,000 Active 76 DOM
-
2026-06-17days on market $174,900 Active 76 DOM
-
2026-06-16days on market $174,900 Active 75 DOM
-
2026-06-15days on market $174,900 Active 74 DOM
-
2026-06-14days on market $174,900 Active 72 DOM
-
2026-06-10days on market $174,900 Active 69 DOM
-
2026-06-09days on market $174,900 Active 68 DOM
-
2026-06-08days on market $174,900 Active 67 DOM
-
2026-06-07remarks 699-char remark
-
2026-06-07days on market $174,900 Active 66 DOM
-
2026-06-03days on market $174,900 Active 62 DOM
-
2026-06-02days on market $174,900 Active 61 DOM
-
2026-06-01days on market $174,900 Active 60 DOM
-
2026-05-31days on market $174,900 Active 59 DOM
-
2026-05-30days on market $174,900 Active 58 DOM
-
2026-04-22price $185,000 955-char remark
Show marketing remark (955 chars)
If space is at the top of your list, this one delivers.Located in the 55+ Emerald Isle Mobile Home Park, this triple-wide home offers 2,012 sq ft with 3 bedrooms, 2 bathrooms, and a bonus office—giving you room to live, work, and relax without feeling cramped.The oversized living room is the heart of the home, flowing into a large kitchen and dining area that’s made for hosting or just enjoying everyday life. There’s also a separate laundry room to keep things practical.Out front, you’ve got a covered porch overlooking a beautifully kept yard that instantly feels welcoming. Out back, two deck spaces (one covered) give you options for morning coffee, evening dinners, or just soaking up some fresh air. Storage is dialed in with a shed plus additional space attached to the covered carport.And when summer hits, the community pool is ready for you. Home is being sold as-is, offering a great opportunity to make it your own.
-
2026-04-02$199,999 Active 955-char remark
Show marketing remark (955 chars)
If space is at the top of your list, this one delivers.Located in the 55+ Emerald Isle Mobile Home Park, this triple-wide home offers 2,012 sq ft with 3 bedrooms, 2 bathrooms, and a bonus office—giving you room to live, work, and relax without feeling cramped.The oversized living room is the heart of the home, flowing into a large kitchen and dining area that’s made for hosting or just enjoying everyday life. There’s also a separate laundry room to keep things practical.Out front, you’ve got a covered porch overlooking a beautifully kept yard that instantly feels welcoming. Out back, two deck spaces (one covered) give you options for morning coffee, evening dinners, or just soaking up some fresh air. Storage is dialed in with a shed plus additional space attached to the covered carport.And when summer hits, the community pool is ready for you. Home is being sold as-is, offering a great opportunity to make it your own.
ⓘ Source: listings_history table (triggers on properties + properties_extension) + one-shot
backfill from property_details.listing_events for pre-trigger history.
Tax reassessment forecast OR · Resets to sale price
- Current annual tax
- $1,354 · $113/mo
- Projected year-2 tax
- $1,552 · $129/mo
- Expected delta
- +$198/yr (+$17/mo · 14.7%)
ⓘ Screening estimate from a state-policy table — verify with the county assessor before closing.
Climate risk First Street
- Flood 4/10 Moderate FEMA zone X (unshaded) · 22% chance over 30 yrs
- Wildfire 5/10 Major
- Heat 4/10 Moderate 7 d/yr ≥91°F today · 16 d/yr by 30 yrs out
- Wind 1/10 Low
- Air quality 10/10 Extreme 13 unhealthy d/yr today · 15 by 30 yrs out
Nearby sold comps map
Loading sold comps map…
Walkable amenities ~0.75 mi
Loading nearby amenities…
Taxation est. · year 1
- Rental income
- $29,622
- − Mortgage interest
- −$8,962
- − Property taxes
- −$1,354
- − Insurance
- −$800
- − Repairs & maintenance
- −$2,370
- − Management
- −$2,370
- − HOA
- −$11,820
- − Depreciation
- −$4,655
- Taxable loss
- −$2,708
- Est. tax savings @ 24.0%
- +$650
- After-tax cash flow
- $9/yr
For passive investors: Depreciation is non-cash, so a rental often shows a tax loss while cash-flowing — sheltering income. Rental losses are passive: they offset passive income freely, and up to $25,000/yr can offset ordinary (W-2) income if you actively participate and your MAGI is under $100k (phasing out to $0 by $150k); unused losses carry forward. On sale, claimed depreciation is recaptured at up to 25%, and gains may owe capital-gains tax (a 1031 exchange can defer both). Figures are a year-1 estimate at your 24.0% rate — not tax advice; consult a CPA.
Schools (NCES district)
- District
- Springfield SD 19
- NCES district ID
- 4111670
- Math proficiency
- 19% ▼ -13.00%
- Reading proficiency
- 38% ▼ -10.00%
- Median HH income
- $42,236
- Composite
- 24.14/100
- National rank
- #7746
- State rank
- #48 of 58 in OR
Livability — Springfield
- Score
- 83/100
- State rank
- #40
- US rank
- #934
Category grades
Schools grade is shown separately in the Schools card above.
Census & demographics
- Census place
- Springfield, OR
- County
- Lane County · 310,476 people
- City population
- 76,907
- Metro
- Eugene-Springfield, OR
- Population (ZIP)
- 39,373
- Household income
- $80,086
- Rent vs Own
- Severe rent burden
- 904.0
Population outlook (Lane County) Hauer SSP2
- Today (2025)
- 391,933 people
- By 2030
- 405,860 · +3.6%
- By 2040
- 429,386 · +9.6%
- By 2050
- 452,016 · +15.3%
- By 2075
- 508,825 · +29.8%
- By 2100
- 531,208 · +35.5%
Race, ethnicity, and origin ACS 2023
- Neighborhood character
- Predominantly White (79%)
- Race & ethnicity
- White 79% Hispanic / Latino 12% Two or more races 9% Native American 1% Asian 1%
- Hispanic origin (detail)
- Mexican 9%
- Common ancestry
- Slovak 4% Lithuanian 3% Portuguese 3%
- Foreign-born
- 4% · Canada
- Languages at home
- 94% English-only · Spanish 5% Tagalog/Filipino 1%
Political lean MEDSL · Lane
- 2024 margin
- Strong D (+23.1) · D 60.0% · R 36.9% · Other 3.1%
- 2008→2024 swing
- -4.3pp toward R · 2008: 27.4pp · 2024: 23.1pp
- All cycles
- 2024: D+23.1 2020: D+24.3 2016: D+18.9 2012: D+23.4 2008: D+27.4
Not yet ingested
- Civics
- —
Market trends
- HPI YoY
- ▼ -395.83%
- Current HPI
- 302.9203
- Rent YoY
- ▲ 3.38%
- Metro
- Eugene-Springfield, OR
- State GDP YoY
- ▲ 2.05%
- F500 in state
- 2
Industry mix (Fortune 500 HQ in OR)
| Industry | F500 HQs | Revenue |
|---|---|---|
| Consumer Goods | 1 | $51B |
|
||
Price history
-7.5% since first listed2 events — show timeline
- 2026-04-22 Price Changed $185,000 RMLS
- 2026-04-02 Listed $199,999 RMLS
Property tax history
-0.2%/yrLatest (2025): $1,354 · -25.1% YoY. Source: county tax records.
Cash-flow waterfall
monthlySold comps — $/sqft
last 12 mo · ≤1 miLoading sold comps…