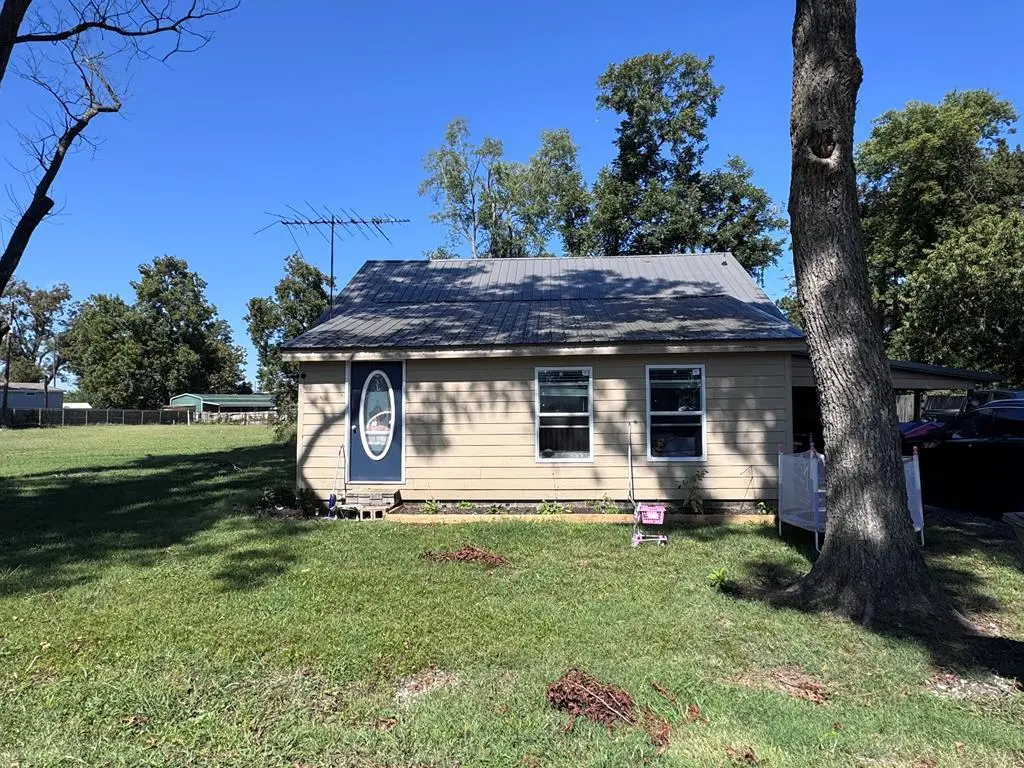
158 Junction St · Tyronza, AR
Flood risk 1/10 · Minimal
- FEMA flood zone
- X
- Chance of flooding over 30 yrs
- 0.0%
- Est. flood insurance / yr
- $507 – $1,088
Fire risk 1/10 · Minimal
- Est. fire insurance / yr
- $1,499 – $2,785
Heat risk 6/10 · Moderate
- Hot days now (above 109°F)
- 7 days/yr
- Hot days in 30 yrs
- 21 days/yr
Wind risk 4/10 · Minor
- Chance of severe wind over 30 yrs
- 14.0%
Air-quality risk 1/10 · Minimal
- Unhealthy air days now
- 0 days/yr
- Unhealthy air days in 30 yrs
- 0 days/yr
Risk factors via First Street. Map © Google.
Why this score? — see what drove the B+ grade
The composite is a weighted blend of 9 inputs, each scored 0–100. Each bar is that input's sub-score; the figure is the points it added to the 100-point composite (weight × sub-score).
- Cash flow +29.9/30.0
- ARV discount +15.0/15.0
- DSCR +10.0/10.0
- 1% rule +8.4/10.0
- Appreciation +5.0/10.0
- Livability +3.5/5.0
- Schools +3.0/10.0
- Rent growth +2.5/5.0
- Condition / age +2.5/5.0
$90,000
🖨 Deal sheet 📄 Offer letter ✓ Due diligence
Listing remarks MLS
Welcome to the market! This charming 3-bedroom, 1-bath home in the heart of Tyronza offers affordability, comfort, and small-town living at its best. With 1,580 sq ft of living space, this 1.5-story home provides a functional layout perfect for first-time buyers, downsizers, or investors. The home features a new metal roof, central air, natural gas heat, and durable luxury vinyl plank flooring, giving you peace of mind and easy maintenance. Sitting on a spacious lot in a quiet neighborhood, there's plenty of room for outdoor activities, gardening, or future improvements. An attached carport adds convenient covered parking. Whether you're looking for an affordable place to call home or a solid rental investment, this property is full of potential. Don't miss your chance to view this super-cute home—schedule your showing today!
Key facts
- 0.23 acre lot
- Built 1953
- Listed 53 days
Neighborhood map
What this means for you Summary
Snapshot
- This is a 3-bed/1.0-bath single-family listed at $90k.
Deal economics
- At list price, monthly cash flow is $334 ($4k/yr) — positive.
- The deal already cash-flows at list — no discount required.
- Meets the 1% rule at list price ($1k rent vs $90k).
- Recommended offer: $87k (3.0% below list) — sets the bar for market timing.
Location & tenants
- Location reads 70/100 on livability (#60 in AR) — a middle-class / working-renter tenant base. Strengths: crime A+, cost of living A+, housing A+; Watch: schools D, employment D, amenities F.
- East Poinsett County School District (rural): math 36% / reading 37% proficiency, ranked #113 of 238 in AR (top 48%) — families likely to look elsewhere, expect single-tenant / working-renter base with shorter leases.
- Market conditions: 5 active listings in the ZIP; 67 units permitted in Poinsett County in 2024 (5 in 5+ unit buildings).
Forward outlook
- In year one you build about $3k of equity ($622 loan paydown + $3k appreciation (3.0% local appreciation)).
- Poinsett County population projected at -13% by 2050 — secular population decline; favor cash flow + early exit over multi-decade hold.
- At projected returns (3.0% appreciation + 3.0% rent growth), your $25k cash investment doubles in ~4 years — after that, you're playing with house money.
- By year 10, paydown + projected appreciation supports a ~$32k cash-out refi (75% LTV) — recoverable capital for the next deal without selling this one.
Negotiation context
- It's been on market 53 days — a 3% lower offer ($87k) is reasonable based on typical stale-listing flexibility.
- 5 sale attempts since 5y ago with the ask held roughly flat each time — persistent listings suggest the price (not the market) is what's stuck; bring a comps-based counter.
- Current owner paid $43k; list at $90k implies a 108% gain — meaningful room to come down on a strong offer.
Risks & watch-outs
- Watch-outs: built in 1953 — expect roof / HVAC / electrical / plumbing capex.
- Climate carrying-cost: extreme-heat days projected 7→21/yr by 2055 (HVAC capex compounding) — expect insurance premiums to compound above CPI over the hold.
Questions for the listing agent
- It's been on market 53 days. Have you received any prior offers? Is the seller open to a 3% concession, seller financing, or rate buy-down credit?
- Built in 1953 — when were the roof, HVAC, electrical panel, plumbing, and water heater last replaced?
- Is there a deadline driving the sale (1031 exchange, divorce, estate, relocation)? That informs how much negotiation room exists.
- Schools are D-rated, which usually means shorter tenancies and higher turnover. Who's the typical renter profile here, and what's been the actual vacancy rate?
- What's the average days-on-market for RENTAL listings here right now (not sales)? A rising rental-DOM trend means longer vacancies and softer asking-rent achievability than the comps imply.
- What's the recent tenant-quality profile in this submarket — average credit score on applications, eviction rate, late-payment / NSF rate, and stable-employment percentage? A property-management company in the area should have these aggregated.
- How much new for-sale + rental construction is in the pipeline within 1–3 miles? Heavy new supply typically softens prices + rents 12–24 months out; constrained supply supports both.
Investment metrics
- 1% rule
- 1.34% ✓
- Cap rate
- 10.74%
- Cash-on-cash
- 15.89%
- DSCR
- 1.71
- GRM
- 6.2
CMA / ARV
- ARV (median comp)
- $145,141
- List price
- $90,000
- Delta
- -37.99%
- Verdict
- UNDERPRICED
- Comps
- 10 within 1.0 mi
Show comp detail 3 sales within ~0.75 mi
| Address | Dist | Beds/Ba | Sqft | Sold | Price | $/sf | Match |
|---|---|---|---|---|---|---|---|
| 121 Oak St | 0.26mi | 3/2.0 | 1,539 (-3%) | 1mo | $41,000 | $27 | 79 |
| 116 Mill St | 0.28mi | 3/1.0 | 1,408 (-11%) | 7mo | $118,000 | $84 | 63 |
| 178 Cotton Rd | 0.35mi | 3/2.0 | 1,757 (+11%) | 11mo | $184,000 | $105 | 51 |
Match score weights: distance 35% · size 25% · config 20% · recency 20%. Top-matched comps best support the ARV.
Projected returns pro-forma
3.0% appreciation · 3.0% rent growth · sell at horizon
- IRR
- 22.4%
- Equity multiple
- 2.27×
- Total profit
- $32,107
- Equity at exit
- $40,468
- IRR
- 23.4%
- Equity multiple
- 4.36×
- Total profit
- $84,559
- Equity at exit
- $62,366
Cash invested: $25,200 (down + closing). Projections, not guarantees.
Landlord ↔ Tenant lean methodology
- Overall (STATE)
- 92 Strongly Landlord-Friendly
- State Arkansas
- 92 Strongly Landlord-Friendly · R+14
- County
- — inherits STATE
- City
- — inherits STATE
ZIP-level market 72386
- Active inventory
- 5
- Price-to-rent
- 6.2×
Monthly cashflow live
- Estimated rent
- $1,210 medium interval (Pro) →
- Mortgage (P&I)
- −$472
- Tax est. 1.5%
- −$112 /mo · $1,350/yr
- Insurance
- −$38
- HOA
- −$0
- Vacancy / Maint / Mgmt
- −$254
- Net cashflow
- $334
Break-even live
UW: 25.0% down · 7.5% · 30yr · 1.5% tax · 5.0% vac · 8.0% maint · 8.0% mgmt
Financing live
Cash to close
- Down payment
- $22,500
- Closing costs
- $2,700
- Reserves months
- —
- Total cash needed
- —
Loan-product check · same deal, 3 products live
Conventional
25% down · 7.5% · 30yr
- Down + closing
- —
- Monthly P&I
- —
- Monthly cashflow
- —
- DSCR
- —
- Eligible?
- —
Personal DTI + credit; lowest rate.
DSCR
20% down · 8.5% · 30yr
- Down + closing
- —
- Monthly P&I
- —
- Monthly cashflow
- —
- DSCR
- —
- Eligible?
- —
No personal income docs; deal must DSCR.
Hard money
10% down · 12.0% · 12mo
- Down + closing
- —
- Monthly P&I
- —
- Monthly cashflow
- —
- DSCR
- —
- Eligible?
- —
Short-term bridge; refi at stabilization.
Listing history 17 events
-
2026-06-03status $90,000 Pending 53 DOM
-
2026-06-02days on market $90,000 Active 53 DOM
-
2026-06-01days on market $90,000 Active 52 DOM
-
2026-05-31days on market $90,000 Active 51 DOM
-
2026-05-31days on market $90,000 Active 50 DOM
-
2026-04-10$90,000 Active 843-char remark
Show marketing remark (843 chars)
Welcome to the market! This charming 3-bedroom, 1-bath home in the heart of Tyronza offers affordability, comfort, and small-town living at its best. With 1,580 sq ft of living space, this 1.5-story home provides a functional layout perfect for first-time buyers, downsizers, or investors. The home features a new metal roof, central air, natural gas heat, and durable luxury vinyl plank flooring, giving you peace of mind and easy maintenance. Sitting on a spacious lot in a quiet neighborhood, there's plenty of room for outdoor activities, gardening, or future improvements. An attached carport adds convenient covered parking. Whether you're looking for an affordable place to call home or a solid rental investment, this property is full of potential. Don't miss your chance to view this super-cute home—schedule your showing today!
-
2025-11-20price $100,000
-
2025-10-01$115,000 Active
-
2024-09-14$115,000 Active
-
2022-06-13soldstatus $43,240
-
2022-02-18soldstatus $40,000
-
2022-02-18soldstatus $40,000 Sold
-
2022-01-25status Under Contract
-
2021-12-28price $54,900
-
2021-11-17$54,900
-
2021-11-17$59,900 New Listing
-
2016-05-18soldstatus $21,500
ⓘ Source: listings_history table (triggers on properties + properties_extension) + one-shot
backfill from property_details.listing_events for pre-trigger history.
Climate risk First Street
- Flood 1/10 Low FEMA zone X · 0% chance over 30 yrs
- Wildfire 1/10 Low
- Heat 6/10 Major 7 d/yr ≥109°F today · 21 d/yr by 30 yrs out
- Wind 4/10 Moderate 14% chance of damaging wind over 30 yrs
- Air quality 1/10 Low 0 unhealthy d/yr today · 0 by 30 yrs out
Nearby sold comps map
Loading sold comps map…
Walkable amenities ~0.75 mi
Loading nearby amenities…
Taxation est. · year 1
- Rental income
- $14,515
- − Mortgage interest
- −$5,041
- − Property taxes
- −$1,350
- − Insurance
- −$450
- − Repairs & maintenance
- −$1,161
- − Management
- −$1,161
- − Depreciation
- −$2,618
- Taxable income
- $2,733
- Est. tax owed @ 24.0%
- −$656
- After-tax cash flow
- $3,347/yr
For passive investors: Depreciation is non-cash, so a rental often shows a tax loss while cash-flowing — sheltering income. Rental losses are passive: they offset passive income freely, and up to $25,000/yr can offset ordinary (W-2) income if you actively participate and your MAGI is under $100k (phasing out to $0 by $150k); unused losses carry forward. On sale, claimed depreciation is recaptured at up to 25%, and gains may owe capital-gains tax (a 1031 exchange can defer both). Figures are a year-1 estimate at your 24.0% rate — not tax advice; consult a CPA.
Schools (NCES district)
- District
- East Poinsett County School District
- NCES district ID
- 0500048
- Math proficiency
- 36% ▼ -7.00%
- Reading proficiency
- 37% ▼ -4.00%
- Median HH income
- $33,882
- Composite
- 30.05/100
- National rank
- #6352
- State rank
- #113 of 238 in AR
Livability — Tyronza
- Score
- 70/100
- State rank
- #60
- US rank
- #8063
Category grades
Schools grade is shown separately in the Schools card above.
Census & demographics
- Census place
- Tyronza, AR
- Population (ZIP)
- 1,385
Population outlook (Poinsett County) Hauer SSP2
- Today (2025)
- 22,998 people
- By 2030
- 22,356 · -2.8%
- By 2040
- 21,150 · -8.0%
- By 2050
- 20,035 · -12.9%
- By 2075
- 17,745 · -22.8%
- By 2100
- 15,358 · -33.2%
Race, ethnicity, and origin ACS 2023
- Neighborhood character
- Predominantly White (90%)
- Race & ethnicity
- White 90% Two or more races 6% Black 4%
- Common ancestry
- Lithuanian 2% Slovak 1% Serbian 1%
- Foreign-born
- 1% · Canada
- Languages at home
- 99% English-only · Spanish 1%
Political lean MEDSL · Poinsett
- 2024 margin
- Solid R (+63.5) · D 17.4% · R 81.0% · Other 1.6%
- 2008→2024 swing
- -36.3pp toward R · 2008: -27.2pp · 2024: -63.5pp
- All cycles
- 2024: R+63.5 2020: R+59.8 2016: R+24.1 2012: R+34.2 2008: R+27.2
Not yet ingested
- Civics
- —
Market trends
- HPI YoY
- —
- Current HPI
- —
- Rent YoY
- —
- Metro
- —
- State GDP YoY
- ▲ 3.80%
- F500 in state
- 10
Industry mix (Fortune 500 HQ in AR)
| Industry | F500 HQs | Revenue |
|---|---|---|
| Retail | 1 | $681B |
|
||
| Food / Agriculture | 1 | $53B |
|
||
| Retail / Energy | 1 | $22B |
|
||
| Transportation / Logistics | 1 | $12B |
|
||
| Energy | 1 | $4B |
|
||
Price history
+318.6% since first listed12 events — show timeline
- 2026-04-10 Listed $90,000 EARA
- 2025-11-20 Price Changed $100,000 EARA
- 2025-10-01 Listed $115,000 EARA
- 2024-09-14 Listed $115,000 NEABOR MLS
- 2022-06-13 Sold (Public Records) $43,240 Public Records
- 2022-02-18 Sold (MLS) $40,000 CARMLS
- 2022-02-18 Sold (MLS) $40,000 NEABOR MLS
- 2022-01-25 Pending — CARMLS
- 2021-12-28 Price Changed $54,900 CARMLS
- 2021-11-17 Listed $59,900 CARMLS
- 2021-11-17 Listed $54,900 NEABOR MLS
- 2016-05-18 Sold (Public Records) $21,500 Public Records
Property tax history
+3.9%/yrLatest (2025): $30 · -28.4% YoY. Source: county tax records.
Cash-flow waterfall
monthlySold comps — $/sqft
last 12 mo · ≤1 miLoading sold comps…