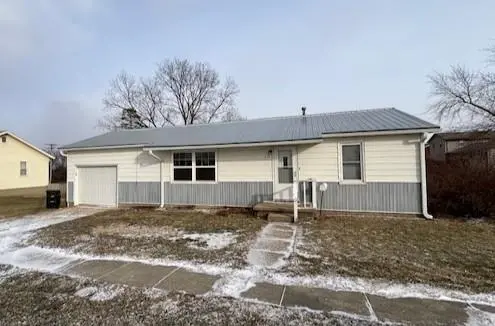
714 N 22nd St · Unionville, MO
Flood risk 1/10 · Minimal
- FEMA flood zone
- X (unshaded)
- Chance of flooding over 30 yrs
- 0.0%
- Est. flood insurance / yr
- $507 – $1,088
Fire risk 4/10 · Minor
- Est. fire insurance / yr
- $1,054 – $1,958
Heat risk 3/10 · Minor
- Hot days now (above 104°F)
- 7 days/yr
- Hot days in 30 yrs
- 15 days/yr
Wind risk 2/10 · Minimal
- Chance of severe wind over 30 yrs
- —
Air-quality risk 2/10 · Minimal
- Unhealthy air days now
- 0 days/yr
- Unhealthy air days in 30 yrs
- 2 days/yr
Risk factors via First Street. Map © Google.
Why this score? — see what drove the B- grade
The composite is a weighted blend of 9 inputs, each scored 0–100. Each bar is that input's sub-score; the figure is the points it added to the 100-point composite (weight × sub-score).
- Cash flow +21.5/30.0
- ARV discount +15.0/15.0
- DSCR +6.9/10.0
- Appreciation +6.2/10.0
- 1% rule +5.6/10.0
- Schools +3.8/10.0
- Livability +3.2/5.0
- Rent growth +2.5/5.0
- Condition / age +2.2/5.0
$79,500
🖨 Deal sheet (PDF) 📄 Offer letter ✓ Due diligence
Listing remarks MLS
Take a look, this 2 Bedroom, 1 Bath Ranch home with hardwood floors throughout, large front living room and combo dining/kitchen area. attached garage, metal roof, replacement vinyl windows & updated AC unit. Great opportunity here for an investor. Call Ami today for a private showing.
Key facts
- Metal roof
- Attached garage
- Hardwood floors
Tags
Neighborhood map
What this means for you Summary
Snapshot
- This is a 2-bed/1.0-bath single-family listed at $80k. Condition is rated fair.
Deal economics
- At list price, monthly cash flow is $119 ($1k/yr) — positive.
- The deal already cash-flows at list — no discount required.
- Meets the 1% rule at list price ($846 rent vs $80k).
- Recommended offer: $70k (12.0% below list) — sets the bar for market timing.
Location & tenants
- Location reads 63/100 on livability (#361 in MO) — a middle-class / working-renter tenant base. Strengths: cost of living A+, housing A+, crime B+; Watch: amenities F, commute F, employment F.
- Putnam County R-I (rural): math 43% / reading 48% proficiency, ranked #100 of 324 in MO (top 31%) — families likely to look elsewhere, expect single-tenant / working-renter base with shorter leases.
- Zoned schools: Putnam Co. Elem. (math 37% / reading 52%, grade F, #413 of 1,115 statewide, top 42%, 299 students, 53% FRL); Putnam Co. Middle (math 42% / reading 42%, grade D-, #149 of 391 statewide, top 41%, 146 students, 61% FRL); Putnam Co. High (math 64% / reading 62%, grade B-, #25 of 521 statewide, top 5%, 209 students, 38% FRL).
- Market conditions: 107 active listings in the ZIP.
Forward outlook
- In year one you build about $3k of equity ($550 loan paydown + $2k appreciation (2.5% local appreciation)).
- Putnam County population projected at -21% by 2050 — secular population decline; favor cash flow + early exit over multi-decade hold.
- At projected returns (2.5% appreciation + 3.0% rent growth), your $22k cash investment doubles in ~5 years — after that, you're playing with house money.
Negotiation context
- It's been on market 152 days — a 12% lower offer ($70k) is reasonable based on typical stale-listing flexibility.
- 3 sale attempts; this cycle's ask has dropped $10k (11%) from the opening price — seller is motivated, your offer sets the floor, not the list.
Questions for the listing agent
- It's been on market 152 days. Have you received any prior offers? Is the seller open to a 12% concession, seller financing, or rate buy-down credit?
- Have any recent inspections been done? Can we get a copy of the seller's disclosures and any deferred-maintenance estimates?
- Built in 1963 — when were the roof, HVAC, electrical panel, plumbing, and water heater last replaced?
- Why hasn't it sold? Are there any deal-killer items the seller is aware of (foundation, flood, title, zoning, code violations)?
- Is there a deadline driving the sale (1031 exchange, divorce, estate, relocation)? That informs how much negotiation room exists.
- What's the average days-on-market for RENTAL listings here right now (not sales)? A rising rental-DOM trend means longer vacancies and softer asking-rent achievability than the comps imply.
- What's the recent tenant-quality profile in this submarket — average credit score on applications, eviction rate, late-payment / NSF rate, and stable-employment percentage? A property-management company in the area should have these aggregated.
- How much new for-sale + rental construction is in the pipeline within 1–3 miles? Heavy new supply typically softens prices + rents 12–24 months out; constrained supply supports both.
Investment metrics
- 1% rule
- 1.06% ✓
- Cap rate
- 8.09%
- Cash-on-cash
- 6.42%
- DSCR
- 1.29
- GRM
- 7.8
CMA / ARV
- ARV (median comp)
- $145,750
- List price
- $79,500
- Delta
- -45.45%
- Verdict
- UNDERPRICED
- Comps
- 4 within 1.0 mi
Show comp detail 3 sales within ~0.75 mi
| Address | Dist | Beds/Ba | Sqft | Sold | Price | $/sf | Match |
|---|---|---|---|---|---|---|---|
| 2013 Monroe St | 0.24mi | 2/1.0 | 962 (+7%) | 2mo | $122,500 | $127 | 75 |
| 307 N 25th St | 0.34mi | 3/1.0 (+1) | 960 (+7%) | 11mo | $187,500 | $195 | 59 |
| 510 S 18th St | 0.71mi | 2/1.5 | 1,026 (+14%) | 4mo | $80,000 | $78 | 38 |
Match score weights: distance 35% · size 25% · config 20% · recency 20%. Top-matched comps best support the ARV.
Projected returns pro-forma
2.49% appreciation · 3.0% rent growth · sell at horizon
- IRR
- 12.2%
- Equity multiple
- 1.68×
- Total profit
- $15,046
- Equity at exit
- $33,483
- IRR
- 14.6%
- Equity multiple
- 3.05×
- Total profit
- $45,665
- Equity at exit
- $49,906
Cash invested: $22,260 (down + closing). Projections, not guarantees.
Landlord ↔ Tenant lean methodology
- Overall (STATE)
- 81 Strongly Landlord-Friendly
- State Missouri
- 81 Strongly Landlord-Friendly · R+10
- County
- — inherits STATE
- City
- — inherits STATE
ZIP-level market 63565
- Home prices YoY
- 1.4%
- Active inventory
- 107
- Price-to-rent
- 7.8×
Monthly cashflow live
- Estimated rent
- $846 medium interval (Pro) →
- Mortgage (P&I)
- −$417
- Tax est. 1.5%
- −$99 /mo · $1,192/yr
- Insurance
- −$33
- HOA
- −$0
- Vacancy / Maint / Mgmt
- −$178
- Net cashflow
- $119
Break-even live
Sensitivity live
| Price | -10% $174 | -5% $147 | +0% $119 | +5% $92 | +10% $64 |
|---|---|---|---|---|---|
| Rent | -10% $52 | -5% $86 | +0% $119 | +5% $152 | +10% $186 |
| Rate | -1.0pp $159 | -0.5pp $139 | base $119 | +0.5pp $98 | +1.0pp $78 |
UW: 25.0% down · 7.5% · 30yr · 1.5% tax · 5.0% vac · 8.0% maint · 8.0% mgmt
Financing live
Cash to close
- Down payment
- $19,875
- Closing costs
- $2,385
- Reserves months
- —
- Total cash needed
- —
Loan-product check · same deal, 3 products live
Conventional
25% down · 7.5% · 30yr
- Down + closing
- —
- Monthly P&I
- —
- Monthly cashflow
- —
- DSCR
- —
- Eligible?
- —
Personal DTI + credit; lowest rate.
DSCR
20% down · 8.5% · 30yr
- Down + closing
- —
- Monthly P&I
- —
- Monthly cashflow
- —
- DSCR
- —
- Eligible?
- —
No personal income docs; deal must DSCR.
Hard money
10% down · 12.0% · 12mo
- Down + closing
- —
- Monthly P&I
- —
- Monthly cashflow
- —
- DSCR
- —
- Eligible?
- —
Short-term bridge; refi at stabilization.
Listing history 22 events
-
2026-06-21days on market $79,500 Active 152 DOM
-
2026-06-21days on market $79,500 Active 151 DOM
-
2026-06-18days on market $79,500 Active 149 DOM
-
2026-06-17days on market $79,500 Active 148 DOM
-
2026-06-16days on market $79,500 Active 147 DOM
-
2026-06-15days on market $79,500 Active 146 DOM
-
2026-06-13days on market $79,500 Active 144 DOM
-
2026-06-12days on market $79,500 Active 143 DOM
-
2026-06-09days on market $79,500 Active 140 DOM
-
2026-06-08days on market $79,500 Active 139 DOM
-
2026-06-07days on market $79,500 Active 138 DOM
-
2026-06-07days on market $79,500 Active 137 DOM
-
2026-06-04days on market $79,500 Active 134 DOM
-
2026-06-02days on market $79,500 Active 133 DOM
-
2026-06-01days on market $79,500 Active 132 DOM
-
2026-05-31days on market $79,500 Active 131 DOM
-
2026-04-17price $79,500 292-char remark
Show marketing remark (292 chars)
Take a look, this 2 Bedroom, 1 Bath Ranch home with hardwood floors throughout, large front living room and combo dining/kitchen area. attached garage, metal roof, replacement vinyl windows & updated AC unit. Great opportunity here for an investor. Call Ami today for a private showing.
-
2026-03-24price $85,000 292-char remark
Show marketing remark (292 chars)
Take a look, this 2 Bedroom, 1 Bath Ranch home with hardwood floors throughout, large front living room and combo dining/kitchen area. attached garage, metal roof, replacement vinyl windows & updated AC unit. Great opportunity here for an investor. Call Ami today for a private showing.
-
2026-01-21$89,000 Active 292-char remark
Show marketing remark (292 chars)
Take a look, this 2 Bedroom, 1 Bath Ranch home with hardwood floors throughout, large front living room and combo dining/kitchen area. attached garage, metal roof, replacement vinyl windows & updated AC unit. Great opportunity here for an investor. Call Ami today for a private showing.
-
2025-11-21price $104,000
-
2025-11-12$124,000 Active
-
2025-08-07$125,000 Active
ⓘ Source: listings_history table (triggers on properties + properties_extension) + one-shot
backfill from property_details.listing_events for pre-trigger history.
Climate risk First Street
- Flood 1/10 Low FEMA zone X (unshaded) · 0% chance over 30 yrs
- Wildfire 4/10 Moderate
- Heat 3/10 Moderate 7 d/yr ≥104°F today · 15 d/yr by 30 yrs out
- Wind 2/10 Low
- Air quality 2/10 Low 0 unhealthy d/yr today · 2 by 30 yrs out
Nearby sold comps map
Loading sold comps map…
Walkable amenities ~0.75 mi
Loading nearby amenities…
Taxation est. · year 1
- Rental income
- $10,154
- − Mortgage interest
- −$4,453
- − Property taxes
- −$1,192
- − Insurance
- −$398
- − Repairs & maintenance
- −$812
- − Management
- −$812
- − Depreciation
- −$2,313
- Taxable income
- $174
- Est. tax owed @ 24.0%
- −$42
- After-tax cash flow
- $1,387/yr
For passive investors: Depreciation is non-cash, so a rental often shows a tax loss while cash-flowing — sheltering income. Rental losses are passive: they offset passive income freely, and up to $25,000/yr can offset ordinary (W-2) income if you actively participate and your MAGI is under $100k (phasing out to $0 by $150k); unused losses carry forward. On sale, claimed depreciation is recaptured at up to 25%, and gains may owe capital-gains tax (a 1031 exchange can defer both). Figures are a year-1 estimate at your 24.0% rate — not tax advice; consult a CPA.
Condition & rehab AI · 13 photos
This 2-bedroom, 1-bath ranch home requires moderate updates to its kitchen and bathroom, with some exterior and interior maintenance needed. Upgrading the kitchen and improving the landscaping can significantly increase its value for both resale and rental.
Repairs flagged
- Moderate Kitchen cabinets — Older cabinets with visible wear and tear.
- Minor Bathroom fixtures — Basic fixtures in need of updating.
Value-add opportunities
- Resale New kitchen cabinets and countertops — Modernizing the kitchen will attract more buyers.
- Both Landscaping and curb appeal improvements — Enhances the home's curb appeal and can increase both resale and rental value.
Renovation cost estimate screening
| Repair item | Severity | Est. cost |
|---|---|---|
| Kitchen cabinets · Older cabinets with visible wear and tear. | Moderate | $3,000–15,000 |
| Bathroom fixtures · Basic fixtures in need of updating. | Minor | $500–3,000 |
| Total estimated repair cost · 2 items | $3,500–18,000 |
Value-add ROI direction
- Resale New kitchen cabinets and countertops — Modernizing the kitchen will attract more buyers. ↑
- Both Landscaping and curb appeal improvements — Enhances the home's curb appeal and can increase both resale and rental value. ↑
ⓘ Cost ranges are severity-bucket heuristics (US national rule-of-thumb). Get contractor quotes + a written scope before underwriting a rehab budget.
Schools (NCES district)
- District
- Putnam County R-I
- NCES district ID
- 2925640
- Math proficiency
- 43% ▼ -5.00%
- Reading proficiency
- 48% ▼ -2.00%
- Median HH income
- $37,212
- Composite
- 37.82/100
- National rank
- #4334
- State rank
- #100 of 324 in MO
Livability — Unionville
- Score
- 63/100
- State rank
- #361
- US rank
- #15905
Category grades
Schools grade is shown separately in the Schools card above.
Census & demographics
- Census place
- Unionville, MO
- Population (ZIP)
- 3,975
Population outlook (Putnam County) Hauer SSP2
- Today (2025)
- 4,530 people
- By 2030
- 4,318 · -4.7%
- By 2040
- 3,922 · -13.4%
- By 2050
- 3,563 · -21.3%
- By 2075
- 2,855 · -37.0%
- By 2100
- 2,162 · -52.3%
Race, ethnicity, and origin ACS 2023
- Neighborhood character
- Predominantly White (96%)
- Race & ethnicity
- White 96% Two or more races 3% Hispanic / Latino 2%
- Common ancestry
- Slovak 4% Portuguese 2% Iranian 2%
- Foreign-born
- 2% · Canada
- Languages at home
- 96% English-only · German/W. Germanic 2% Spanish 2%
Political lean MEDSL · Putnam
- 2024 margin
- Solid R (+70.3) · D 14.6% · R 84.9%
- 2008→2024 swing
- -32.0pp toward R · 2008: -38.3pp · 2024: -70.3pp
- All cycles
- 2024: R+70.3 2020: R+68.7 2016: R+67.6 2012: R+47.0 2008: R+38.3
Not yet ingested
- Civics
- —
Market trends
- HPI YoY
- ▲ 2.49%
- Current HPI
- 183.3099
- Rent YoY
- —
- Metro
- —
- State GDP YoY
- ▲ 1.84%
- F500 in state
- 20
Industry mix (Fortune 500 HQ in MO)
| Industry | F500 HQs | Revenue |
|---|---|---|
| Healthcare | 1 | $163B |
|
||
| Insurance | 1 | $21B |
|
||
| Industrial Technology | 1 | $17B |
|
||
| Retail | 1 | $16B |
|
||
| Industrial Distribution | 1 | $10B |
|
||
| Utilities | 1 | $9B |
|
||
Price history
-36.4% since first listed6 events — show timeline
- 2026-04-17 Price Changed $79,500 NECAR
- 2026-03-24 Price Changed $85,000 NECAR
- 2026-01-21 Listed $89,000 NECAR
- 2025-11-21 Price Changed $104,000 NECAR
- 2025-11-12 Listed $124,000 NECAR
- 2025-08-07 Listed $125,000 NECAR
Cash-flow waterfall
monthlySold comps — $/sqft
last 12 mo · ≤1 miLoading sold comps…