20 Seager Ct · Campbell, NY
Flood risk 1/10 · Minimal
- FEMA flood zone
- X (shaded)
- Chance of flooding over 30 yrs
- 0.0%
- Est. flood insurance / yr
- $507 – $1,088
Fire risk 2/10 · Minimal
- Est. fire insurance / yr
- $691 – $1,283
Heat risk 3/10 · Minor
- Hot days now (above 95°F)
- 7 days/yr
- Hot days in 30 yrs
- 18 days/yr
Wind risk 1/10 · Minimal
- Chance of severe wind over 30 yrs
- —
Air-quality risk 1/10 · Minimal
- Unhealthy air days now
- 0 days/yr
- Unhealthy air days in 30 yrs
- 0 days/yr
Risk factors via First Street. Map © Google.
Why this score? — see what drove the C grade
The composite is a weighted blend of 9 inputs, each scored 0–100. Each bar is that input's sub-score; the figure is the points it added to the 100-point composite (weight × sub-score).
- Cash flow +15.0/30.0
- ARV discount +8.1/15.0
- Appreciation +8.0/10.0
- 1% rule +5.0/10.0
- DSCR +5.0/10.0
- Schools +4.5/10.0
- Condition / age +4.0/5.0
- Livability +3.1/5.0
- Rent growth +2.5/5.0
$19,900
🖨 Deal sheet (PDF) 📄 Offer letter ✓ Due diligence
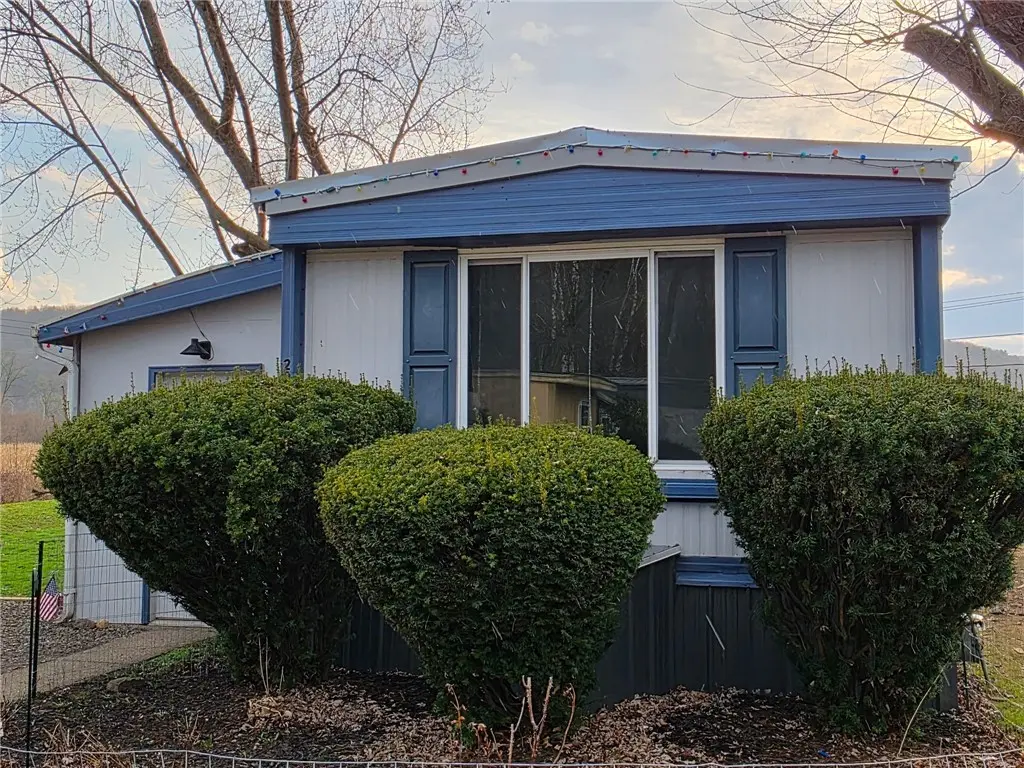
Listing remarks
Affordable and beautifully updated 2-bedroom, 1 full bath home located in a mobile home park. This home has been completely gutted and fully remodeled, featuring a brand-new custom-built kitchen, updated appliances, a beautifully renovated bathroom, updated electric, new flooring throughout, and many additional upgrades. Move right in and enjoy the fresh, modern feel at an unbeatable price. Lot rent is $470.85/month and includes taxes, garbage, snow plowing, and sewer. Financing options available with 25% down. Proof of funds or pre-approval letter required prior to all showings.
Key facts
- Built 1977
- Listed 28 days
Neighborhood map
What this means for you Summary
Snapshot
- This is a 2-bed/1.0-bath manufactured listed at $20k. Condition is rated good.
Deal economics
- At list price, monthly cash flow is $594 ($7k/yr) — positive.
- The deal already cash-flows at list — no discount required.
- Meets the 1% rule at list price ($926 rent vs $20k).
- Recommended offer: $20k (1.5% below list) — sets the bar for market timing.
Location & tenants
- Location reads 61/100 on livability (#917 in NY) — a middle-class / working-renter tenant base. Strengths: cost of living A+, housing A-, schools B; Watch: employment D+, health & safety D, crime F.
- Campbell-Savona Central School District (rural): math 50% / reading 56% proficiency, ranked #334 of 590 in NY (top 57%) — acceptable for families but not a draw, mixed tenant base, ~2y average lease.
- Market conditions: 17 active listings in the ZIP; 196 units permitted in Steuben County in 2024 (0 in 5+ unit buildings).
Forward outlook
- In year one you build about $1k of equity ($138 loan paydown + $1k appreciation (6.1% local appreciation)).
- Steuben County population projected at -20% by 2050 — secular population decline; favor cash flow + early exit over multi-decade hold.
- At projected returns (6.1% appreciation + 3.0% rent growth), your $6k cash investment doubles in ~1 year — after that, you're playing with house money.
Negotiation context
- It's been on market 28 days — a 2% lower offer ($20k) is reasonable based on typical stale-listing flexibility.
Questions for the listing agent
- Built in 1977 — when were the roof, HVAC, electrical panel, plumbing, and water heater last replaced?
- Is there a deadline driving the sale (1031 exchange, divorce, estate, relocation)? That informs how much negotiation room exists.
- Schools are B-rated — typically a magnet for longer-tenancy family renters. What's the average tenant stay here, and is there a school-zone premium baked into asking?
- Crime grade is F in this area — have there been break-ins, vandalism, or insurance claims at this property in the last 3 years? What carrier currently insures it and at what premium?
- What's the average days-on-market for RENTAL listings here right now (not sales)? A rising rental-DOM trend means longer vacancies and softer asking-rent achievability than the comps imply.
- What's the recent tenant-quality profile in this submarket — average credit score on applications, eviction rate, late-payment / NSF rate, and stable-employment percentage? A property-management company in the area should have these aggregated.
- How much new for-sale + rental construction is in the pipeline within 1–3 miles? Heavy new supply typically softens prices + rents 12–24 months out; constrained supply supports both.
Investment metrics
- 1% rule
- 4.65% ✓
- Cap rate
- 42.11%
- Cash-on-cash
- 127.91%
- DSCR
- 6.69
- GRM
- 1.8
CMA / ARV
- ARV (on-the-fly)
- $20,160
- Comps found
- 1
Show comp detail 1 sale within ~0.75 mi
| Address | Dist | Beds/Ba | Sqft | Sold | Price | $/sf | Match |
|---|---|---|---|---|---|---|---|
| 20 Seager Ct | 0.00mi | 2/1.0 | 840 (0%) | 0mo | $19,900 | $24 | 100 |
Match score weights: distance 35% · size 25% · config 20% · recency 20%. Top-matched comps best support the ARV.
Projected returns pro-forma
6.07% appreciation · 3.0% rent growth · sell at horizon
- IRR
- —
- Equity multiple
- 8.84×
- Total profit
- $43,668
- Equity at exit
- $12,596
- IRR
- —
- Equity multiple
- 18.74×
- Total profit
- $98,835
- Equity at exit
- $22,916
Cash invested: $5,572 (down + closing). Projections, not guarantees.
Landlord ↔ Tenant lean methodology
- Overall (STATE)
- 15 Strongly Tenant-Friendly
- State New York
- 15 Strongly Tenant-Friendly · D+10
- County
- — inherits STATE
- City
- — inherits STATE
ZIP-level market 14821
- Home prices YoY
- 2.8%
- Active inventory
- 17
- Price-to-rent
- 1.8×
Monthly cashflow live
- Estimated rent
- $926 medium interval (Pro) →
- Mortgage (P&I)
- −$104
- Tax est. 1.5%
- −$25 /mo · $298/yr
- Insurance
- −$8
- HOA
- −$0
- Vacancy / Maint / Mgmt
- −$194
- Net cashflow
- $594
Break-even live
Sensitivity live
| Price | -10% $608 | -5% $601 | +0% $594 | +5% $587 | +10% $580 |
|---|---|---|---|---|---|
| Rent | -10% $521 | -5% $557 | +0% $594 | +5% $631 | +10% $667 |
| Rate | -1.0pp $604 | -0.5pp $599 | base $594 | +0.5pp $589 | +1.0pp $584 |
UW: 25.0% down · 7.5% · 30yr · 1.5% tax · 5.0% vac · 8.0% maint · 8.0% mgmt
Financing live
Cash to close
- Down payment
- $4,975
- Closing costs
- $597
- Reserves months
- —
- Total cash needed
- —
Loan-product check · same deal, 3 products live
Conventional
25% down · 7.5% · 30yr
- Down + closing
- —
- Monthly P&I
- —
- Monthly cashflow
- —
- DSCR
- —
- Eligible?
- —
Personal DTI + credit; lowest rate.
DSCR
20% down · 8.5% · 30yr
- Down + closing
- —
- Monthly P&I
- —
- Monthly cashflow
- —
- DSCR
- —
- Eligible?
- —
No personal income docs; deal must DSCR.
Hard money
10% down · 12.0% · 12mo
- Down + closing
- —
- Monthly P&I
- —
- Monthly cashflow
- —
- DSCR
- —
- Eligible?
- —
Short-term bridge; refi at stabilization.
Listing history 3 events
-
2026-05-06status Pending
-
2026-04-21historical Active Under Contract
-
2026-04-08$19,900 Active
ⓘ Source: listings_history table (triggers on properties + properties_extension) + one-shot
backfill from property_details.listing_events for pre-trigger history.
Climate risk First Street
- Flood 1/10 Low FEMA zone X (shaded) · 0% chance over 30 yrs
- Wildfire 2/10 Low
- Heat 3/10 Moderate 7 d/yr ≥95°F today · 18 d/yr by 30 yrs out
- Wind 1/10 Low
- Air quality 1/10 Low 0 unhealthy d/yr today · 0 by 30 yrs out
Nearby sold comps map
Loading sold comps map…
Walkable amenities ~0.75 mi
Loading nearby amenities…
Taxation est. · year 1
- Rental income
- $11,111
- − Mortgage interest
- −$1,115
- − Property taxes
- −$298
- − Insurance
- −$100
- − Repairs & maintenance
- −$889
- − Management
- −$889
- − Depreciation
- −$579
- Taxable income
- $7,241
- Est. tax owed @ 24.0%
- −$1,738
- After-tax cash flow
- $5,389/yr
For passive investors: Depreciation is non-cash, so a rental often shows a tax loss while cash-flowing — sheltering income. Rental losses are passive: they offset passive income freely, and up to $25,000/yr can offset ordinary (W-2) income if you actively participate and your MAGI is under $100k (phasing out to $0 by $150k); unused losses carry forward. On sale, claimed depreciation is recaptured at up to 25%, and gains may owe capital-gains tax (a 1031 exchange can defer both). Figures are a year-1 estimate at your 24.0% rate — not tax advice; consult a CPA.
Condition & rehab AI · 2 photos
This 2-bedroom, 1-bath manufactured home has been gutted and fully remodeled, featuring a new kitchen and bathroom, and new flooring. It is in good condition with minor cosmetic updates, making it move-in ready and ready for a fresh paint job and landscaping to enhance its curb appeal and value.
Value-add opportunities
- Both Landscaping improvements — Enhances curb appeal and adds value
- Both Painting exterior — Fresh paint improves curb appeal and value
- Both Landscaping and curb appeal — Improves overall aesthetic and value
Renovation cost estimate screening
Value-add ROI direction
- Both Landscaping improvements — Enhances curb appeal and adds value ↑
- Both Painting exterior — Fresh paint improves curb appeal and value ↑
- Both Landscaping and curb appeal — Improves overall aesthetic and value ↑
ⓘ Cost ranges are severity-bucket heuristics (US national rule-of-thumb). Get contractor quotes + a written scope before underwriting a rehab budget.
Schools (NCES district)
- District
- Campbell-Savona Central School District
- NCES district ID
- 3600020
- Math proficiency
- 50% ▬ 0.00%
- Reading proficiency
- 56% ▲ 12.00%
- Median HH income
- $49,653
- Composite
- 45.22/100
- National rank
- #2667
- State rank
- #334 of 590 in NY
Livability — Campbell
- Score
- 61/100
- State rank
- #917
- US rank
- #17948
Category grades
Schools grade is shown separately in the Schools card above.
Census & demographics
- Census place
- Campbell, NY
- Population (ZIP)
- 3,015
Population outlook (Steuben County) Hauer SSP2
- Today (2025)
- 93,062 people
- By 2030
- 89,793 · -3.5%
- By 2040
- 82,353 · -11.5%
- By 2050
- 74,286 · -20.2%
- By 2075
- 55,589 · -40.3%
- By 2100
- 37,587 · -59.6%
Race, ethnicity, and origin ACS 2023
- Neighborhood character
- Predominantly White (95%)
- Race & ethnicity
- White 95% Two or more races 3%
- Common ancestry
- Romanian 3% Lithuanian 3% Italian 2%
- Foreign-born
- 0%
- Languages at home
- 97% English-only · German/W. Germanic 2%
Political lean MEDSL · Steuben
- 2024 margin
- Solid R (+31.8) · D 34.1% · R 65.9%
- 2008→2024 swing
- -15.0pp toward R · 2008: -16.8pp · 2024: -31.8pp
- All cycles
- 2024: R+31.8 2020: R+29.6 2016: R+36.2 2012: R+16.4 2008: R+16.8
Not yet ingested
- Civics
- —
Market trends
- HPI YoY
- ▲ 6.07%
- Current HPI
- 224.5452
- Rent YoY
- —
- Metro
- —
- State GDP YoY
- ▲ 2.60%
- F500 in state
- 92
Industry mix (Fortune 500 HQ in NY)
| Industry | F500 HQs | Revenue |
|---|---|---|
| Financial Services | 10 | $950B |
|
||
| Consumer Goods | 9 | $162B |
|
||
| Insurance | 4 | $225B |
|
||
| Telecommunications | 2 | $144B |
|
||
| Pharmaceuticals | 2 | $112B |
|
||
| Media / Entertainment | 2 | $69B |
|
||
Price history
3 events — show timeline
- 2026-05-06 Pending — UNYREIS
- 2026-04-21 Contingent — UNYREIS
- 2026-04-08 Listed $19,900 UNYREIS
Cash-flow waterfall
monthlySold comps — $/sqft
last 12 mo · ≤1 miLoading sold comps…