15614 Lemon Pepper Crk · San Antonio, TX
Flood risk No data
- FEMA flood zone
- —
- Chance of flooding over 30 yrs
- —
- Est. flood insurance / yr
- —
Fire risk No data
- Est. fire insurance / yr
- —
Heat risk No data
- Hot days now (above threshold)
- —
- Hot days in 30 yrs
- —
Wind risk No data
- Chance of severe wind over 30 yrs
- —
Air-quality risk No data
- Unhealthy air days now
- —
- Unhealthy air days in 30 yrs
- —
Risk factors via First Street. Map © Google.
Why this score? — see what drove the D grade
The composite is a weighted blend of 9 inputs, each scored 0–100. Each bar is that input's sub-score; the figure is the points it added to the 100-point composite (weight × sub-score).
- ARV discount +10.8/15.0
- Cash flow +8.1/30.0
- Appreciation +6.3/10.0
- Livability +4.0/5.0
- 1% rule +2.7/10.0
- Rent growth +2.5/5.0
- Condition / age +2.5/5.0
- Schools +2.2/10.0
- DSCR +2.1/10.0
$275,605
🖨 Deal sheet 📄 Offer letter ✓ Due diligence
Listing remarks
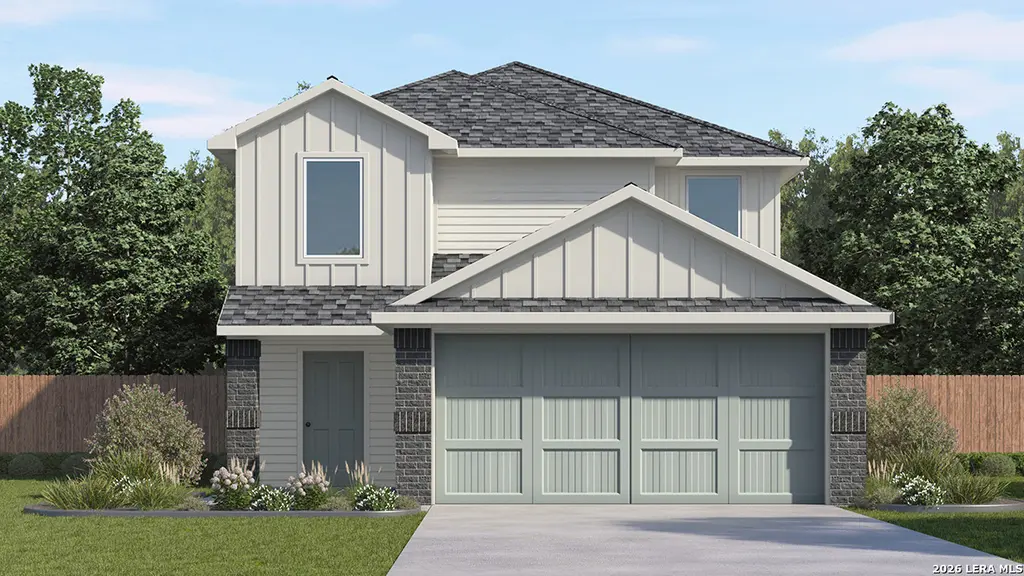
Welcome to The Garner, a 5 bedroom, 2.5 bath floor plan featured at Preserve at Medina in Von Ormy, TX. This new home layout offers 2203 square feet of living space, 2 stories and a 2-car garage that provides direct interior access to the home. Step through the foyer into a bright, open-concept living space where the kitchen, dining area and family room flow seamlessly together - perfect for everyday living and entertaining. The kitchen features quartz countertops, stainless steel appliances, and shaker style cabinetry, as well as a large kitchen island with a deep farmhouse sink. The dining area connects naturally to the family room, creating a warm, connected atmosphere filled with natura
Key facts
- Large kitchen island
- Deep farmhouse sink
- Quartz countertops
Tags
Property features AI
Finance
- Other: Subdivision: PRESERVE AT MEDINA
- HOA & community: Mandatory HOA with annual fee; HOA fee $396 annually; Neighborhood amenities include park/playground
Exterior
- Parking: 2-car garage
- Utilities: Water and sewer provided by SAWS; Electric and gas supplied by CPS; HERS rated with low-flow commode
- Home design: New construction by D.R. Horton; Brick, siding, and cement fiber exterior; Slab foundation; Composition roof
- Construction: Built new (approximate age: 0)
- Exterior features: Patio slab; Privacy fence; Sprinkler system; Double pane windows; Street paved with curbs and streetlights
Interior
- Kitchen: Gas cooking; Stove/Range; Dishwasher; Garbage disposal; Ice maker connection
- Bedrooms: Primary bedroom on lower level with walk-in closet and full bath; Bedroom 2: 11 x 11; Bedroom 3: 12 x 12; Bedroom 4: 13 x 11; Bedroom 5: 11 x 11; Primary bedroom: 12 x 14
- Flooring: Carpeting; Vinyl flooring
- Bathrooms: 2 full bathrooms and 1 half bath; Primary bath with shower only and single vanity
- Heating & cooling: Central heating (natural gas); Central air conditioning
- Interior features: Open floor plan with living/dining room combination; Island kitchen with breakfast bar; Solid countertops; Vent fan; Smoke alarm and carbon monoxide detector; Attic with pull-down stairs; All window coverings remain; High-speed internet available; 1 living area
- Laundry & utility: Laundry room on lower level; Washer and dryer connections; Gas water heater; Utility room: 8 x 6
Neighborhood map
What this means for you Summary
Snapshot
- This is a 5-bed/2.5-bath single-family listed at $276k.
Deal economics
- At list price, monthly cash flow is $-271 ($-3k/yr) — negative.
- To cash-flow at today's rent, offer at most $236k (14.2% below list).
- To meet the 1% rule (rent ≥ 1% of price), the offer needs to be $211k (23.5% below list).
- Recommended offer: $211k (23.5% below list) — sets the bar for 1% rule.
- Cap rate 5.1% vs local median 3.8% in San Antonio — top-decile yield for the area; either an underpriced asset or a hidden risk that comps aren't pricing in. Stress-test before assuming the spread holds.
Location & tenants
- Location reads 80/100 on livability (#31 in TX, #1,616 nationally) — a professional / high-income tenant draw. Strengths: amenities A+, commute A+, cost of living A+; Watch: crime F.
- Southwest ISD (rural): math 21% / reading 31% proficiency, ranked #701 of 826 in TX (top 85%) — low school quality limits family demand, transient renter base, plan for 1-2y turnover; 75% free/reduced lunch — lower-income household profile, screen leases tightly.
- Zoned schools: Spicewood Park El (math 16% / reading 23%, grade F, #3,583 of 4,322 statewide, top 86%, 593 students, 93% FRL) — zoned schools average 93% FRL vs 75% district-wide (18 pts higher); higher-poverty schools than district average — tighter screening recommended.
- Market conditions: 324 active listings in the ZIP; 6 comparable units currently listed for rent nearby; rentals at typical pace (median 22d on market — plan ~3-4 weeks tenant-placement turnaround); 8,308 units permitted in Bexar County in 2024 (2,506 in 5+ unit buildings).
Forward outlook
- In year one you build about $9k of equity ($2k loan paydown + $7k appreciation (2.6% local appreciation)).
- Bexar County population projected at +50% by 2050 — long-run rental-demand tailwind backs the buy-and-hold thesis.
- By year 4, paydown + projected appreciation supports a ~$31k cash-out refi (75% LTV) — recoverable capital for the next deal without selling this one.
Negotiation context
- Only 11 days on market — expect competitive offers; lowballing is unlikely to land.
Questions for the listing agent
- What do current leases actually rent for vs. the listed asking? Can we see a recent rent roll and the last 12 months of T-12 income?
- What does the HOA fee cover, when was the last increase, and are there any pending special assessments or reserve-fund shortfalls?
- Is there a deadline driving the sale (1031 exchange, divorce, estate, relocation)? That informs how much negotiation room exists.
- Crime grade is F in this area — have there been break-ins, vandalism, or insurance claims at this property in the last 3 years? What carrier currently insures it and at what premium?
- The area grade is low — what's the realistic commute time and amenity access for the typical tenant pool here? Any planned neighborhood developments (good or bad) we should know about?
- What's the average days-on-market for RENTAL listings here right now (not sales)? A rising rental-DOM trend means longer vacancies and softer asking-rent achievability than the comps imply.
- What's the recent tenant-quality profile in this submarket — average credit score on applications, eviction rate, late-payment / NSF rate, and stable-employment percentage? A property-management company in the area should have these aggregated.
- How much new for-sale + rental construction is in the pipeline within 1–3 miles? Heavy new supply typically softens prices + rents 12–24 months out; constrained supply supports both.
Investment metrics
- 1% rule
- 0.77% ✗
- Cap rate
- 5.11%
- Cash-on-cash
- -4.21%
- DSCR
- 0.81
- GRM
- 10.9
CMA / ARV
- ARV (on-the-fly)
- $297,405
- Comps found
- 12
Show comp detail 12 sales within ~0.75 mi
| Address | Dist | Beds/Ba | Sqft | Sold | Price | $/sf | Match |
|---|---|---|---|---|---|---|---|
| 15703 Cardamom | 0.05mi | 4/2.5 (-1) | 2,186 (-1%) | 4mo | $231,000 | $106 | 88 |
| 4235 Paprika Grv | 0.20mi | 5/2.5 | 1,971 (-10%) | 1mo | $262,265 | $133 | 72 |
| 4235 Marjoram Lndg | 0.24mi | 5/2.5 | 1,971 (-10%) | 1mo | $262,265 | $133 | 70 |
| 15423 Mint Patch Mdw | 0.27mi | 5/2.5 | 1,971 (-10%) | 2mo | $256,765 | $130 | 68 |
| 4335 Rocky Neck Cv | 0.47mi | 4/2.5 (-1) | 2,198 (-0%) | 8mo | $335,900 | $153 | 66 |
| 4223 Marjoram Lndg | 0.23mi | 5/2.5 | 1,892 (-14%) | 1mo | $254,795 | $135 | 65 |
| 4230 Paprika Grv | 0.16mi | 5/2.5 | 1,892 (-14%) | 6mo | $268,499 | $142 | 64 |
| 4239 Marjoram Lndg | 0.25mi | 5/2.5 | 1,892 (-14%) | 2mo | $255,295 | $135 | 64 |
| 15431 Mint Patch Mdw | 0.26mi | 5/2.5 | 1,892 (-14%) | 2mo | $254,795 | $135 | 63 |
| 4267 Marjoram Lndg | 0.29mi | 5/2.5 | 1,892 (-14%) | 2mo | $255,295 | $135 | 62 |
| 15527 Mint Patch Mdw | 0.23mi | 5/2.5 | 1,892 (-14%) | 6mo | $268,499 | $142 | 60 |
| 15210 Snug Hbr | 0.59mi | 5/2.5 | 2,531 (+15%) | 2mo | $259,999 | $103 | 46 |
Match score weights: distance 35% · size 25% · config 20% · recency 20%. Top-matched comps best support the ARV.
Projected returns pro-forma
2.6% appreciation · 3.0% rent growth · sell at horizon
- IRR
- 2.4%
- Equity multiple
- 1.13×
- Total profit
- $10,218
- Equity at exit
- $117,780
- IRR
- 6.0%
- Equity multiple
- 1.88×
- Total profit
- $67,977
- Equity at exit
- $176,874
Cash invested: $77,169 (down + closing). Projections, not guarantees.
Landlord ↔ Tenant lean methodology
- Overall (STATE)
- 87 Strongly Landlord-Friendly
- State Texas
- 87 Strongly Landlord-Friendly · R+5
- County
- — inherits STATE
- City
- — inherits STATE
ZIP-level market 78073
- Home prices YoY
- 0.9%
- Active inventory
- 324
- Price-to-rent
- 10.9×
Monthly cashflow live
- Estimated rent
- $2,110 high interval (Pro) →
- Mortgage (P&I)
- −$1,445
- Tax est. 1.5%
- −$345 /mo · $4,134/yr
- Insurance
- −$115
- HOA
- −$33
- Vacancy / Maint / Mgmt
- −$443
- Net cashflow
- $-271
Break-even live
UW: 25.0% down · 7.5% · 30yr · 1.5% tax · 5.0% vac · 8.0% maint · 8.0% mgmt
Financing live
Cash to close
- Down payment
- $68,901
- Closing costs
- $8,268
- Reserves months
- —
- Total cash needed
- —
Loan-product check · same deal, 3 products live
Conventional
25% down · 7.5% · 30yr
- Down + closing
- —
- Monthly P&I
- —
- Monthly cashflow
- —
- DSCR
- —
- Eligible?
- —
Personal DTI + credit; lowest rate.
DSCR
20% down · 8.5% · 30yr
- Down + closing
- —
- Monthly P&I
- —
- Monthly cashflow
- —
- DSCR
- —
- Eligible?
- —
No personal income docs; deal must DSCR.
Hard money
10% down · 12.0% · 12mo
- Down + closing
- —
- Monthly P&I
- —
- Monthly cashflow
- —
- DSCR
- —
- Eligible?
- —
Short-term bridge; refi at stabilization.
Rent comps 6 comps
| Address | Beds | Baths | Sqft | Rent | $/sqft | DOM | Units | Dist |
|---|---|---|---|---|---|---|---|---|
| 15559 Mint Patch Mdw Unit 1 Von Ormy, TX | 5.0 | 3.0 | 2498 | $600 | $0.24 | 43d | 1 | 0.17mi |
| 4323 Caraway Bay Von Ormy, TX | 3.0–4.0 | 2.0 | 1572 | $2,305 | $1.47 | 1d | 6 | 0.36mi |
| 15115 Harbor Lndg Von Ormy, TX | 4.0 | 2.0 | 1794 | $1,795 | $1.00 | 14d | 1 | 0.39mi |
| 15114 Harbor Lndg Von Ormy, TX | 4.0 | 3.5 | 2198 | $2,000 | $0.91 | 21d | 1 | 0.39mi |
| 15315 Waterow Vw Von Ormy, TX | 3.0–5.0 | 2.0–3.5 | 1781 | $2,400 | $1.35 | 1d | 1 | 0.41mi |
| 15237 Snug Harbor Way Von Ormy, TX | 5.0 | 3.0 | 2542 | $2,100 | $0.83 | 43d | 1 | 0.52mi |
HOA detail
- Monthly dues
- $33 · $396/yr
Listing history 8 events
-
2026-06-08statusdays on market $275,605 Pending 11 DOM
-
2026-06-07days on market $275,605 New 10 DOM
-
2026-06-04days on market $275,605 New 7 DOM
-
2026-06-03days on market $275,605 New 6 DOM
-
2026-06-02days on market $275,605 New 5 DOM
-
2026-06-01days on market $275,605 New 4 DOM
-
2026-05-31days on market $275,605 New 3 DOM
-
2026-05-28$275,605 New
ⓘ Source: listings_history table (triggers on properties + properties_extension) + one-shot
backfill from property_details.listing_events for pre-trigger history.
Nearby sold comps map
Loading sold comps map…
Walkable amenities ~0.75 mi
Loading nearby amenities…
Taxation est. · year 1
- Rental income
- $25,316
- − Mortgage interest
- −$15,438
- − Property taxes
- −$4,134
- − Insurance
- −$1,378
- − Repairs & maintenance
- −$2,025
- − Management
- −$2,025
- − HOA
- −$396
- − Depreciation
- −$8,018
- Taxable loss
- −$8,098
- Est. tax savings @ 24.0%
- +$1,944
- After-tax cash flow
- $-1,308/yr
For passive investors: Depreciation is non-cash, so a rental often shows a tax loss while cash-flowing — sheltering income. Rental losses are passive: they offset passive income freely, and up to $25,000/yr can offset ordinary (W-2) income if you actively participate and your MAGI is under $100k (phasing out to $0 by $150k); unused losses carry forward. On sale, claimed depreciation is recaptured at up to 25%, and gains may owe capital-gains tax (a 1031 exchange can defer both). Figures are a year-1 estimate at your 24.0% rate — not tax advice; consult a CPA.
Schools (NCES district)
- District
- Southwest ISD
- NCES district ID
- 4840950
- Math proficiency
- 21% ▼ -21.00%
- Reading proficiency
- 31% ▼ -5.00%
- Median HH income
- $43,362
- Composite
- 22.22/100
- National rank
- #8153
- State rank
- #701 of 826 in TX
Livability — San Antonio
- Score
- 80/100
- State rank
- #31
- US rank
- #1616
Category grades
Schools grade is shown separately in the Schools card above.
Census & demographics
- Census place
- San Antonio, TX
- City population
- 1,806,925
- Population (ZIP)
- 9,510
Population outlook (Bexar County) Hauer SSP2
- Today (2025)
- 2,336,851 people
- By 2030
- 2,560,728 · +9.6%
- By 2040
- 3,020,569 · +29.3%
- By 2050
- 3,493,522 · +49.5%
- By 2075
- 4,668,459 · +99.8%
- By 2100
- 5,533,242 · +136.8%
Race, ethnicity, and origin ACS 2023
- Neighborhood character
- Predominantly Hispanic (81%)
- Race & ethnicity
- Hispanic / Latino 81% Two or more races 33% White 16%
- Hispanic origin (detail)
- Mexican 75%
- Foreign-born
- 12% · Canada
- Languages at home
- 51% English-only · Spanish 48% German/W. Germanic 1%
Political lean MEDSL · Bexar
- 2024 margin
- Lean D (+9.8) · D 54.3% · R 44.6% · Other 1.1%
- 2008→2024 swing
- +4.2pp toward D · 2008: 5.6pp · 2024: 9.8pp
- All cycles
- 2024: D+9.8 2020: D+18.2 2016: D+13.5 2012: D+4.6 2008: D+5.6
Not yet ingested
- Civics
- —
Market trends
- HPI YoY
- ▲ 2.60%
- Current HPI
- 289.1266
- Rent YoY
- —
- Metro
- —
- State GDP YoY
- ▲ 3.95%
- F500 in state
- 110
Industry mix (Fortune 500 HQ in TX)
| Industry | F500 HQs | Revenue |
|---|---|---|
| Energy | 16 | $1,198B |
|
||
| Technology | 5 | $198B |
|
||
| Engineering / Construction | 4 | $72B |
|
||
| Energy Services | 3 | $60B |
|
||
| Utilities | 3 | $41B |
|
||
| Healthcare | 2 | $330B |
|
||
Price history
1 event — show timeline
- 2026-05-28 Listed $275,605 LERA
Cash-flow waterfall
monthlySold comps — $/sqft
last 12 mo · ≤1 miLoading sold comps…