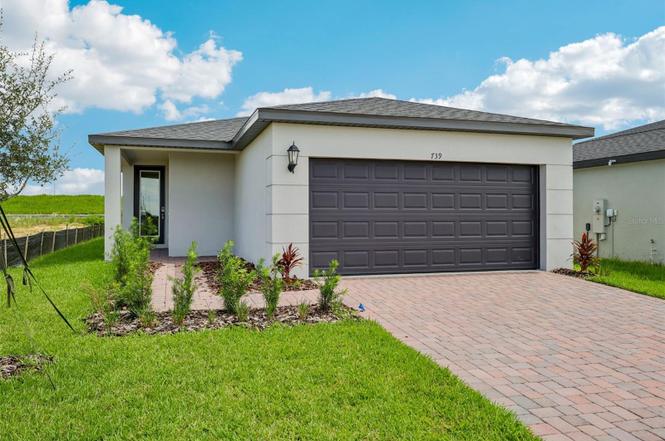
739 Trailhead PT Dr · Lake Hamilton, FL
Flood risk No data
- FEMA flood zone
- —
- Chance of flooding over 30 yrs
- —
- Est. flood insurance / yr
- —
Fire risk No data
- Est. fire insurance / yr
- —
Heat risk No data
- Hot days now (above threshold)
- —
- Hot days in 30 yrs
- —
Wind risk No data
- Chance of severe wind over 30 yrs
- —
Air-quality risk No data
- Unhealthy air days now
- —
- Unhealthy air days in 30 yrs
- —
Risk factors via First Street. Map © Google.
Why this score? — see what drove the D- grade
The composite is a weighted blend of 9 inputs, each scored 0–100. Each bar is that input's sub-score; the figure is the points it added to the 100-point composite (weight × sub-score).
- Cash flow +11.6/30.0
- ARV discount +7.5/15.0
- 1% rule +3.6/10.0
- Schools +3.5/10.0
- DSCR +3.4/10.0
- Livability +3.3/5.0
- Rent growth +2.8/5.0
- Condition / age +2.5/5.0
- Appreciation +0.0/10.0
$262,990
🖨 Deal sheet 📄 Offer letter ✓ Due diligence
Listing remarks
Under contract-accepting backup offers. One or more photo(s) has been virtually staged. Welcome to your dream home in the highly desirable Hamilton Bluffs community, located in Lake Hamilton near Hwy 27—a prime Central Florida location with easy access to Port 27, shopping, dining, and recreation. This brand-new, single-story home offers 4 spacious bedrooms, 2 full bathrooms, and a 2-car garage, all thoughtfully designed for comfort, style, and energy efficiency. Interior Features: • Grey cabinets with crown molding for a modern, upscale touch • Granite countertops in both kitchen and bathrooms • Tile flooring throughout all living areas for durability and easy mai
Key facts
- Panoramic view
- Open green spaces
- Community pool
Tags
Neighborhood map
What this means for you Summary
Snapshot
- This is a 4-bed/2.0-bath land listed at $263k.
Deal economics
- At list price, monthly cash flow is $-82 ($-984/yr) — negative.
- To cash-flow at today's rent, offer at most $251k (4.5% below list).
- To meet the 1% rule (rent ≥ 1% of price), the offer needs to be $226k (14.2% below list).
- Recommended offer: $226k (14.2% below list) — sets the bar for 1% rule.
Location & tenants
- Location reads 66/100 on livability (#591 in FL) — a middle-class / working-renter tenant base. Strengths: cost of living A+, housing A+, health & safety A; Watch: employment D, amenities F, commute F.
- Polk (suburban): math 39% / reading 43% proficiency, ranked #62 of 73 in FL (top 85%) — families likely to look elsewhere, expect single-tenant / working-renter base with shorter leases.
- Zoned schools: Alta Vista Elementary School (math 35% / reading 36%, grade F, #1,684 of 2,144 statewide, top 79%, 769 students, 60% FRL); Winter Haven Senior High School (math 26% / reading 38%, grade F, #415 of 667 statewide, top 63%, 2,467 students, 50% FRL) — zoned schools at 55% FRL track the district average.
- Market conditions: Rents rising (+1.2%/yr); 1333 active listings in the ZIP; 17 comparable units currently listed for rent nearby; rentals at typical pace (median 23d on market — plan ~3-4 weeks tenant-placement turnaround); 10,384 units permitted in Polk County in 2024 (1,716 in 5+ unit buildings).
- This rent runs 43% of the median local income ($64k/yr) — at the standard rent-burdened threshold; future hikes will face affordability resistance.
Forward outlook
- Local home prices are declining (-3.0%/yr); year-one equity from $2k of loan paydown is wiped out by about $8k of value loss. Plan a longer hold.
- Polk County population projected at +33% by 2050 — long-run rental-demand tailwind backs the buy-and-hold thesis.
Negotiation context
- It's been on market 160 days — a 12% lower offer ($231k) is reasonable based on typical stale-listing flexibility.
Questions for the listing agent
- What do current leases actually rent for vs. the listed asking? Can we see a recent rent roll and the last 12 months of T-12 income?
- It's been on market 160 days. Have you received any prior offers? Is the seller open to a 14% concession, seller financing, or rate buy-down credit?
- What does the HOA fee cover, when was the last increase, and are there any pending special assessments or reserve-fund shortfalls?
- Why hasn't it sold? Are there any deal-killer items the seller is aware of (foundation, flood, title, zoning, code violations)?
- Is there a deadline driving the sale (1031 exchange, divorce, estate, relocation)? That informs how much negotiation room exists.
- Schools are F-rated, which usually means shorter tenancies and higher turnover. Who's the typical renter profile here, and what's been the actual vacancy rate?
- The area grade is low — what's the realistic commute time and amenity access for the typical tenant pool here? Any planned neighborhood developments (good or bad) we should know about?
- What's the average days-on-market for RENTAL listings here right now (not sales)? A rising rental-DOM trend means longer vacancies and softer asking-rent achievability than the comps imply.
- What's the recent tenant-quality profile in this submarket — average credit score on applications, eviction rate, late-payment / NSF rate, and stable-employment percentage? A property-management company in the area should have these aggregated.
- How much new for-sale + rental construction is in the pipeline within 1–3 miles? Heavy new supply typically softens prices + rents 12–24 months out; constrained supply supports both.
Investment metrics
- 1% rule
- 0.86% ✗
- Cap rate
- 5.92%
- Cash-on-cash
- -1.34%
- DSCR
- 0.94
- GRM
- 9.7
CMA / ARV
No comps found within radius.
Projected returns pro-forma
-3.0% appreciation · 1.16% rent growth · sell at horizon
- IRR
- -20.6%
- Equity multiple
- 0.30×
- Total profit
- $-51,876
- Equity at exit
- $39,213
- IRR
- -18.7%
- Equity multiple
- 0.08×
- Total profit
- $-67,863
- Equity at exit
- $22,739
Cash invested: $73,637 (down + closing). Projections, not guarantees.
Landlord ↔ Tenant lean methodology
- Overall (STATE)
- 87 Strongly Landlord-Friendly
- State Florida
- 87 Strongly Landlord-Friendly · R+3
- County
- — inherits STATE
- City
- — inherits STATE
ZIP-level market 33844
- Home prices YoY
- -26.7%
- Rents YoY
- 1.2%
- Active inventory
- 1333
- Price-to-rent
- 9.7×
Monthly cashflow live
- Estimated rent
- $2,256 high interval (Pro) →
- Mortgage (P&I)
- −$1,379
- Tax est. 1.5%
- −$329 /mo · $3,945/yr
- Insurance
- −$110
- HOA
- −$47
- Vacancy / Maint / Mgmt
- −$474
- Net cashflow
- $-82
Break-even live
UW: 25.0% down · 7.5% · 30yr · 1.5% tax · 5.0% vac · 8.0% maint · 8.0% mgmt
Financing live
Cash to close
- Down payment
- $65,748
- Closing costs
- $7,890
- Reserves months
- —
- Total cash needed
- —
Loan-product check · same deal, 3 products live
Conventional
25% down · 7.5% · 30yr
- Down + closing
- —
- Monthly P&I
- —
- Monthly cashflow
- —
- DSCR
- —
- Eligible?
- —
Personal DTI + credit; lowest rate.
DSCR
20% down · 8.5% · 30yr
- Down + closing
- —
- Monthly P&I
- —
- Monthly cashflow
- —
- DSCR
- —
- Eligible?
- —
No personal income docs; deal must DSCR.
Hard money
10% down · 12.0% · 12mo
- Down + closing
- —
- Monthly P&I
- —
- Monthly cashflow
- —
- DSCR
- —
- Eligible?
- —
Short-term bridge; refi at stabilization.
Rent comps 17 comps
| Address | Beds | Baths | Sqft | Rent | $/sqft | DOM | Units | Dist |
|---|---|---|---|---|---|---|---|---|
| 2240 Crown Rock Bluff Dr Lake Hamilton, FL | 3.0 | 2.0 | 1486 | $1,999 | $1.35 | 13d | 1 | 0.31mi |
| 2528 Absolute Ave Lake Hamilton, FL | 5.0 | 2.5 | 2112 | $2,800 | $1.33 | 23d | 1 | 0.37mi |
| 2405 Bluestone Rd Lake Hamilton, FL | 3.0 | 2.0 | 1487 | $1,900 | $1.28 | 23d | 1 | 0.37mi |
| 2728 Lookout Ridge Rd Lake Hamilton, FL | 4.0 | 2.5 | 1874 | $1,900 | $1.01 | 23d | 1 | 0.41mi |
| 304 Pearl St Haines City, FL | 4.0 | 2.0 | 1706 | $1,999 | $1.17 | 14d | 1 | 0.42mi |
| 308 Pearl St Haines City, FL | 4.0 | 2.0 | 1706 | $1,999 | $1.17 | 14d | 1 | 0.42mi |
| 1007 N Tangerine St Haines City, FL | 3.0 | 3.0 | 1200 | $1,700 | $1.42 | 23d | 1 | 0.44mi |
| 2756 Lookout Ridge Rd Lake Hamilton, FL | 5.0 | 2.5 | 2112 | $2,350 | $1.11 | 13d | 1 | 0.48mi |
| 2451 Bluestone Rd Lake Hamilton, FL | 4.0 | 3.0 | 2109 | $2,000 | $0.95 | 23d | 1 | 0.51mi |
| 2912 poppy ave, Lake Hamilton, FL | 3.0 | 2.0 | 1401 | $1,925 | $1.37 | 23d | 1 | 0.62mi |
| 2748 Ginger Ln Haines City, FL | 4.0 | 2.5 | 1895 | $2,100 | $1.11 | 14d | 1 | 0.97mi |
| 2744 Ginger Ln Haines City, FL | 4.0 | 2.0 | 1703 | $2,250 | $1.32 | 3d | 1 | 0.97mi |
| 3857 Geranium Ave Haines City, FL | 4.0 | 2.5 | 2073 | $2,050 | $0.99 | 23d | 1 | 0.99mi |
| 4058 Gardenia Ave Haines City, FL | 3.0 | 2.0 | 1615 | $1,995 | $1.24 | 23d | 1 | 1.02mi |
| 4434 Petunia ST Lake Hamilton, FL | 4.0 | 3.0 | 2122 | $2,350 | $1.11 | 10d | 1 | 1.06mi |
| 1712 Vanilla St Haines City, FL | 3.0 | 2.0 | 1630 | $2,000 | $1.23 | 23d | 1 | 1.31mi |
| 1728 Vanilla St Haines City, FL | 4.0 | 2.0 | 1850 | $2,400 | $1.30 | 23d | 1 | 1.34mi |
HOA detail
- Monthly dues
- $47 · $564/yr
Listing history 5 events
-
2026-04-12status Pending
-
2026-04-04price $262,990
-
2026-02-19price $275,730
-
2026-01-12price $288,000
-
2025-11-03$299,313 Active
ⓘ Source: listings_history table (triggers on properties + properties_extension) + one-shot
backfill from property_details.listing_events for pre-trigger history.
Nearby sold comps map
Loading sold comps map…
Walkable amenities ~0.75 mi
Loading nearby amenities…
Taxation est. · year 1
- Rental income
- $27,076
- − Mortgage interest
- −$14,732
- − Property taxes
- −$3,945
- − Insurance
- −$1,315
- − Repairs & maintenance
- −$2,166
- − Management
- −$2,166
- − HOA
- −$564
- − Depreciation
- −$7,651
- Taxable loss
- −$5,462
- Est. tax savings @ 24.0%
- +$1,311
- After-tax cash flow
- $327/yr
For passive investors: Depreciation is non-cash, so a rental often shows a tax loss while cash-flowing — sheltering income. Rental losses are passive: they offset passive income freely, and up to $25,000/yr can offset ordinary (W-2) income if you actively participate and your MAGI is under $100k (phasing out to $0 by $150k); unused losses carry forward. On sale, claimed depreciation is recaptured at up to 25%, and gains may owe capital-gains tax (a 1031 exchange can defer both). Figures are a year-1 estimate at your 24.0% rate — not tax advice; consult a CPA.
Schools (NCES district)
- District
- Polk
- NCES district ID
- 1201590
- Math proficiency
- 39% ▼ -11.00%
- Reading proficiency
- 43% ▼ -4.00%
- Median HH income
- $43,979
- Composite
- 34.74/100
- National rank
- #5132
- State rank
- #62 of 73 in FL
Livability — Lake Hamilton
- Score
- 66/100
- State rank
- #591
- US rank
- #11293
Category grades
Schools grade is shown separately in the Schools card above.
Census & demographics
- Census place
- Lake Hamilton, FL
- County
- Polk County · 740,051 people
- City population
- 51,255
- Metro
- Lakeland-Winter Haven, FL
- Population (ZIP)
- 51,255
- Household income
- $63,650
- Rent vs Own
- Severe rent burden
- 1107.0
Population outlook (Polk County) Hauer SSP2
- Today (2025)
- 752,975 people
- By 2030
- 804,621 · +6.9%
- By 2040
- 906,117 · +20.3%
- By 2050
- 1,000,476 · +32.9%
- By 2075
- 1,197,520 · +59.0%
- By 2100
- 1,271,518 · +68.9%
Race, ethnicity, and origin ACS 2023
- Neighborhood character
- Diverse neighborhood (Simpson 0.64)
- Race & ethnicity
- Hispanic / Latino 48% White 31% Black 18% Two or more races 12% Asian 1%
- Hispanic origin (detail)
- Mexican 19% Puerto Rican 19% Cuban 1% Dominican 3%
- Common ancestry
- Hispanic 4% Lithuanian 1% Romanian 1%
- Foreign-born
- 15% · Canada, Jamaica, Guatemala
- Languages at home
- 55% English-only · Spanish 39% French/Haitian/Cajun 4% Other Indo-European 0%
Political lean MEDSL · Polk
- 2024 margin
- Strong R (+20.7) · D 39.2% · R 59.9%
- 2008→2024 swing
- -14.6pp toward R · 2008: -6.1pp · 2024: -20.7pp
- All cycles
- 2024: R+20.7 2020: R+14.4 2016: R+14.1 2012: R+6.8 2008: R+6.1
Not yet ingested
- Civics
- —
Market trends
- HPI YoY
- ▼ -105.94%
- Current HPI
- 291.0798
- Rent YoY
- ▲ 1.16%
- Metro
- Lakeland-Winter Haven, FL
- State GDP YoY
- ▲ 3.28%
- F500 in state
- 36
Industry mix (Fortune 500 HQ in FL)
| Industry | F500 HQs | Revenue |
|---|---|---|
| Industrial Technology | 2 | $29B |
|
||
| Insurance | 2 | $17B |
|
||
| Retail | 1 | $60B |
|
||
| Technology Distribution | 1 | $58B |
|
||
| Homebuilding | 1 | $35B |
|
||
| Technology Manufacturing | 1 | $35B |
|
||
Price history
-12.1% since first listed5 events — show timeline
- 2026-04-12 Pending — Stellar MLS as Distributed by MLS Grid
- 2026-04-04 Price Changed $262,990 Stellar MLS as Distributed by MLS Grid
- 2026-02-19 Price Changed $275,730 Stellar MLS as Distributed by MLS Grid
- 2026-01-12 Price Changed $288,000 Stellar MLS as Distributed by MLS Grid
- 2025-11-03 Listed $299,313 Stellar MLS as Distributed by MLS Grid
Cash-flow waterfall
monthlySold comps — $/sqft
last 12 mo · ≤1 miLoading sold comps…