8941 Malibu St #1 · Lely Resort, FL
Flood risk 7/10 · Major
- FEMA flood zone
- AE
- Chance of flooding over 30 yrs
- 0.76%
- Est. flood insurance / yr
- $1,737 – $8,500
Fire risk 4/10 · Minor
- Est. fire insurance / yr
- $947 – $1,759
Heat risk 10/10 · Severe
- Hot days now (above 108°F)
- 7 days/yr
- Hot days in 30 yrs
- 30 days/yr
Wind risk 10/10 · Severe
- Chance of severe wind over 30 yrs
- 99.0%
Air-quality risk 2/10 · Minimal
- Unhealthy air days now
- 2 days/yr
- Unhealthy air days in 30 yrs
- 2 days/yr
Risk factors via First Street. Map © Google.
Why this score? — see what drove the B grade
The composite is a weighted blend of 9 inputs, each scored 0–100. Each bar is that input's sub-score; the figure is the points it added to the 100-point composite (weight × sub-score).
- Cash flow +30.0/30.0
- 1% rule +10.0/10.0
- DSCR +10.0/10.0
- ARV discount +7.5/15.0
- Schools +5.0/10.0
- Rent growth +3.9/5.0
- Livability +3.1/5.0
- Condition / age +2.5/5.0
- Appreciation +0.0/10.0
$285,000
🖨 Deal sheet 📄 Offer letter ✓ Due diligence
Listing remarks
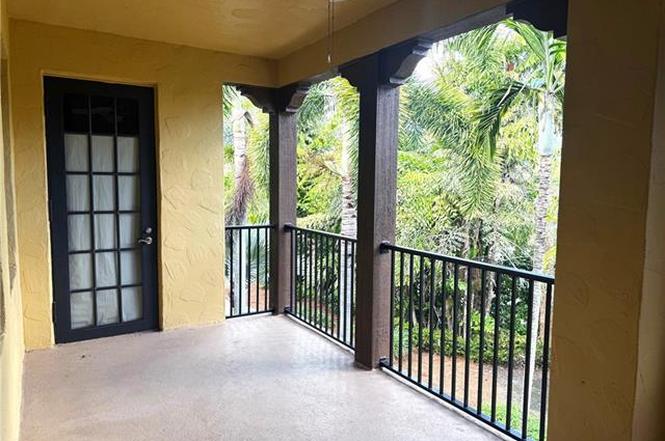
WOW, CHECK OUT THIS PRICE! This bright and airy 3-bedroom, 2-bath condo located in Ole' at the highly sought-after Lely Resort community, has been reduced to an unbelievable price. Offering a private entry and an attached 2-car garage, this residence combines comfort, privacy, and resort-style living. Inside, you’ll find a spacious, sun-filled layout with a dedicated laundry room and a well-designed floor plan. The primary suite features a generous walk-in closet and access to a private balcony, perfect for enjoying morning coffee or unwinding in the evening. Residents of Ole' enjoy an impressive array of amenities, including a resort-style pool, on-site restaurant, fitness center, mo
Key facts
- Secure entry
- Attached garage
- Community pool
Tags
Property features AI
Finance
- Other: Part of a complex with 623 units (5 units in building); 1 unit per floor; building has 2 floors
- HOA & community: Quarterly condo fee ($3,710); Total annual recurring fees $14,840; One-time fees $100; Professional management; Maintenance covers irrigation water, lawn/land maintenance, exterior pest control, recreation facilities, sewer, trash removal, and water; Community amenities include clubhouse, community pool, exercise room, community room, golf course, restaurant, theater, community park, basketball, bike and jog path, sidewalk, and streetlight; Community type: Condo/Hotel
Exterior
- Parking: Attached 2-car garage; Paved driveway
- Security: Patrolled community
- Utilities: Water assessment paid; Sewer assessment paid; Cable available
- Home design: Residential property; Low-rise (1-3) building; 2-story building; Built in 2009; Rear exposure faces northwest; Located in Lely Resort (OLE development)
- Construction: Concrete block construction
- Exterior features: Tile roof; Single-hung windows; Stucco exterior finish; Patrolled security; Landscaped area view; Paved road access; Zero lot line; Deeded restrictions with no commercial use
Interior
- Kitchen: Pantry; Dishwasher; Disposal; Microwave; Range; Refrigerator
- Bedrooms: 3 bedrooms (split bedroom floor plan)
- Flooring: Carpet; Tile
- Bathrooms: 2 full bathrooms; Master bathroom with dual sinks and separate tub and shower
- Heating & cooling: Central electric heat; Central electric air conditioning
- Interior features: Fire sprinkler; Foyer; Smoke detectors; Tray ceiling; Walk-in closet; Pantry; Great room; Open porch/lanai; Unfurnished
- Laundry & utility: Laundry in residence; Washer; Dryer; Auto garage door
Neighborhood map
What this means for you Summary
Snapshot
- This is a 3-bed/2.0-bath condo listed at $285k.
Deal economics
- At list price, monthly cash flow is $1k ($15k/yr) — positive.
- The deal already cash-flows at list — no discount required.
- Meets the 1% rule at list price ($6k rent vs $285k).
- Recommended offer: $251k (12.0% below list) — sets the bar for market timing.
Location & tenants
- Location reads 61/100 on livability (#786 in FL) — a middle-class / working-renter tenant base. Strengths: crime A+, employment A-; Watch: health & safety D, schools F, amenities F.
- Collier (suburban): math 60% / reading 56% proficiency, ranked #16 of 73 in FL (top 22%) — acceptable for families but not a draw, mixed tenant base, ~2y average lease.
- Market conditions: Rents rising fast (+5.6%/yr); 597 active listings in the ZIP; 40 comparable units currently listed for rent nearby; rentals at typical pace (median 24d on market — plan ~3-4 weeks tenant-placement turnaround); solid renter incomes; 3,520 units permitted in Collier County in 2024 (959 in 5+ unit buildings).
- At $6,211/mo this rent would consume 91% of the median local household income ($82k/yr) (locally 954% of renters already pay >50% of income on rent) — very limited rent-growth headroom before tenants either downsize or default.
Forward outlook
- Local home prices are declining (-3.0%/yr); year-one equity from $2k of loan paydown is wiped out by about $9k of value loss. Plan a longer hold.
- Collier County population projected at +30% by 2050 — long-run rental-demand tailwind backs the buy-and-hold thesis.
- At projected returns (-3.0% appreciation + 5.6% rent growth), your $80k cash investment doubles in ~6 years — after that, you're playing with house money.
Negotiation context
- It's been on market 196 days — a 12% lower offer ($251k) is reasonable based on typical stale-listing flexibility.
Risks & watch-outs
- Watch-outs: flood insurance adds $427/mo.
- Climate carrying-cost: in FEMA flood zone AE (mandatory federal flood insurance); severe wind risk, 99% chance of damaging wind over 30y; extreme-heat days projected 7→30/yr by 2055 (HVAC capex compounding) — expect insurance premiums to compound above CPI over the hold.
Questions for the listing agent
- It's been on market 196 days. Have you received any prior offers? Is the seller open to a 12% concession, seller financing, or rate buy-down credit?
- What's the actual annual flood-insurance premium (NFIP or private), and is the property in a SFHA with mandatory coverage?
- What does the HOA fee cover, when was the last increase, and are there any pending special assessments or reserve-fund shortfalls?
- Any open or pending special assessments — roof, HVAC, plumbing, elevator, façade? What's the per-unit balance and payoff schedule, and is the seller paying it off at close or rolling it to the buyer?
- Why hasn't it sold? Are there any deal-killer items the seller is aware of (foundation, flood, title, zoning, code violations)?
- Is there a deadline driving the sale (1031 exchange, divorce, estate, relocation)? That informs how much negotiation room exists.
- Schools are F-rated, which usually means shorter tenancies and higher turnover. Who's the typical renter profile here, and what's been the actual vacancy rate?
- What's the average days-on-market for RENTAL listings here right now (not sales)? A rising rental-DOM trend means longer vacancies and softer asking-rent achievability than the comps imply.
- What's the recent tenant-quality profile in this submarket — average credit score on applications, eviction rate, late-payment / NSF rate, and stable-employment percentage? A property-management company in the area should have these aggregated.
- How much new apartment / multifamily construction is in the pipeline within 1–3 miles? Heavy new supply (>2% of stock underway) typically softens rents 12–24 months out; light construction supports rent growth.
Investment metrics
- 1% rule
- 2.18% ✓
- Cap rate
- 13.45%
- Cash-on-cash
- 25.56%
- DSCR
- 2.14
- GRM
- 3.8
CMA / ARV
No comps found within radius.
Projected returns pro-forma
-3.0% appreciation · 5.59% rent growth · sell at horizon
- IRR
- 15.6%
- Equity multiple
- 1.66×
- Total profit
- $52,647
- Equity at exit
- $42,494
- IRR
- 27.0%
- Equity multiple
- 3.84×
- Total profit
- $226,669
- Equity at exit
- $24,642
Cash invested: $79,800 (down + closing). Projections, not guarantees.
Landlord ↔ Tenant lean methodology
- Overall (STATE)
- 87 Strongly Landlord-Friendly
- State Florida
- 87 Strongly Landlord-Friendly · R+3
- County
- — inherits STATE
- City
- — inherits STATE
ZIP-level market 34113
- Rents YoY
- 5.6%
- Active inventory
- 597
- Price-to-rent
- 3.8×
Monthly cashflow live
- Estimated rent
- $6,211 high interval (Pro) →
- Mortgage (P&I)
- −$1,495
- Tax est. 1.5%
- −$356 /mo · $4,275/yr
- Insurance
- −$119
- Flood insurance flood zone
- −$427 /mo · $5,118/yr
- HOA
- −$1,237
- Vacancy / Maint / Mgmt
- −$1,304
- Net cashflow
- $1,273
Break-even live
UW: 25.0% down · 7.5% · 30yr · 1.5% tax · 5.0% vac · 8.0% maint · 8.0% mgmt
Financing live
Cash to close
- Down payment
- $71,250
- Closing costs
- $8,550
- Reserves months
- —
- Total cash needed
- —
Loan-product check · same deal, 3 products live
Conventional
25% down · 7.5% · 30yr
- Down + closing
- —
- Monthly P&I
- —
- Monthly cashflow
- —
- DSCR
- —
- Eligible?
- —
Personal DTI + credit; lowest rate.
DSCR
20% down · 8.5% · 30yr
- Down + closing
- —
- Monthly P&I
- —
- Monthly cashflow
- —
- DSCR
- —
- Eligible?
- —
No personal income docs; deal must DSCR.
Hard money
10% down · 12.0% · 12mo
- Down + closing
- —
- Monthly P&I
- —
- Monthly cashflow
- —
- DSCR
- —
- Eligible?
- —
Short-term bridge; refi at stabilization.
Rent comps 40 comps
| Address | Beds | Baths | Sqft | Rent | $/sqft | DOM | Units | Dist |
|---|---|---|---|---|---|---|---|---|
| 8949 Malibu St #304 Naples, FL | 3.0 | 2.0 | 1771 | $6,500 | $3.67 | 23d | 1 | 0.03mi |
| 8055 Tiger Cv Unit 6-606 Naples, FL | 2.0 | 2.0 | 1439 | $1,800 | $1.25 | 23d | 1 | 0.08mi |
| 8085 Celeste Dr #812 Naples, FL | 2.0 | 2.0 | 1480 | $6,000 | $4.05 | 14d | 1 | 0.09mi |
| 8073 Panther Trl #1404 Naples, FL | 2.0 | 2.0 | 1450 | $5,500 | $3.79 | 23d | 1 | 0.11mi |
| 8992 Cambria Cir Unit 1546062P Naples, FL | 3.0 | 2.0 | 2002 | $3,097 | $1.55 | 14d | 1 | 0.15mi |
| 8125 Celeste Dr #5113 Naples, FL | 3.0 | 2.0 | 1635 | $7,000 | $4.28 | 23d | 1 | 0.18mi |
| 8125 Celeste Dr #5216 Naples, FL | 3.0 | 2.0 | 1640 | $4,500 | $2.74 | 23d | 1 | 0.18mi |
| 8989 Cambria Cir #1807 Naples, FL | 3.0 | 2.5 | 2008 | $7,000 | $3.49 | 14d | 1 | 0.18mi |
| 8693 Querce Ct Naples, FL | 2.0 | 2.0 | 1415 | $5,000 | $3.53 | 23d | 1 | 0.21mi |
| 8986 Cambria Cir Unit 22 Naples, FL | 2.0 | 2.0 | 1404 | $6,000 | $4.27 | 23d | 1 | 0.24mi |
| 8986 Cambria Cir #2204 Naples, FL | 3.0 | 2.0 | 1771 | $7,500 | $4.23 | 23d | 1 | 0.24mi |
| 8135 Celeste Dr #4218 Naples, FL | 2.0 | 2.0 | 1476 | $7,500 | $5.08 | 23d | 1 | 0.29mi |
| 8177 Saratoga Dr #1001 Naples, FL | 2.0 | 2.0 | 1880 | $8,000 | $4.26 | 23d | 1 | 0.29mi |
| 8177 Saratoga Dr #1002 Naples, FL | 2.0 | 2.0 | 1880 | $9,000 | $4.79 | 23d | 1 | 0.29mi |
| 9025 Alturas St #3102 Naples, FL | 2.0 | 3.0 | 1531 | $3,400 | $2.22 | 23d | 1 | 0.30mi |
| 8175 Celeste Dr #1230 Naples, FL | 2.0 | 2.0 | 1476 | $2,775 | $1.88 | 23d | 1 | 0.31mi |
| 8175 Celeste Dr #1229 Naples, FL | 3.0 | 2.0 | 1640 | $2,975 | $1.81 | 23d | 1 | 0.31mi |
| 8175 Celeste Dr Naples, FL | 2.0 | 2.0 | 1460 | $2,395 | $1.64 | 23d | 1 | 0.31mi |
| 8200 Saratoga Dr #401 Naples, FL | 2.0 | 2.0 | 1880 | $8,500 | $4.52 | 23d | 1 | 0.35mi |
| 7278 Salerno Ct Unit 1049689P Naples, FL | 3.0 | 2.0 | 1539 | $6,683 | $4.34 | 14d | 1 | 0.38mi |
| 7294 Salerno Ct Naples, FL | 3.0 | 2.0 | 1542 | $4,250 | $2.76 | 23d | 1 | 0.38mi |
| 7310 Salerno Ct Naples, FL | 3.0 | 2.0 | 1540 | $5,000 | $3.25 | 23d | 1 | 0.39mi |
| 9054 Capistrano St N #4002 Naples, FL | 3.0 | 2.0 | 1674 | $6,000 | $3.58 | 23d | 1 | 0.40mi |
| 9054 Capistrano St N #4003 Naples, FL | 2.0 | 2.0 | 1385 | $2,495 | $1.80 | 23d | 1 | 0.40mi |
| 8519 Chase Preserve Dr Naples, FL | 2.0 | 2.0 | 1827 | $9,000 | $4.93 | 23d | 1 | 0.40mi |
| 8138 Saratoga Dr #2201 Naples, FL | 2.0 | 2.0 | 1880 | $8,000 | $4.26 | 23d | 1 | 0.44mi |
| 8664 Genova Ct Naples, FL | 3.0 | 2.0 | 1554 | $3,200 | $2.06 | 23d | 1 | 0.44mi |
| 8419 Benelli Ct Naples, FL | 3.0 | 2.0 | 1900 | $3,300 | $1.74 | 23d | 1 | 0.45mi |
| 8081 Players Cove Dr #101 Naples, FL | 2.0 | 2.5 | 2091 | $9,500 | $4.54 | 23d | 1 | 0.46mi |
| 8416 Benelli Ct Naples, FL | 2.0 | 2.0 | 2046 | $6,000 | $2.93 | 21d | 1 | 0.47mi |
| 8060 Players Cove Dr #101 Naples, FL | 2.0 | 2.5 | 2091 | $4,800 | $2.30 | 23d | 1 | 0.48mi |
| 8965 Malibu Ln #802 Naples, FL | 3.0 | 2.0 | 1771 | $6,595 | $3.72 | 23d | 1 | 0.48mi |
| 9082 Capistrano St N Unit 48-5 Naples, FL | 2.0 | 2.0 | 1227 | $6,500 | $5.30 | 23d | 1 | 0.48mi |
| 9066 Albion Ln N Unit 51-1 Naples, FL | 3.0 | 2.5 | 1989 | $7,000 | $3.52 | 23d | 1 | 0.51mi |
| 9066 Albion Ln N #5106 Naples, FL | 3.0 | 2.5 | 1715 | $6,500 | $3.79 | 21d | 1 | 0.51mi |
| 7114 Marconi Ct Naples, FL | 2.0 | 2.0 | 1554 | $2,800 | $1.80 | 23d | 1 | 0.51mi |
| 9071 Albion Ln N #5706 Naples, FL | 2.0 | 2.5 | 1441 | $2,200 | $1.53 | 23d | 1 | 0.52mi |
| 9073 Rialto St #6002 Naples, FL | 3.0 | 2.0 | 1771 | $7,500 | $4.23 | 23d | 1 | 0.53mi |
| 8051 Players Cove Dr #102 Naples, FL | 3.0 | 2.5 | 2091 | $8,000 | $3.83 | 23d | 1 | 0.56mi |
| 9076 Rialto St Unit 62 Naples, FL | 3.0 | 2.5 | 1624 | $7,500 | $4.62 | 23d | 1 | 0.57mi |
HOA detail condo
- Monthly dues
- $1,237 · $14,844/yr
- Likely covers
- poolgym
- Assessments
- None detected in remarks — confirm with the listing agent.
Listing history 22 events
-
2026-06-18status $285,000 Pending 196 DOM
-
2026-06-15statusdays on market $285,000 Pending With Contingencies 196 DOM
-
2026-06-10days on market $285,000 Active 194 DOM
-
2026-06-09days on market $285,000 Active 193 DOM
-
2026-06-08days on market $285,000 Active 192 DOM
-
2026-06-07days on market $285,000 Active 191 DOM
-
2026-06-03days on market $285,000 Active 187 DOM
-
2026-06-02days on market $285,000 Active 186 DOM
-
2026-06-01days on market $285,000 Active 185 DOM
-
2026-05-31days on market $285,000 Active 184 DOM
-
2026-05-30days on market $285,000 Active 183 DOM
-
2026-05-23price $285,000
-
2026-05-08price $299,900
-
2026-04-14price $315,000
-
2026-04-08price $330,000
-
2026-04-04price $355,000
-
2026-03-22price $365,000
-
2026-03-04price $375,000
-
2026-02-06price $380,000
-
2026-01-29price $389,900
-
2026-01-04price $394,900
-
2025-11-28$399,900 Active
ⓘ Source: listings_history table (triggers on properties + properties_extension) + one-shot
backfill from property_details.listing_events for pre-trigger history.
Climate risk First Street
- Flood 7/10 Severe FEMA zone AE · 76% chance over 30 yrs
- Wildfire 4/10 Moderate
- Heat 10/10 Extreme 7 d/yr ≥108°F today · 30 d/yr by 30 yrs out
- Wind 10/10 Extreme 99% chance of damaging wind over 30 yrs
- Air quality 2/10 Low 2 unhealthy d/yr today · 2 by 30 yrs out
Nearby sold comps map
Loading sold comps map…
Walkable amenities ~0.75 mi
Loading nearby amenities…
Taxation est. · year 1
- Rental income
- $74,531
- − Mortgage interest
- −$15,964
- − Property taxes
- −$4,275
- − Insurance
- −$6,544
- − Repairs & maintenance
- −$5,962
- − Management
- −$5,962
- − HOA
- −$14,844
- − Depreciation
- −$8,291
- Taxable income
- $12,688
- Est. tax owed @ 24.0%
- −$3,045
- After-tax cash flow
- $12,237/yr
For passive investors: Depreciation is non-cash, so a rental often shows a tax loss while cash-flowing — sheltering income. Rental losses are passive: they offset passive income freely, and up to $25,000/yr can offset ordinary (W-2) income if you actively participate and your MAGI is under $100k (phasing out to $0 by $150k); unused losses carry forward. On sale, claimed depreciation is recaptured at up to 25%, and gains may owe capital-gains tax (a 1031 exchange can defer both). Figures are a year-1 estimate at your 24.0% rate — not tax advice; consult a CPA.
Schools (NCES district)
- District
- Collier
- NCES district ID
- 1200330
- Math proficiency
- 60% ▼ -4.00%
- Reading proficiency
- 56% ▼ -2.00%
- Median HH income
- $58,275
- Composite
- 50.23/100
- National rank
- #1892
- State rank
- #16 of 73 in FL
Livability — Lely Resort
- Score
- 61/100
- State rank
- #786
- US rank
- #17981
Category grades
Schools grade is shown separately in the Schools card above.
Census & demographics
- Census place
- Lely Resort, FL
- County
- Collier County · 396,295 people
- Metro
- Naples-Marco Island, FL
- Population (ZIP)
- 26,056
- Household income
- $81,674
- Rent vs Own
- Severe rent burden
- 954.0
Population outlook (Collier County) Hauer SSP2
- Today (2025)
- 420,858 people
- By 2030
- 450,054 · +6.9%
- By 2040
- 502,232 · +19.3%
- By 2050
- 544,932 · +29.5%
- By 2075
- 627,203 · +49.0%
- By 2100
- 659,015 · +56.6%
Race, ethnicity, and origin ACS 2023
- Neighborhood character
- Diverse neighborhood (Simpson 0.59)
- Race & ethnicity
- White 56% Hispanic / Latino 28% Black 12% Two or more races 11% Asian 2%
- Hispanic origin (detail)
- Mexican 17% Puerto Rican 3% Cuban 2%
- Common ancestry
- Hispanic 10% Romanian 3% Lithuanian 2%
- Foreign-born
- 26% · Canada, Jamaica, Vietnam
- Languages at home
- 63% English-only · Spanish 24% French/Haitian/Cajun 9% Other Indo-European 2%
Political lean MEDSL · Collier
- 2024 margin
- Solid R (+33.1) · D 33.1% · R 66.2%
- 2008→2024 swing
- -10.6pp toward R · 2008: -22.5pp · 2024: -33.1pp
- All cycles
- 2024: R+33.1 2020: R+24.7 2016: R+26.0 2012: R+30.1 2008: R+22.5
Not yet ingested
- Civics
- —
Market trends
- HPI YoY
- ▼ -194.86%
- Current HPI
- 279.4232
- Rent YoY
- ▲ 5.59%
- Metro
- Naples-Marco Island, FL
- State GDP YoY
- ▲ 3.28%
- F500 in state
- 36
Industry mix (Fortune 500 HQ in FL)
| Industry | F500 HQs | Revenue |
|---|---|---|
| Industrial Technology | 2 | $29B |
|
||
| Insurance | 2 | $17B |
|
||
| Retail | 1 | $60B |
|
||
| Technology Distribution | 1 | $58B |
|
||
| Homebuilding | 1 | $35B |
|
||
| Technology Manufacturing | 1 | $35B |
|
||
Price history
-28.7% since first listed11 events — show timeline
- 2026-05-23 Price Changed $285,000 NAPLESMLS
- 2026-05-08 Price Changed $299,900 NAPLESMLS
- 2026-04-14 Price Changed $315,000 NAPLESMLS
- 2026-04-08 Price Changed $330,000 NAPLESMLS
- 2026-04-04 Price Changed $355,000 NAPLESMLS
- 2026-03-22 Price Changed $365,000 NAPLESMLS
- 2026-03-04 Price Changed $375,000 NAPLESMLS
- 2026-02-06 Price Changed $380,000 NAPLESMLS
- 2026-01-29 Price Changed $389,900 NAPLESMLS
- 2026-01-04 Price Changed $394,900 NAPLESMLS
- 2025-11-28 Listed $399,900 NAPLESMLS
Cash-flow waterfall
monthlySold comps — $/sqft
last 12 mo · ≤1 miLoading sold comps…