 Multi-family
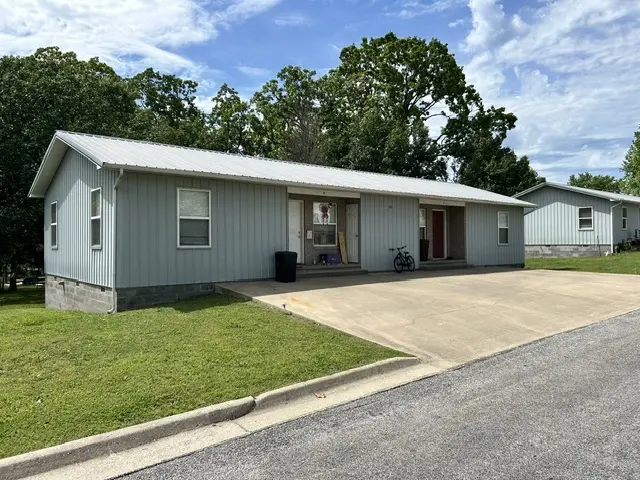
100 Clive St · Berryville, AR
Flood risk No data
- FEMA flood zone
- —
- Chance of flooding over 30 yrs
- —
- Est. flood insurance / yr
- —
Fire risk No data
- Est. fire insurance / yr
- —
Heat risk No data
- Hot days now (above threshold)
- —
- Hot days in 30 yrs
- —
Wind risk No data
- Chance of severe wind over 30 yrs
- —
Air-quality risk No data
- Unhealthy air days now
- —
- Unhealthy air days in 30 yrs
- —
Risk factors via First Street. Map © Google.
Why this score? — see what drove the C grade
The composite is a weighted blend of 9 inputs, each scored 0–100. Each bar is that input's sub-score; the figure is the points it added to the 100-point composite (weight × sub-score).
- Cash flow +19.2/30.0
- Appreciation +10.0/10.0
- ARV discount +7.5/15.0
- DSCR +6.1/10.0
- 1% rule +5.1/10.0
- Livability +3.4/5.0
- Schools +2.6/10.0
- Rent growth +2.5/5.0
- Condition / age +2.5/5.0
$189,900
🖨 Deal sheet 📄 Offer letter ✓ Due diligence
Multi-family units
County records classify this as Multi-Family (2-4 Unit). Listing-text estimate: 1 unit. estimate disagrees with records
Listing remarks MLS
Investor Alert! You will want to check out this 18 unit package of rentals in Berryville and Green Forest. Well maintained buildings, long term tenants, space available for additional units all make this a great opportunity to expand your business. Ten units in Berryville and 8 in Green Forest. Includes 100, 102 Clive duplexes, 104 Clive & 1205 Laura, single family homes, 901 Jefferson fourplex, Berryville and 209, 211 Sneed, 4 duplexes, Green Forest. Total sq footage of 14,766. All units 2 bed, 1 bath 5 units have attached garages. Proof of funds or pre-qualification letter required for showing. Owner provides lawn service for all locations, and trash for Green Forest. Call today to obtain additional information and schedule a showing.
Key facts
- Turnkey asset
- Fully remodeled
- Metal roof
Tags
Property features AI
Finance
- Other: Annual tax amount listed (amount not included per instructions)
- HOA & community: Association fees billed monthly
Exterior
- Parking: Concrete driveway (on-site parking)
- Utilities: Electricity available; Public water; Public sewer
- Home design: Single-story; Slab foundation
- Construction: Aluminum siding; Block and concrete construction; Metal roof; Built on a slab foundation
- Exterior features: Concrete driveway; City lot in a subdivision; Public road frontage
Interior
- Kitchen: Electric range; Microwave with hood fan; Refrigerator
- Flooring: Carpet; Tile
- Bathrooms: 2 full bathrooms
- Heating & cooling: Central heating; Central air conditioning
- Interior features: Carpet and tile flooring; No additional interior features listed
Neighborhood map
What this means for you Summary
Snapshot
- This is a 4-bed/2.0-bath multifamily listed at $190k.
Deal economics
- At list price, monthly cash flow is $204 ($2k/yr) — positive.
- The deal already cash-flows at list — no discount required.
- Meets the 1% rule at list price ($2k rent vs $190k).
- Cap rate 7.6% vs local median 3.2% in Berryville — top-decile yield for the area; either an underpriced asset or a hidden risk that comps aren't pricing in. Stress-test before assuming the spread holds.
Location & tenants
- Location reads 67/100 on livability (#103 in AR) — a middle-class / working-renter tenant base. Strengths: cost of living A+, health & safety A+, housing A; Watch: crime C-, schools D+, amenities F.
- Berryville School District (town): math 31% / reading 31% proficiency, ranked #148 of 238 in AR (top 62%) — families likely to look elsewhere, expect single-tenant / working-renter base with shorter leases.
- Market conditions: 117 active listings in the ZIP; 30 units permitted in Carroll County in 2024 (0 in 5+ unit buildings).
Forward outlook
- In year one you build about $20k of equity ($1k loan paydown + $19k appreciation (10.0% local appreciation)).
- Carroll County population projected at +4% by 2050 — modest demand growth; plan on rents tracking national, not racing it.
- At projected returns (10.0% appreciation + 3.0% rent growth), your $53k cash investment doubles in ~3 years — after that, you're playing with house money.
- By year 2, paydown + projected appreciation supports a ~$33k cash-out refi (75% LTV) — recoverable capital for the next deal without selling this one.
Negotiation context
- Only 8 days on market — expect competitive offers; lowballing is unlikely to land.
- 3 sale attempts since 3y ago with the ask held roughly flat each time — persistent listings suggest the price (not the market) is what's stuck; bring a comps-based counter.
Questions for the listing agent
- Is there a deadline driving the sale (1031 exchange, divorce, estate, relocation)? That informs how much negotiation room exists.
- Schools are D-rated, which usually means shorter tenancies and higher turnover. Who's the typical renter profile here, and what's been the actual vacancy rate?
- What's the average days-on-market for RENTAL listings here right now (not sales)? A rising rental-DOM trend means longer vacancies and softer asking-rent achievability than the comps imply.
- What's the recent tenant-quality profile in this submarket — average credit score on applications, eviction rate, late-payment / NSF rate, and stable-employment percentage? A property-management company in the area should have these aggregated.
- How much new apartment / multifamily construction is in the pipeline within 1–3 miles? Heavy new supply (>2% of stock underway) typically softens rents 12–24 months out; light construction supports rent growth.
Investment metrics
- 1% rule
- 1.01% ✓
- Cap rate
- 7.58%
- Cash-on-cash
- 4.61%
- DSCR
- 1.21
- GRM
- 8.2
CMA / ARV
No comps found within radius.
Projected returns pro-forma
10.0% appreciation · 3.0% rent growth · sell at horizon
- IRR
- 27.6%
- Equity multiple
- 3.19×
- Total profit
- $116,475
- Equity at exit
- $171,077
- IRR
- 24.1%
- Equity multiple
- 7.26×
- Total profit
- $332,817
- Equity at exit
- $368,934
Cash invested: $53,172 (down + closing). Projections, not guarantees.
Landlord ↔ Tenant lean methodology
- Overall (STATE)
- 92 Strongly Landlord-Friendly
- State Arkansas
- 92 Strongly Landlord-Friendly · R+14
- County
- — inherits STATE
- City
- — inherits STATE
ZIP-level market 72616
- Home prices YoY
- 15.2%
- Active inventory
- 117
- Price-to-rent
- 16.5×
Monthly cashflow live
- Estimated rent
- $1,920 medium interval (Pro) →
- Mortgage (P&I)
- −$996
- Tax est. 1.5%
- −$237 /mo · $2,848/yr
- Insurance
- −$79
- HOA
- −$0
- Vacancy / Maint / Mgmt
- −$403
- Net cashflow
- $204
Break-even live
2-unit breakdown (identical units grouped — click to expand)
| Units | Beds | Baths | Est. rent |
|---|---|---|---|
| 2× units | 2 | 1 | $1,920 |
| #1 | 2 | 1 | $960 |
| #2 | 2 | 1 | $960 |
| Total (2 units) | $1,920 | ||
UW: 25.0% down · 7.5% · 30yr · 1.5% tax · 5.0% vac · 8.0% maint · 8.0% mgmt
Financing live
Cash to close
- Down payment
- $47,475
- Closing costs
- $5,697
- Reserves months
- —
- Total cash needed
- —
Loan-product check · same deal, 3 products live
Conventional
25% down · 7.5% · 30yr
- Down + closing
- —
- Monthly P&I
- —
- Monthly cashflow
- —
- DSCR
- —
- Eligible?
- —
Personal DTI + credit; lowest rate.
DSCR
20% down · 8.5% · 30yr
- Down + closing
- —
- Monthly P&I
- —
- Monthly cashflow
- —
- DSCR
- —
- Eligible?
- —
No personal income docs; deal must DSCR.
Hard money
10% down · 12.0% · 12mo
- Down + closing
- —
- Monthly P&I
- —
- Monthly cashflow
- —
- DSCR
- —
- Eligible?
- —
Short-term bridge; refi at stabilization.
Listing history 8 events
-
2026-06-19days on market $189,900 Active 8 DOM
-
2026-06-18days on market $189,900 Active 7 DOM
-
2026-06-17days on market $189,900 Active 6 DOM
-
2026-06-16days on market $189,900 Active 5 DOM
-
2026-06-15days on market $189,900 Active 4 DOM
-
2026-06-14days on market $189,900 Active 2 DOM
-
2026-06-12remarks 542-char remark
-
2026-06-12$189,900 Active 1 DOM
ⓘ Source: listings_history table (triggers on properties + properties_extension) + one-shot
backfill from property_details.listing_events for pre-trigger history.
Nearby sold comps map
Loading sold comps map…
Walkable amenities ~0.75 mi
Loading nearby amenities…
Taxation est. · year 1
- Rental income
- $23,040
- − Mortgage interest
- −$10,637
- − Property taxes
- −$2,848
- − Insurance
- −$950
- − Repairs & maintenance
- −$1,843
- − Management
- −$1,843
- − Depreciation
- −$5,524
- Taxable loss
- −$606
- Est. tax savings @ 24.0%
- +$145
- After-tax cash flow
- $2,599/yr
For passive investors: Depreciation is non-cash, so a rental often shows a tax loss while cash-flowing — sheltering income. Rental losses are passive: they offset passive income freely, and up to $25,000/yr can offset ordinary (W-2) income if you actively participate and your MAGI is under $100k (phasing out to $0 by $150k); unused losses carry forward. On sale, claimed depreciation is recaptured at up to 25%, and gains may owe capital-gains tax (a 1031 exchange can defer both). Figures are a year-1 estimate at your 24.0% rate — not tax advice; consult a CPA.
Schools (NCES district)
- District
- Berryville School District
- NCES district ID
- 0503150
- Math proficiency
- 31% ▼ -12.00%
- Reading proficiency
- 31% ▼ -11.00%
- Median HH income
- $37,169
- Composite
- 25.81/100
- National rank
- #7360
- State rank
- #148 of 238 in AR
Livability — Berryville
- Score
- 67/100
- State rank
- #103
- US rank
- #10632
Category grades
Schools grade is shown separately in the Schools card above.
Census & demographics
- Census place
- Berryville, AR
- Population (ZIP)
- 11,046
Population outlook (Carroll County) Hauer SSP2
- Today (2025)
- 28,014 people
- By 2030
- 28,006 · +-0.0%
- By 2040
- 28,242 · +0.8%
- By 2050
- 29,169 · +4.1%
- By 2075
- 33,935 · +21.1%
- By 2100
- 39,497 · +41.0%
Race, ethnicity, and origin ACS 2023
- Neighborhood character
- Majority White (65%)
- Race & ethnicity
- White 65% Two or more races 27% Hispanic / Latino 18% Asian 2% Native American 1%
- Hispanic origin (detail)
- Mexican 13%
- Common ancestry
- Slovak 1% Italian 1% Scottish 1%
- Foreign-born
- 10% · Canada
- Languages at home
- 83% English-only · Spanish 11% German/W. Germanic 3% Other Asian/Pacific 2%
Political lean MEDSL · Carroll
- 2024 margin
- Solid R (+31.7) · D 33.0% · R 64.7% · Other 2.2%
- 2008→2024 swing
- -13.6pp toward R · 2008: -18.1pp · 2024: -31.7pp
- All cycles
- 2024: R+31.7 2020: R+28.8 2016: R+32.3 2012: R+23.9 2008: R+18.1
Not yet ingested
- Civics
- —
Market trends
- HPI YoY
- ▲ 40.46%
- Current HPI
- 306.898
- Rent YoY
- —
- Metro
- —
- State GDP YoY
- ▲ 3.80%
- F500 in state
- 10
Industry mix (Fortune 500 HQ in AR)
| Industry | F500 HQs | Revenue |
|---|---|---|
| Retail | 1 | $681B |
|
||
| Food / Agriculture | 1 | $53B |
|
||
| Retail / Energy | 1 | $22B |
|
||
| Transportation / Logistics | 1 | $12B |
|
||
| Energy | 1 | $4B |
|
||
Price history
-84.8% since first listed6 events — show timeline
- 2026-06-11 Listed $189,900 NWARMLS
- 2023-05-01 Sold (MLS) $1,100,000 NWARMLS
- 2023-05-01 Sold (MLS) $1,100,000 NWARMLS
- 2023-03-23 Pending — NWARMLS
- 2023-03-06 Listed $1,250,000 NWARMLS
- 2023-03-06 Listed $1,250,000 NWARMLS
Cash-flow waterfall
monthlySold comps — $/sqft
last 12 mo · ≤1 miLoading sold comps…