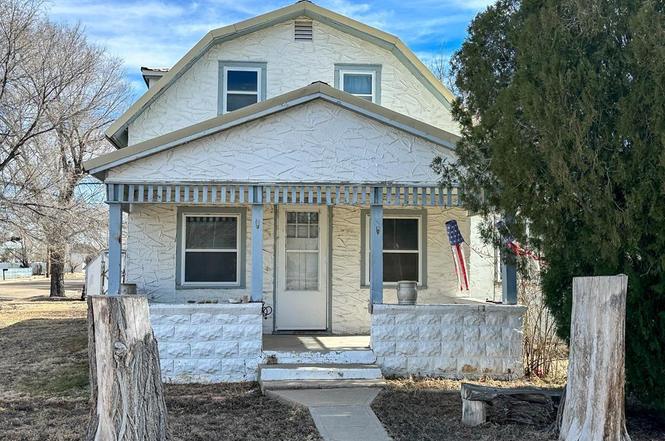
101 S 8th St · Lamar, CO
Flood risk No data
- FEMA flood zone
- —
- Chance of flooding over 30 yrs
- —
- Est. flood insurance / yr
- —
Fire risk No data
- Est. fire insurance / yr
- —
Heat risk No data
- Hot days now (above threshold)
- —
- Hot days in 30 yrs
- —
Wind risk No data
- Chance of severe wind over 30 yrs
- —
Air-quality risk No data
- Unhealthy air days now
- —
- Unhealthy air days in 30 yrs
- —
Risk factors via First Street. Map © Google.
Why this score? — see what drove the C+ grade
The composite is a weighted blend of 9 inputs, each scored 0–100. Each bar is that input's sub-score; the figure is the points it added to the 100-point composite (weight × sub-score).
- Cash flow +21.5/30.0
- ARV discount +15.0/15.0
- DSCR +6.9/10.0
- 1% rule +5.6/10.0
- Livability +3.9/5.0
- Rent growth +2.5/5.0
- Condition / age +2.5/5.0
- Schools +2.2/10.0
- Appreciation +0.0/10.0
$90,000
🖨 Deal sheet 📄 Offer letter ✓ Due diligence
Listing remarks
Investor special or sweat-equity opportunity! This corner-lot home offers a solid starting point with two bedrooms, two bathrooms, and a spacious living room that provides plenty of room to reimagine the layout. Upstairs you'll find two additional rooms that could easily be converted into bedrooms by adding closet, creating the potential for a four-bedroom home. The metal roof adds long-term durability, while the corner lot offers extra space, curb appeal, and flexibility. With the right vision and updates, this property has the potential to become a fantastic primary residence, rental, or flip. Bring your ideas and turn this diamond in the rough into something special!
Key facts
- Metal roof
- Curb appeal
- Corner lot
Tags
Property features AI
Finance
- Other: Zoning: R-2; Lot dimensions approximately 70 x 100 (0.161 acres)
- HOA & community: No association amenities
Exterior
- Parking: No garage
- Security: Smoke detectors
- Utilities: Public water; Public sewer
- Home design: Single-family residential property; Frame and stucco construction
- Construction: Metal roof
- Exterior features: Covered patio/porch; Shed(s)
Interior
- Kitchen: No appliances included
- Bedrooms: 2 bedrooms on the main level
- Flooring: Carpet; Vinyl
- Bathrooms: 2 full bathrooms (1 on the main level)
- Heating & cooling: Central air; Ceiling fans; Forced air heating
- Interior features: Ceiling fans; Master bedroom on main level; Double-pane windows with wood frames
- Laundry & utility: Laundry area on the main level
Neighborhood map
What this means for you Summary
Snapshot
- This is a 2-bed/1.0-bath single-family listed at $90k.
Deal economics
- At list price, monthly cash flow is $135 ($2k/yr) — positive.
- The deal already cash-flows at list — no discount required.
- Meets the 1% rule at list price ($958 rent vs $90k).
- Recommended offer: $79k (12.0% below list) — sets the bar for market timing.
- Cap rate 8.1% vs local median 4.2% in Lamar — top-decile yield for the area; either an underpriced asset or a hidden risk that comps aren't pricing in. Stress-test before assuming the spread holds.
Location & tenants
- Location reads 78/100 on livability (#21 in CO, #2,616 nationally) — a middle-class / working-renter tenant base. Strengths: crime A+, cost of living A+, housing A+; Watch: schools D-, amenities F, commute F.
- Lamar School District No. Re-2 (town): math 19% / reading 34% proficiency, ranked #65 of 86 in CO (top 76%) — low school quality limits family demand, transient renter base, plan for 1-2y turnover.
- Market conditions: 49 active listings in the ZIP; 11 units permitted in Prowers County in 2024 (0 in 5+ unit buildings).
Forward outlook
- Local home prices are declining (-3.0%/yr); year-one equity from $622 of loan paydown is wiped out by about $3k of value loss. Plan a longer hold.
- Prowers County population projected at -33% by 2050 — secular population decline; favor cash flow + early exit over multi-decade hold.
Negotiation context
- It's been on market 128 days — a 12% lower offer ($79k) is reasonable based on typical stale-listing flexibility.
Risks & watch-outs
- Watch-outs: built in 1920 — expect roof / HVAC / electrical / plumbing capex.
Questions for the listing agent
- It's been on market 128 days. Have you received any prior offers? Is the seller open to a 12% concession, seller financing, or rate buy-down credit?
- Built in 1920 — when were the roof, HVAC, electrical panel, plumbing, and water heater last replaced?
- Why hasn't it sold? Are there any deal-killer items the seller is aware of (foundation, flood, title, zoning, code violations)?
- Is there a deadline driving the sale (1031 exchange, divorce, estate, relocation)? That informs how much negotiation room exists.
- Schools are D-rated, which usually means shorter tenancies and higher turnover. Who's the typical renter profile here, and what's been the actual vacancy rate?
- What's the average days-on-market for RENTAL listings here right now (not sales)? A rising rental-DOM trend means longer vacancies and softer asking-rent achievability than the comps imply.
- What's the recent tenant-quality profile in this submarket — average credit score on applications, eviction rate, late-payment / NSF rate, and stable-employment percentage? A property-management company in the area should have these aggregated.
- How much new for-sale + rental construction is in the pipeline within 1–3 miles? Heavy new supply typically softens prices + rents 12–24 months out; constrained supply supports both.
Investment metrics
- 1% rule
- 1.06% ✓
- Cap rate
- 8.09%
- Cash-on-cash
- 6.41%
- DSCR
- 1.29
- GRM
- 7.8
CMA / ARV
- ARV (on-the-fly)
- $153,768
- Comps found
- 12
Show comp detail 12 sales within ~0.75 mi
| Address | Dist | Beds/Ba | Sqft | Sold | Price | $/sf | Match |
|---|---|---|---|---|---|---|---|
| 804 S 9th St | 0.52mi | 2/1.0 | 1,040 (+1%) | 0mo | $155,000 | $149 | 74 |
| 308 N 8th St | 0.28mi | 2/1.0 | 918 (-11%) | 11mo | $122,500 | $133 | 60 |
| 204 S 12th St | 0.33mi | 2/1.0 | 912 (-12%) | 8mo | $165,000 | $181 | 59 |
| 900 S 6th St | 0.60mi | 3/2.0 (+1) | 1,066 (+3%) | 1mo | $205,000 | $192 | 57 |
| 710 S 7th St | 0.48mi | 2/1.0 | 1,124 (+9%) | 8mo | $135,000 | $120 | 56 |
| 408 E Oak St | 0.59mi | 3/1.0 (+1) | 1,084 (+5%) | 4mo | $151,000 | $139 | 56 |
| 410 S 3rd St | 0.48mi | 2/1.0 | 980 (-5%) | 16mo | $171,000 | $174 | 56 |
| 811 S 12th St | 0.60mi | 2/1.0 | 988 (-4%) | 19mo | $188,600 | $191 | 49 |
| 607 W Logan St | 0.51mi | 3/1.0 (+1) | 1,146 (+11%) | 10mo | $148,500 | $130 | 45 |
| 1000 S 12th St | 0.70mi | 2/1.0 | 1,184 (+15%) | 1mo | $155,000 | $131 | 42 |
| 904 S 11th St | 0.63mi | 3/2.0 (+1) | 1,176 (+14%) | 3mo | $189,000 | $161 | 36 |
| 608 W Walnut St | 0.55mi | 2/2.0 | 1,182 (+14%) | 18mo | $85,000 | $72 | 31 |
Match score weights: distance 35% · size 25% · config 20% · recency 20%. Top-matched comps best support the ARV.
Projected returns pro-forma
-3.0% appreciation · 3.0% rent growth · sell at horizon
- IRR
- -6.4%
- Equity multiple
- 0.76×
- Total profit
- $-5,997
- Equity at exit
- $13,419
- IRR
- 3.2%
- Equity multiple
- 1.23×
- Total profit
- $5,874
- Equity at exit
- $7,782
Cash invested: $25,200 (down + closing). Projections, not guarantees.
Landlord ↔ Tenant lean methodology
- Overall (STATE)
- 38 Tenant-Leaning
- State Colorado
- 38 Tenant-Leaning · D+4
- County
- — inherits STATE
- City
- — inherits STATE
ZIP-level market 81052
- Home prices YoY
- -22.6%
- Active inventory
- 49
- Price-to-rent
- 7.8×
Monthly cashflow live
- Estimated rent
- $958 medium interval (Pro) →
- Mortgage (P&I)
- −$472
- Tax est. 1.5%
- −$112 /mo · $1,350/yr
- Insurance
- −$38
- HOA
- −$0
- Vacancy / Maint / Mgmt
- −$201
- Net cashflow
- $135
Break-even live
UW: 25.0% down · 7.5% · 30yr · 1.5% tax · 5.0% vac · 8.0% maint · 8.0% mgmt
Financing live
Cash to close
- Down payment
- $22,500
- Closing costs
- $2,700
- Reserves months
- —
- Total cash needed
- —
Loan-product check · same deal, 3 products live
Conventional
25% down · 7.5% · 30yr
- Down + closing
- —
- Monthly P&I
- —
- Monthly cashflow
- —
- DSCR
- —
- Eligible?
- —
Personal DTI + credit; lowest rate.
DSCR
20% down · 8.5% · 30yr
- Down + closing
- —
- Monthly P&I
- —
- Monthly cashflow
- —
- DSCR
- —
- Eligible?
- —
No personal income docs; deal must DSCR.
Hard money
10% down · 12.0% · 12mo
- Down + closing
- —
- Monthly P&I
- —
- Monthly cashflow
- —
- DSCR
- —
- Eligible?
- —
Short-term bridge; refi at stabilization.
Listing history 16 events
-
2026-06-18days on market $90,000 Active 128 DOM
-
2026-06-17days on market $90,000 Active 127 DOM
-
2026-06-16days on market $90,000 Active 126 DOM
-
2026-06-15days on market $90,000 Active 125 DOM
-
2026-06-13days on market $90,000 Active 123 DOM
-
2026-06-12days on market $90,000 Active 122 DOM
-
2026-06-09days on market $90,000 Active 119 DOM
-
2026-06-08days on market $90,000 Active 118 DOM
-
2026-06-07days on market $90,000 Active 117 DOM
-
2026-06-07days on market $90,000 Active 116 DOM
-
2026-06-04days on market $90,000 Active 113 DOM
-
2026-06-02days on market $90,000 Active 112 DOM
-
2026-06-01days on market $90,000 Active 111 DOM
-
2026-05-31days on market $90,000 Active 110 DOM
-
2026-05-31days on market $90,000 Active 109 DOM
-
2026-02-10$90,000 Active
ⓘ Source: listings_history table (triggers on properties + properties_extension) + one-shot
backfill from property_details.listing_events for pre-trigger history.
Nearby sold comps map
Loading sold comps map…
Walkable amenities ~0.75 mi
Loading nearby amenities…
Taxation est. · year 1
- Rental income
- $11,492
- − Mortgage interest
- −$5,041
- − Property taxes
- −$1,350
- − Insurance
- −$450
- − Repairs & maintenance
- −$919
- − Management
- −$919
- − Depreciation
- −$2,618
- Taxable income
- $194
- Est. tax owed @ 24.0%
- −$46
- After-tax cash flow
- $1,569/yr
For passive investors: Depreciation is non-cash, so a rental often shows a tax loss while cash-flowing — sheltering income. Rental losses are passive: they offset passive income freely, and up to $25,000/yr can offset ordinary (W-2) income if you actively participate and your MAGI is under $100k (phasing out to $0 by $150k); unused losses carry forward. On sale, claimed depreciation is recaptured at up to 25%, and gains may owe capital-gains tax (a 1031 exchange can defer both). Figures are a year-1 estimate at your 24.0% rate — not tax advice; consult a CPA.
Schools (NCES district)
- District
- Lamar School District No. Re-2
- NCES district ID
- 0805220
- Math proficiency
- 19% ▼ -7.00%
- Reading proficiency
- 34% ▼ -1.00%
- Median HH income
- $36,602
- Composite
- 21.96/100
- National rank
- #8216
- State rank
- #65 of 86 in CO
Livability — Lamar
- Score
- 78/100
- State rank
- #21
- US rank
- #2616
Category grades
Schools grade is shown separately in the Schools card above.
Census & demographics
- Census place
- Lamar, CO
- Population (ZIP)
- 9,010
Population outlook (Prowers County) Hauer SSP2
- Today (2025)
- 10,654 people
- By 2030
- 9,902 · -7.1%
- By 2040
- 8,419 · -21.0%
- By 2050
- 7,122 · -33.2%
- By 2075
- 4,648 · -56.4%
- By 2100
- 2,900 · -72.8%
Race, ethnicity, and origin ACS 2023
- Neighborhood character
- Majority White (55%)
- Race & ethnicity
- White 55% Hispanic / Latino 41% Two or more races 15% Native American 1%
- Hispanic origin (detail)
- Mexican 33%
- Common ancestry
- Portuguese 2% Slovak 1% Iranian 1%
- Foreign-born
- 10% · Canada
- Languages at home
- 83% English-only · Spanish 16%
Political lean MEDSL · Prowers
- 2024 margin
- Solid R (+50.7) · D 23.9% · R 74.5% · Other 1.6%
- 2008→2024 swing
- -16.9pp toward R · 2008: -33.7pp · 2024: -50.7pp
- All cycles
- 2024: R+50.7 2020: R+45.9 2016: R+46.9 2012: R+35.4 2008: R+33.7
Not yet ingested
- Civics
- —
Market trends
- HPI YoY
- ▼ -81.59%
- Current HPI
- 279.7054
- Rent YoY
- —
- Metro
- —
- State GDP YoY
- ▲ 1.95%
- F500 in state
- 14
Industry mix (Fortune 500 HQ in CO)
| Industry | F500 HQs | Revenue |
|---|---|---|
| Technology Distribution | 1 | $31B |
|
||
| Food / Agriculture | 1 | $18B |
|
||
| Packaging | 1 | $14B |
|
||
| Healthcare | 1 | $13B |
|
||
| Energy | 1 | $10B |
|
||
| Technology | 1 | $4B |
|
||
Price history
1 event — show timeline
- 2026-02-10 Listed $90,000 PARMLS
Property tax history
-1.6%/yrLatest (2025): $110 · +204.4% YoY. Source: county tax records.
Cash-flow waterfall
monthlySold comps — $/sqft
last 12 mo · ≤1 miLoading sold comps…