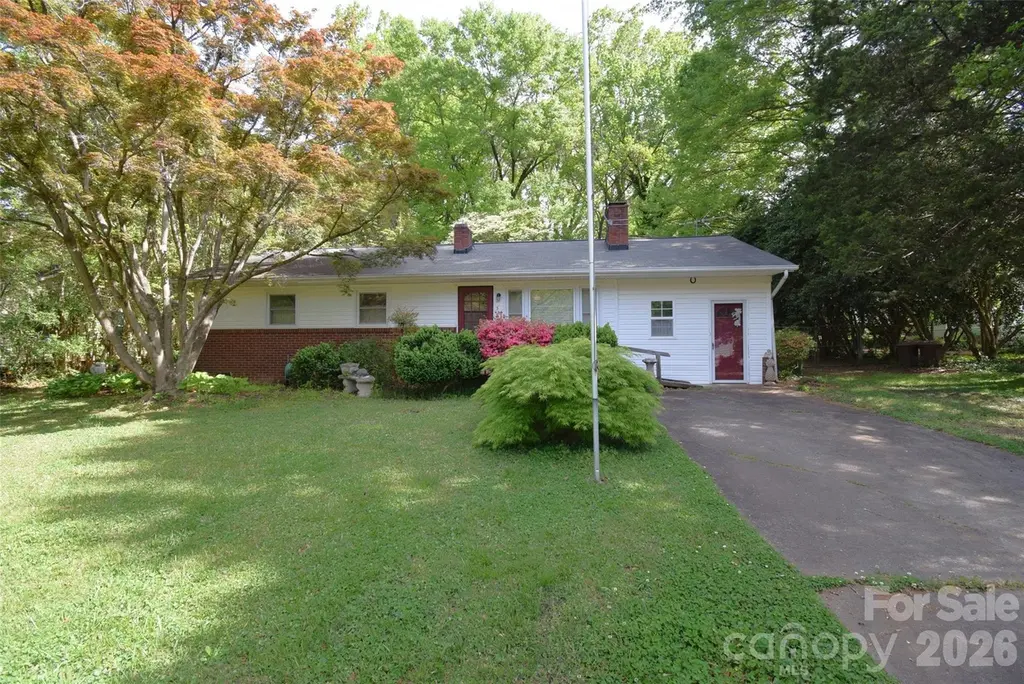
502 W Henry St · Mount Holly, NC
Flood risk 1/10 · Minimal
- FEMA flood zone
- X (unshaded)
- Chance of flooding over 30 yrs
- 0.0%
- Est. flood insurance / yr
- $507 – $1,088
Fire risk 1/10 · Minimal
- Est. fire insurance / yr
- $906 – $1,684
Heat risk 6/10 · Moderate
- Hot days now (above 105°F)
- 7 days/yr
- Hot days in 30 yrs
- 17 days/yr
Wind risk 5/10 · Moderate
- Chance of severe wind over 30 yrs
- 23.0%
Air-quality risk 3/10 · Minor
- Unhealthy air days now
- 3 days/yr
- Unhealthy air days in 30 yrs
- 4 days/yr
Risk factors via First Street. Map © Google.
Why this score? — see what drove the C+ grade
The composite is a weighted blend of 9 inputs, each scored 0–100. Each bar is that input's sub-score; the figure is the points it added to the 100-point composite (weight × sub-score).
- Cash flow +23.9/30.0
- ARV discount +15.0/15.0
- DSCR +7.7/10.0
- 1% rule +5.1/10.0
- Schools +3.6/10.0
- Livability +3.4/5.0
- Rent growth +3.2/5.0
- Condition / age +2.5/5.0
- Appreciation +0.0/10.0
$230,000
🖨 Deal sheet 📄 Offer letter ✓ Due diligence
Listing remarks
This property has great potential! 1-owner home, and it is dated but appears to have been well cared for over the years. 3-bedroom, 1-bath home with an enclosed carport (included in the heated square footage). Hardwood flooring in the family room, hallway, and 2 of the 3 bedrooms. The windows have been upgraded to insulated windows at some point. The roof is believed to be approx 2007, the HVAC approx 5 years old. There is a lot to work with here, or it can easily be lived in, in its present state. Come check it out. This is an Estate property with only 1 heir and will be conveyed by a special warranty deed and in as-is condition. The Seller has not lived in the home in several years. The s
Key facts
- 0.67 acre lot
- Built 1962
- Listed 38 days
Property features AI
Finance
- HOA & community: No HOA
Exterior
- Parking: Driveway
- Utilities: City water; Public sewer; Electricity connected
- Home design: Single-family residence (site built); One story; R-12 zoning
- Construction: Brick partial and vinyl exterior; Composition roof; Crawl space and slab foundation; Built as site-built construction
- Exterior features: Deck; Back yard fencing; Concrete and paved road access (publicly maintained)
Interior
- Kitchen: Electric cooktop; Wall oven
- Bedrooms: 3 bedrooms on the main level
- Flooring: Tile; Vinyl; Wood
- Bathrooms: 1 full bathroom on the main level
- Heating & cooling: Forced air heating (natural gas); Central air conditioning
- Interior features: Insulated windows; 8 total rooms; Fireplace in the family room
- Laundry & utility: Dedicated laundry room
Neighborhood map
What this means for you Summary
Snapshot
- This is a 2-bed/1.0-bath single-family listed at $230k.
Deal economics
- At list price, monthly cash flow is $447 ($5k/yr) — positive.
- The deal already cash-flows at list — no discount required.
- Meets the 1% rule at list price ($2k rent vs $230k).
- Recommended offer: $223k (3.0% below list) — sets the bar for market timing.
- Cap rate 8.6% vs local median 3.9% in Mount Holly — top-decile yield for the area; either an underpriced asset or a hidden risk that comps aren't pricing in. Stress-test before assuming the spread holds.
Location & tenants
- Location reads 67/100 on livability (#214 in NC) — a middle-class / working-renter tenant base. Strengths: cost of living A+, housing A+, crime A-; Watch: employment D+, health & safety D+, amenities F.
- Gaston County Schools (suburban): math 44% / reading 42% proficiency, ranked #93 of 178 in NC (top 52%) — families likely to look elsewhere, expect single-tenant / working-renter base with shorter leases.
- Zoned schools: Catawba Heights Elementary (math 47% / reading 37%, grade F, #633 of 1,410 statewide, top 48%, 259 students, 67% FRL); South Point High (math 87% / reading 71%, grade A-, #82 of 535 statewide, top 15%, 955 students, 32% FRL).
- Zoned-school proficiency averages 60% at this address vs 43% district-wide (+18 pts) — the actual schools serving this property are materially stronger than the Gaston County Schools average implies; a family-tenant draw the district grade alone would hide.
- Market conditions: Rents rising (+2.7%/yr); 420 active listings in the ZIP; 18 comparable units currently listed for rent nearby; rentals at typical pace (median 24d on market — plan ~3-4 weeks tenant-placement turnaround); solid renter incomes; 2,069 units permitted in Gaston County in 2024 (142 in 5+ unit buildings).
- This rent runs 34% of the median local income ($83k/yr) — at the standard rent-burdened threshold; future hikes will face affordability resistance.
Forward outlook
- Local home prices are declining (-3.0%/yr); year-one equity from $2k of loan paydown is wiped out by about $7k of value loss. Plan a longer hold.
- Gaston County population projected at +12% by 2050 — modest demand growth; plan on rents tracking national, not racing it.
Negotiation context
- It's been on market 38 days — a 3% lower offer ($223k) is reasonable based on typical stale-listing flexibility.
Risks & watch-outs
- Climate carrying-cost: moderate wind risk, 23% chance of damaging wind over 30y; extreme-heat days projected 7→17/yr by 2055 (HVAC capex compounding) — expect insurance premiums to compound above CPI over the hold.
Questions for the listing agent
- It's been on market 38 days. Have you received any prior offers? Is the seller open to a 3% concession, seller financing, or rate buy-down credit?
- Built in 1962 — when were the roof, HVAC, electrical panel, plumbing, and water heater last replaced?
- Is there a deadline driving the sale (1031 exchange, divorce, estate, relocation)? That informs how much negotiation room exists.
- Schools are D-rated, which usually means shorter tenancies and higher turnover. Who's the typical renter profile here, and what's been the actual vacancy rate?
- What's the average days-on-market for RENTAL listings here right now (not sales)? A rising rental-DOM trend means longer vacancies and softer asking-rent achievability than the comps imply.
- What's the recent tenant-quality profile in this submarket — average credit score on applications, eviction rate, late-payment / NSF rate, and stable-employment percentage? A property-management company in the area should have these aggregated.
- How much new for-sale + rental construction is in the pipeline within 1–3 miles? Heavy new supply typically softens prices + rents 12–24 months out; constrained supply supports both.
Investment metrics
- 1% rule
- 1.01% ✓
- Cap rate
- 8.62%
- Cash-on-cash
- 8.32%
- DSCR
- 1.37
- GRM
- 8.2
CMA / ARV
- ARV (on-the-fly)
- $325,000
- Comps found
- 12
Show comp detail 12 sales within ~0.75 mi
| Address | Dist | Beds/Ba | Sqft | Sold | Price | $/sf | Match |
|---|---|---|---|---|---|---|---|
| 511 Cherry St | 0.12mi | 3/2.0 (+1) | 1,212 (-7%) | 1mo | $305,500 | $252 | 73 |
| 300 Cherry St | 0.21mi | 2/2.0 | 1,244 (-4%) | 10mo | $255,000 | $205 | 71 |
| 226-B Brookwood Rd | 0.17mi | 3/2.0 (+1) | 1,181 (-9%) | 2mo | $274,900 | $233 | 66 |
| 203 Blanche Ave | 0.50mi | 3/2.0 (+1) | 1,276 (-2%) | 1mo | $340,000 | $266 | 64 |
| 107 Fire Department Dr | 0.54mi | 3/2.0 (+1) | 1,323 (+2%) | 2mo | $385,000 | $291 | 61 |
| 108 E Main St | 0.49mi | 3/2.0 (+1) | 1,338 (+3%) | 7mo | $319,000 | $238 | 57 |
| 515 Cherry St | 0.16mi | 3/2.5 (+1) | 1,462 (+12%) | 6mo | $325,000 | $222 | 56 |
| 1306 S Main St | 0.42mi | 2/1.5 | 1,118 (-14%) | 1mo | $230,000 | $206 | 54 |
| 100 Centerview St | 0.58mi | 3/2.0 (+1) | 1,213 (-7%) | 0mo | $337,000 | $278 | 52 |
| 936 Cason St | 0.44mi | 3/2.0 (+1) | 1,140 (-12%) | 0mo | $285,000 | $250 | 50 |
| 206 Ross Ct | 0.53mi | 3/1.0 (+1) | 1,120 (-14%) | 1mo | $268,000 | $239 | 46 |
| 1114 Cason St #6 | 0.64mi | 3/2.0 (+1) | 1,208 (-7%) | 8mo | $337,000 | $279 | 42 |
Match score weights: distance 35% · size 25% · config 20% · recency 20%. Top-matched comps best support the ARV.
Projected returns pro-forma
-3.0% appreciation · 2.67% rent growth · sell at horizon
- IRR
- -4.0%
- Equity multiple
- 0.85×
- Total profit
- $-9,678
- Equity at exit
- $34,294
- IRR
- 5.3%
- Equity multiple
- 1.38×
- Total profit
- $24,718
- Equity at exit
- $19,886
Cash invested: $64,400 (down + closing). Projections, not guarantees.
Landlord ↔ Tenant lean methodology
- Overall (STATE)
- 85 Strongly Landlord-Friendly
- State North Carolina
- 85 Strongly Landlord-Friendly · R+3
- County
- — inherits STATE
- City
- — inherits STATE
ZIP-level market 28012
- Home prices YoY
- -34.5%
- Rents YoY
- 2.7%
- Active inventory
- 420
- Price-to-rent
- 8.2×
Monthly cashflow live
- Estimated rent
- $2,334 high interval (Pro) →
- Mortgage (P&I)
- −$1,206
- Tax from tax record
- −$95 /mo · $1,145/yr
- Insurance
- −$96
- HOA
- −$0
- Vacancy / Maint / Mgmt
- −$490
- Net cashflow
- $447
Break-even live
UW: 25.0% down · 7.5% · 30yr · 1.5% tax · 5.0% vac · 8.0% maint · 8.0% mgmt
Financing live
Cash to close
- Down payment
- $57,500
- Closing costs
- $6,900
- Reserves months
- —
- Total cash needed
- —
Loan-product check · same deal, 3 products live
Conventional
25% down · 7.5% · 30yr
- Down + closing
- —
- Monthly P&I
- —
- Monthly cashflow
- —
- DSCR
- —
- Eligible?
- —
Personal DTI + credit; lowest rate.
DSCR
20% down · 8.5% · 30yr
- Down + closing
- —
- Monthly P&I
- —
- Monthly cashflow
- —
- DSCR
- —
- Eligible?
- —
No personal income docs; deal must DSCR.
Hard money
10% down · 12.0% · 12mo
- Down + closing
- —
- Monthly P&I
- —
- Monthly cashflow
- —
- DSCR
- —
- Eligible?
- —
Short-term bridge; refi at stabilization.
Rent comps 18 comps
| Address | Beds | Baths | Sqft | Rent | $/sqft | DOM | Units | Dist |
|---|---|---|---|---|---|---|---|---|
| 107 Robinson St Belmont, NC | 3.0 | 2.0 | 1300 | $3,600 | $2.77 | 4d | 1 | 0.04mi |
| 5038 Clearwater Lake Rd Unit 1 Mt Holly, NC | 3.0 | 2.0 | 1852 | $1,650 | $0.89 | 17d | 1 | 0.32mi |
| 106 Margarette Ave Belmont, NC | 2.0 | 2.0 | 1250 | $1,750 | $1.40 | 23d | 1 | 0.33mi |
| 404 Belmont Mount Holly Rd Belmont, NC | 2.0 | 1.5 | 1050 | $1,648 | $1.57 | 14d | 2 | 0.46mi |
| 301 Tomberlin Rd Mount Holly, NC | 3.0 | 2.0 | 1349 | $2,500 | $1.85 | 23d | 1 | 0.50mi |
| 301 Tomberlin Rd Mount Holly, NC | 3.0 | 2.0 | 1349 | $2,400 | $1.78 | 4d | 1 | 0.50mi |
| 1109 Cason St Belmont, NC | 3.0 | 2.0 | 1155 | $1,625 | $1.41 | 4d | 1 | 0.61mi |
| 106 Adcock St Belmont, NC | 3.0 | 1.5 | 1084 | $1,850 | $1.71 | 23d | 1 | 0.61mi |
| 214 Ferstl Ave Belmont, NC | 2.0 | 1.0 | 1014 | $1,250 | $1.23 | 23d | 1 | 0.71mi |
| 199 Belmont Mt Holly Rd Belmont, NC | 1.0–2.0 | 1.0–1.5 | 874 | $1,925 | $2.20 | 2d | 9 | 0.71mi |
| 308 Eastwood Dr Mount Holly, NC | 3.0 | 2.5 | 1414 | $2,400 | $1.70 | 23d | 1 | 0.81mi |
| 224 Howard St Mount Holly, NC | 2.0 | 1.0 | 917 | $1,450 | $1.58 | 23d | 1 | 0.93mi |
| 1103 Johns Walk Way Belmont, NC | 1.0 | 1.0 | 1325 | $575 | $0.43 | 23d | 1 | 1.04mi |
| 1029 Beatty Woods Dr Belmont, NC | 1.0 | 1.0 | 1321 | $770 | $0.58 | 23d | 1 | 1.05mi |
| 417 River Park Rd Belmont, NC | 2.0 | 2.5 | 1156 | $1,750 | $1.51 | 23d | 1 | 1.16mi |
| 315 Pine Rd Mount Holly, NC | 3.0 | 2.0 | 1653 | $1,750 | $1.06 | 21d | 1 | 1.36mi |
| 315 Pine Rd Mount Holly, NC | 3.0 | 2.0 | 1653 | $1,750 | $1.06 | 10d | 1 | 1.36mi |
| 63 Caldwell Dr Belmont, NC | 1.0–3.0 | 1.0–2.0 | 1056 | $1,917 | $1.81 | 2d | 41 | 1.45mi |
Listing history 4 events
-
2026-05-18status Pending
-
2026-05-12price $230,000
-
2026-04-11$250,000 Active
-
2026-04-09historical $250,000
ⓘ Source: listings_history table (triggers on properties + properties_extension) + one-shot
backfill from property_details.listing_events for pre-trigger history.
Tax reassessment forecast NC · Resets to sale price
- Current annual tax
- $1,145 · $95/mo
- Projected year-2 tax
- $1,886 · $157/mo
- Expected delta
- +$741/yr (+$62/mo · 64.8%)
ⓘ Screening estimate from a state-policy table — verify with the county assessor before closing.
Climate risk First Street
- Flood 1/10 Low FEMA zone X (unshaded) · 0% chance over 30 yrs
- Wildfire 1/10 Low
- Heat 6/10 Major 7 d/yr ≥105°F today · 17 d/yr by 30 yrs out
- Wind 5/10 Major 23% chance of damaging wind over 30 yrs
- Air quality 3/10 Moderate 3 unhealthy d/yr today · 4 by 30 yrs out
Nearby sold comps map
Loading sold comps map…
Walkable amenities ~0.75 mi
Loading nearby amenities…
Taxation est. · year 1
- Rental income
- $28,010
- − Mortgage interest
- −$12,884
- − Property taxes
- −$1,145
- − Insurance
- −$1,150
- − Repairs & maintenance
- −$2,241
- − Management
- −$2,241
- − Depreciation
- −$6,691
- Taxable income
- $1,660
- Est. tax owed @ 24.0%
- −$398
- After-tax cash flow
- $4,962/yr
For passive investors: Depreciation is non-cash, so a rental often shows a tax loss while cash-flowing — sheltering income. Rental losses are passive: they offset passive income freely, and up to $25,000/yr can offset ordinary (W-2) income if you actively participate and your MAGI is under $100k (phasing out to $0 by $150k); unused losses carry forward. On sale, claimed depreciation is recaptured at up to 25%, and gains may owe capital-gains tax (a 1031 exchange can defer both). Figures are a year-1 estimate at your 24.0% rate — not tax advice; consult a CPA.
Schools (NCES district)
- District
- Gaston County Schools
- NCES district ID
- 3701620
- Math proficiency
- 44% ▲ 4.00%
- Reading proficiency
- 42% ▲ 1.00%
- Median HH income
- $43,644
- Composite
- 36.39/100
- National rank
- #4680
- State rank
- #93 of 178 in NC
Livability — Mount Holly
- Score
- 67/100
- State rank
- #214
- US rank
- #10224
Category grades
Schools grade is shown separately in the Schools card above.
Census & demographics
- Census place
- Mount Holly, NC
- County
- Gaston County · 201,497 people
- City population
- 25,805
- Metro
- Charlotte-Concord-Gastonia, NC-SC
- Population (ZIP)
- 26,556
- Household income
- $83,391
- Rent vs Own
- Severe rent burden
- 778.0
Population outlook (Gaston County) Hauer SSP2
- Today (2025)
- 230,027 people
- By 2030
- 237,300 · +3.2%
- By 2040
- 249,659 · +8.5%
- By 2050
- 257,806 · +12.1%
- By 2075
- 272,163 · +18.3%
- By 2100
- 268,652 · +16.8%
Race, ethnicity, and origin ACS 2023
- Neighborhood character
- Predominantly White (84%)
- Race & ethnicity
- White 84% Black 6% Hispanic / Latino 4% Two or more races 4% Asian 4%
- Common ancestry
- Serbian 3% Romanian 2% Slovak 2%
- Foreign-born
- 4% · Canada, Vietnam, China
- Languages at home
- 93% English-only · Spanish 2% Other Indo-European 2% French/Haitian/Cajun 1%
Political lean MEDSL · Gaston
- 2024 margin
- Strong R (+25.0) · D 37.0% · R 62.1%
- 2008→2024 swing
- 0.0pp no change · 2008: -25.0pp · 2024: -25.0pp
- All cycles
- 2024: R+25.0 2020: R+27.8 2016: R+32.1 2012: R+25.6 2008: R+25.0
Not yet ingested
- Civics
- —
Market trends
- HPI YoY
- ▼ -134.92%
- Current HPI
- 255.562
- Rent YoY
- ▲ 2.67%
- Metro
- Charlotte-Concord-Gastonia, NC-SC
- State GDP YoY
- ▲ 3.28%
- F500 in state
- 26
Industry mix (Fortune 500 HQ in NC)
| Industry | F500 HQs | Revenue |
|---|---|---|
| Financial Services | 2 | $213B |
|
||
| Retail | 2 | $95B |
|
||
| Industrial Conglomerate | 1 | $38B |
|
||
| Metals / Steel | 1 | $35B |
|
||
| Utilities | 1 | $30B |
|
||
| Industrial Machinery | 1 | $19B |
|
||
Price history
-8.0% since first listed4 events — show timeline
- 2026-05-18 Pending — CANOPYMLS as Distributed by MLS Grid
- 2026-05-12 Price Changed $230,000 CANOPYMLS as Distributed by MLS Grid
- 2026-04-11 Listed $250,000 CANOPYMLS as Distributed by MLS Grid
- 2026-04-09 Coming Soon $250,000 CANOPYMLS as Distributed by MLS Grid
Property tax history
+4.6%/yrLatest (2025): $1,145 · +0.0% YoY. Source: county tax records.
Cash-flow waterfall
monthlySold comps — $/sqft
last 12 mo · ≤1 miLoading sold comps…