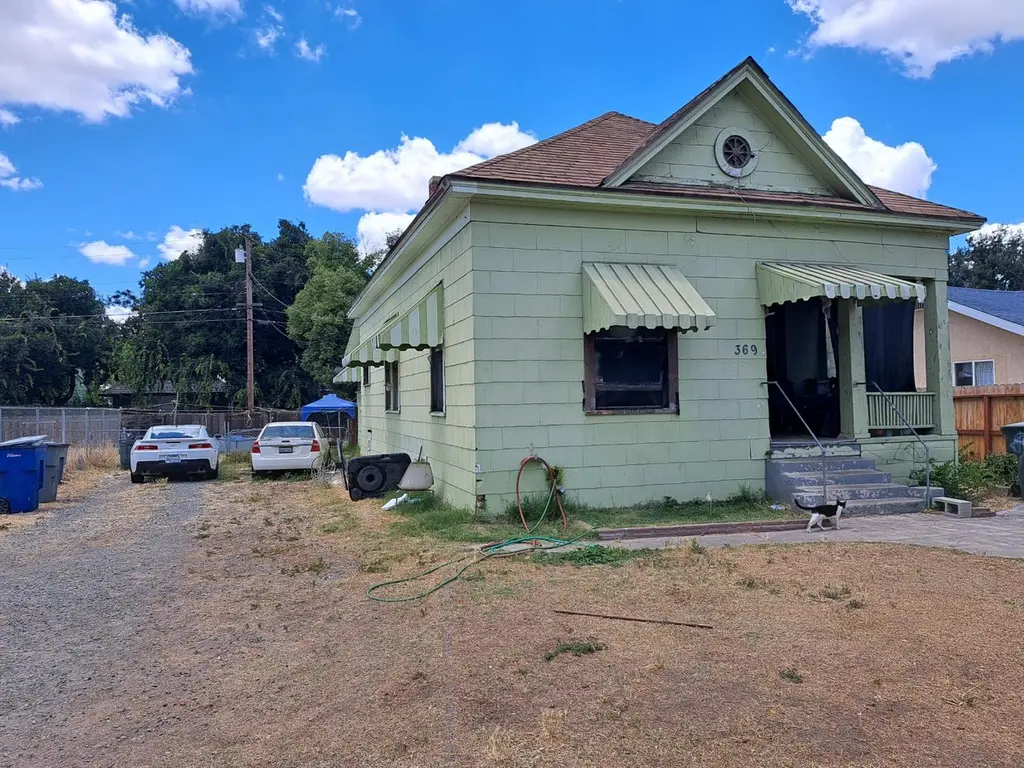
369 N Poplar Ave · Fresno, CA
Flood risk 3/10 · Minor
- FEMA flood zone
- X (unshaded)
- Chance of flooding over 30 yrs
- 0.09%
- Est. flood insurance / yr
- $507 – $1,088
Fire risk 1/10 · Minimal
- Est. fire insurance / yr
- $659 – $1,223
Heat risk 8/10 · Major
- Hot days now (above 105°F)
- 7 days/yr
- Hot days in 30 yrs
- 17 days/yr
Wind risk 1/10 · Minimal
- Chance of severe wind over 30 yrs
- —
Air-quality risk 10/10 · Severe
- Unhealthy air days now
- 40 days/yr
- Unhealthy air days in 30 yrs
- 44 days/yr
Risk factors via First Street. Map © Google.
Why this score? — see what drove the C grade
The composite is a weighted blend of 9 inputs, each scored 0–100. Each bar is that input's sub-score; the figure is the points it added to the 100-point composite (weight × sub-score).
- ARV discount +15.0/15.0
- Cash flow +14.9/30.0
- Appreciation +10.0/10.0
- DSCR +4.6/10.0
- Livability +3.1/5.0
- 1% rule +2.9/10.0
- Schools +2.7/10.0
- Rent growth +2.5/5.0
- Condition / age +2.5/5.0
$210,000
🖨 Deal sheet 📄 Offer letter ✓ Due diligence
Listing remarks MLS
Everything is in place for this 3 bedroom 1 bath home to become the classic that it once was. Open floor plan, hardwood floors, formal dining, in-door laundry, double gate parking on the side. Move-in now, or put a little work in and make this jewel shine. Please note, tax records indicate 2 bedrooms 1 bath buyer to verify.
Key facts
- 7,750 sq ft lot
- Garage
- Built 1924
Property features AI
Exterior
- Parking: 1-car garage
- Utilities: Electric service on; Public sewer; Public utilities
- Home design: Single-family residence
- Construction: Wood subfloor foundation
- Exterior features: One-level home; Urban lot setting; Composition roof; Wood siding exterior; No solar
Interior
- Bathrooms: 1 bathroom
- Heating & cooling: Central heat and air
- Interior features: Central heating and cooling; Laundry located inside
- Laundry & utility: Indoor laundry
Neighborhood map
What this means for you Summary
Snapshot
- This is a 2-bed/1.0-bath single-family listed at $210k.
Deal economics
- At list price, monthly cash flow is $63 ($758/yr) — positive.
- The deal already cash-flows at list — no discount required.
- To meet the 1% rule (rent ≥ 1% of price), the offer needs to be $166k (20.9% below list).
- Recommended offer: $166k (20.9% below list) — sets the bar for 1% rule.
- Cap rate 6.7% vs local median 3.7% in Fresno — top-decile yield for the area; either an underpriced asset or a hidden risk that comps aren't pricing in. Stress-test before assuming the spread holds.
Location & tenants
- Location reads 62/100 on livability (#469 in CA) — a middle-class / working-renter tenant base. Strengths: commute A+, housing A+; Watch: amenities D+, employment D+, crime F.
- Fresno Unified (urban): math 18% / reading 47% proficiency, ranked #327 of 517 in CA (top 63%) — families likely to look elsewhere, expect single-tenant / working-renter base with shorter leases; 77% free/reduced lunch — lower-income household profile, screen leases tightly.
- Zoned schools: Lowell Elementary (339 students, 97% FRL); Tehipite Middle (481 students, 98% FRL); Roosevelt High (math 14% / reading 41%, grade F, #780 of 1,170 statewide, top 67%, 2,228 students, 92% FRL) — zoned schools average 96% FRL vs 77% district-wide (19 pts higher); higher-poverty schools than district average — tighter screening recommended.
- Market conditions: 41 active listings in the ZIP; 33 comparable units currently listed for rent nearby; rentals at typical pace (median 24d on market — plan ~3-4 weeks tenant-placement turnaround); lower-income renter base — watch delinquency; 2,426 units permitted in Fresno County in 2024 (296 in 5+ unit buildings).
Forward outlook
- In year one you build about $22k of equity ($1k loan paydown + $21k appreciation (10.0% local appreciation)).
- Fresno County population projected at +11% by 2050 — modest demand growth; plan on rents tracking national, not racing it.
- At projected returns (10.0% appreciation + 3.0% rent growth), your $59k cash investment doubles in ~3 years — after that, you're playing with house money.
- By year 2, paydown + projected appreciation supports a ~$36k cash-out refi (75% LTV) — recoverable capital for the next deal without selling this one.
Negotiation context
- It's been on market 16 days — a 2% lower offer ($207k) is reasonable based on typical stale-listing flexibility.
- 3 sale attempts since 22y ago with the ask held roughly flat each time — persistent listings suggest the price (not the market) is what's stuck; bring a comps-based counter.
Risks & watch-outs
- Watch-outs: built in 1924 — expect roof / HVAC / electrical / plumbing capex.
- Climate carrying-cost: extreme-heat days projected 7→17/yr by 2055 (HVAC capex compounding) — expect insurance premiums to compound above CPI over the hold.
Questions for the listing agent
- Built in 1924 — when were the roof, HVAC, electrical panel, plumbing, and water heater last replaced?
- Is there a deadline driving the sale (1031 exchange, divorce, estate, relocation)? That informs how much negotiation room exists.
- Schools are D-rated, which usually means shorter tenancies and higher turnover. Who's the typical renter profile here, and what's been the actual vacancy rate?
- Crime grade is F in this area — have there been break-ins, vandalism, or insurance claims at this property in the last 3 years? What carrier currently insures it and at what premium?
- What's the average days-on-market for RENTAL listings here right now (not sales)? A rising rental-DOM trend means longer vacancies and softer asking-rent achievability than the comps imply.
- What's the recent tenant-quality profile in this submarket — average credit score on applications, eviction rate, late-payment / NSF rate, and stable-employment percentage? A property-management company in the area should have these aggregated.
- How much new for-sale + rental construction is in the pipeline within 1–3 miles? Heavy new supply typically softens prices + rents 12–24 months out; constrained supply supports both.
Investment metrics
- 1% rule
- 0.79% ✗
- Cap rate
- 6.65%
- Cash-on-cash
- 1.29%
- DSCR
- 1.06
- GRM
- 10.5
CMA / ARV
- ARV (on-the-fly)
- $304,444
- Comps found
- 12
Show comp detail 12 sales within ~0.75 mi
| Address | Dist | Beds/Ba | Sqft | Sold | Price | $/sf | Match |
|---|---|---|---|---|---|---|---|
| 705 Poplar | 0.31mi | 3/2.0 (+1) | 1,173 (+1%) | 10mo | $325,000 | $277 | 67 |
| 2119 N Cobbler Dr | 0.34mi | 3/2.5 (+1) | 1,227 (+6%) | 2mo | $390,300 | $318 | 62 |
| 385 N San Pablo Ave | 0.07mi | 3/1.8 (+1) | 1,299 (+12%) | 10mo | $250,000 | $192 | 60 |
| 704 N Roosevelt Ave | 0.57mi | 2/1.0 | 1,254 (+8%) | 0mo | $271,000 | $216 | 60 |
| 1234 N Del Mar Ave | 0.72mi | 3/1.0 (+1) | 1,188 (+2%) | 2mo | $315,000 | $265 | 56 |
| 930 N Roosevelt Ave | 0.67mi | 2/1.0 | 1,202 (+3%) | 8mo | $329,000 | $274 | 56 |
| 604 N Poplar Ave | 0.24mi | 3/1.5 (+1) | 989 (-15%) | 9mo | $287,900 | $291 | 49 |
| 750 E Elizabeth St | 0.57mi | 3/1.0 (+1) | 1,240 (+7%) | 10mo | $315,000 | $254 | 49 |
| 1019 N San Pablo Ave | 0.54mi | 3/2.0 (+1) | 1,296 (+12%) | 2mo | $340,000 | $262 | 45 |
| 1485 E Englewood Ave | 0.46mi | 2/1.0 | 990 (-15%) | 13mo | $257,000 | $260 | 43 |
| 1425 E Patterson Ave | 0.57mi | 2/2.0 | 1,323 (+14%) | 10mo | $235,000 | $178 | 38 |
| 1425 E Patterson Ave | 0.57mi | 2/2.0 | 1,323 (+14%) | 10mo | $235,000 | $178 | 38 |
Match score weights: distance 35% · size 25% · config 20% · recency 20%. Top-matched comps best support the ARV.
Projected returns pro-forma
10.0% appreciation · 3.0% rent growth · sell at horizon
- IRR
- 25.2%
- Equity multiple
- 3.01×
- Total profit
- $118,295
- Equity at exit
- $189,185
- IRR
- 22.2%
- Equity multiple
- 6.87×
- Total profit
- $344,999
- Equity at exit
- $407,984
Cash invested: $58,800 (down + closing). Projections, not guarantees.
Landlord ↔ Tenant lean methodology
- Overall (STATE)
- 18 Strongly Tenant-Friendly
- State California
- 18 Strongly Tenant-Friendly · D+13
- County
- — inherits STATE
- City
- — inherits STATE
ZIP-level market 93701
- Home prices YoY
- 6.4%
- Active inventory
- 41
- Price-to-rent
- 10.5×
Monthly cashflow live
- Estimated rent
- $1,661 high interval (Pro) →
- Mortgage (P&I)
- −$1,101
- Tax from tax record
- −$60 /mo · $719/yr
- Insurance
- −$88
- HOA
- −$0
- Vacancy / Maint / Mgmt
- −$349
- Net cashflow
- $63
Break-even live
UW: 25.0% down · 7.5% · 30yr · 1.5% tax · 5.0% vac · 8.0% maint · 8.0% mgmt
Financing live
Cash to close
- Down payment
- $52,500
- Closing costs
- $6,300
- Reserves months
- —
- Total cash needed
- —
Loan-product check · same deal, 3 products live
Conventional
25% down · 7.5% · 30yr
- Down + closing
- —
- Monthly P&I
- —
- Monthly cashflow
- —
- DSCR
- —
- Eligible?
- —
Personal DTI + credit; lowest rate.
DSCR
20% down · 8.5% · 30yr
- Down + closing
- —
- Monthly P&I
- —
- Monthly cashflow
- —
- DSCR
- —
- Eligible?
- —
No personal income docs; deal must DSCR.
Hard money
10% down · 12.0% · 12mo
- Down + closing
- —
- Monthly P&I
- —
- Monthly cashflow
- —
- DSCR
- —
- Eligible?
- —
Short-term bridge; refi at stabilization.
Rent comps 33 comps
| Address | Beds | Baths | Sqft | Rent | $/sqft | DOM | Units | Dist |
|---|---|---|---|---|---|---|---|---|
| 330 N Van Ness Ave #105 Fresno, CA | 3.0 | 2.5 | 1416 | $2,200 | $1.55 | 43d | 1 | 0.13mi |
| 330 N Van Ness Ave #112 Fresno, CA | 3.0 | 2.5 | 1416 | $2,095 | $1.48 | 43d | 1 | 0.13mi |
| 330 N Van Ness Ave #101 Fresno, CA | 3.0 | 2.5 | 1416 | $1,995 | $1.41 | 23d | 1 | 0.14mi |
| 109 N Glenn Ave Fresno, CA | 2.0 | 1.5 | 1100 | $1,050 | $0.95 | 1d | 1 | 0.29mi |
| 1759 Fulton St Fresno, CA | 2.0 | 1.0–2.5 | 882 | $1,900 | $2.15 | 1d | 1 | 0.49mi |
| 960 N Van Ness Ave Fresno, CA | 3.0 | 1.0 | 900 | $1,350 | $1.50 | 43d | 1 | 0.49mi |
| 2056 E White Ave Apt B Fresno, CA | 2.0 | 1.0 | 1050 | $1,250 | $1.19 | 43d | 1 | 0.61mi |
| 1404 E Olive Ave Fresno, CA | 1.0 | 1.0 | 824 | $1,395 | $1.69 | 43d | 1 | 0.66mi |
| 1230 N College Ave Unit 1232 Fresno, CA | 2.0 | 1.0 | 950 | $1,500 | $1.58 | 11d | 1 | 0.72mi |
| 1321 N Calaveras St Fresno, CA | 3.0 | 2.0 | 1300 | $2,200 | $1.69 | 3d | 1 | 0.85mi |
| 517 E Olive Ave Unit 517 Fresno, CA | 1.0 | 1.0 | 728 | $1,250 | $1.72 | 3d | 1 | 0.85mi |
| 915 N Harrison Ave Fresno, CA | 3.0 | 2.0 | 1198 | $1,800 | $1.50 | 43d | 1 | 0.95mi |
| 1060 Fulton St Fresno, CA | 1.0 | 1.0 | 1200 | $2,400 | $2.00 | 16d | 1 | 0.95mi |
| 1042 N Harrison Ave Unit A Fresno, CA | 3.0 | 1.0 | 1152 | $1,750 | $1.52 | 23d | 1 | 1.00mi |
| 2355 E Olive Ave Fresno, CA | 3.0 | 2.0 | 1265 | $2,250 | $1.78 | 23d | 1 | 1.01mi |
| 1348 N Wilson Ave Fresno, CA | 3.0 | 2.0 | 1350 | $2,325 | $1.72 | 23d | 1 | 1.03mi |
| 2881 Huntington Blvd #101 Fresno, CA | 1.0 | 1.0 | 860 | $1,295 | $1.51 | 11d | 1 | 1.08mi |
| 1532 N Calaveras St Fresno, CA | 2.0 | 2.0 | 848 | $1,800 | $2.12 | 21d | 1 | 1.10mi |
| 1249 N Harrison Ave Fresno, CA | 3.0 | 1.0 | 1200 | $1,750 | $1.46 | 43d | 1 | 1.11mi |
| 1540 B St Unit 206 Fresno, CA | 2.0 | 2.0 | 1000 | $1,500 | $1.50 | 43d | 1 | 1.13mi |
| 1540 B St Unit Advertising Unit Fresno, CA | 2.0 | 2.0 | 1000 | $1,650 | $1.65 | 43d | 1 | 1.13mi |
| 9 E Olive Ave Fresno, CA | 2.0 | 1.0 | 1000 | $1,800 | $1.80 | 3d | 1 | 1.15mi |
| 2995 E Nevada Ave Apt D Fresno, CA | 2.0 | 1.0 | 850 | $1,150 | $1.35 | 43d | 1 | 1.17mi |
| 814 E McKinley Ave Fresno, CA | 1.0 | 1.0 | 833 | $1,675 | $2.01 | 43d | 1 | 1.18mi |
| 812 E McKinley Ave Fresno, CA | 1.0 | 1.0 | 883 | $1,675 | $1.90 | 16d | 1 | 1.19mi |
| 119 E Amador St Apt 103 Fresno, CA | 2.0 | 1.0 | 800 | $1,395 | $1.74 | 16d | 1 | 1.20mi |
| 293 S Callisch Ave Unit 224-110F Fresno, CA | 1.0 | 1.0 | 780 | $1,095 | $1.40 | 11d | 1 | 1.24mi |
| 803 E Peralta Way Unit Main house Fresno, CA | 2.0 | 2.0 | 1000 | $2,500 | $2.50 | 23d | 1 | 1.28mi |
| 3033 E Platt Ave Fresno, CA | 2.0 | 1.0 | 975 | $1,016 | $1.04 | 1d | 1 | 1.30mi |
| 137 W Amador St Fresno, CA | 3.0 | 1.0 | 1264 | $1,600 | $1.27 | 3d | 1 | 1.36mi |
| 927 S Thorne Ave Fresno, CA | 2.0 | 1.0 | 700 | $1,280 | $1.83 | 3d | 1 | 1.39mi |
| 937 S Thorne Ave Fresno, CA | 2.0 | 1.0 | 700 | $1,280 | $1.83 | 23d | 1 | 1.39mi |
| 610 W Hammond Ave Unit 614 Fresno, CA | 2.0 | 1.0 | 750 | $1,295 | $1.73 | 1d | 1 | 1.48mi |
Listing history 24 events
-
2026-06-18days on market $210,000 Active 16 DOM
-
2026-06-17days on market $210,000 Active 15 DOM
-
2026-06-16days on market $210,000 Active 14 DOM
-
2026-06-15days on market $210,000 Active 13 DOM
-
2026-06-13statusdays on market $210,000 Active 11 DOM
-
2026-06-07statusdays on market $210,000 Pending 8 DOM
-
2026-06-05days on market $210,000 Active 7 DOM
-
2026-06-02days on market $210,000 Active 1 DOM
-
2026-06-01days on market $210,000 Active 4 DOM
-
2026-05-31days on market $210,000 Active 3 DOM
-
2026-05-28$210,000 Active
-
2026-03-24soldstatus $6,600,000
-
2009-10-21soldstatus $41,500 325-char remark
Show marketing remark (325 chars)
Everything is in place for this 3 bedroom 1 bath home to become the classic that it once was. Open floor plan, hardwood floors, formal dining, in-door laundry, double gate parking on the side. Move-in now, or put a little work in and make this jewel shine. Please note, tax records indicate 2 bedrooms 1 bath buyer to verify.
-
2009-10-02price $45,900 325-char remark
Show marketing remark (325 chars)
Everything is in place for this 3 bedroom 1 bath home to become the classic that it once was. Open floor plan, hardwood floors, formal dining, in-door laundry, double gate parking on the side. Move-in now, or put a little work in and make this jewel shine. Please note, tax records indicate 2 bedrooms 1 bath buyer to verify.
-
2009-10-02historical 325-char remark
Show marketing remark (325 chars)
Everything is in place for this 3 bedroom 1 bath home to become the classic that it once was. Open floor plan, hardwood floors, formal dining, in-door laundry, double gate parking on the side. Move-in now, or put a little work in and make this jewel shine. Please note, tax records indicate 2 bedrooms 1 bath buyer to verify.
-
2009-08-10$41,500 325-char remark
Show marketing remark (325 chars)
Everything is in place for this 3 bedroom 1 bath home to become the classic that it once was. Open floor plan, hardwood floors, formal dining, in-door laundry, double gate parking on the side. Move-in now, or put a little work in and make this jewel shine. Please note, tax records indicate 2 bedrooms 1 bath buyer to verify.
-
2004-08-02price $139,950 262-char remark
Show marketing remark (262 chars)
South Tower beauty! 3 bedroom, 1 1/4 bath, water closet (toilet only) off kitchen. Open design with high ceilings, living room, large kitchen and eating area. Inside laundry hook-ups. Updated bath and kitchen, new paint inside and out, newer carpet and flooring.
-
2004-07-30soldstatus $143,000 262-char remark
Show marketing remark (262 chars)
South Tower beauty! 3 bedroom, 1 1/4 bath, water closet (toilet only) off kitchen. Open design with high ceilings, living room, large kitchen and eating area. Inside laundry hook-ups. Updated bath and kitchen, new paint inside and out, newer carpet and flooring.
-
2004-07-30soldstatus $143,000
Show marketing remark (262 chars)
South Tower beauty! 3 bedroom, 1 1/4 bath, water closet (toilet only) off kitchen. Open design with high ceilings, living room, large kitchen and eating area. Inside laundry hook-ups. Updated bath and kitchen, new paint inside and out, newer carpet and flooring.
-
2004-06-18historical 262-char remark
Show marketing remark (262 chars)
South Tower beauty! 3 bedroom, 1 1/4 bath, water closet (toilet only) off kitchen. Open design with high ceilings, living room, large kitchen and eating area. Inside laundry hook-ups. Updated bath and kitchen, new paint inside and out, newer carpet and flooring.
-
2004-06-14$143,000 262-char remark
Show marketing remark (262 chars)
South Tower beauty! 3 bedroom, 1 1/4 bath, water closet (toilet only) off kitchen. Open design with high ceilings, living room, large kitchen and eating area. Inside laundry hook-ups. Updated bath and kitchen, new paint inside and out, newer carpet and flooring.
-
2003-10-08soldstatus $206,000
-
2002-06-11soldstatus $38,500
-
1993-09-16soldstatus $20,000
ⓘ Source: listings_history table (triggers on properties + properties_extension) + one-shot
backfill from property_details.listing_events for pre-trigger history.
Tax reassessment forecast CA · Resets to sale price
- Current annual tax
- $719 · $60/mo
- Projected year-2 tax
- $1,596 · $133/mo
- Expected delta
- +$877/yr (+$73/mo · 122.0%)
ⓘ Screening estimate from a state-policy table — verify with the county assessor before closing.
Climate risk First Street
- Flood 3/10 Moderate FEMA zone X (unshaded) · 9% chance over 30 yrs
- Wildfire 1/10 Low
- Heat 8/10 Severe 7 d/yr ≥105°F today · 17 d/yr by 30 yrs out
- Wind 1/10 Low
- Air quality 10/10 Extreme 40 unhealthy d/yr today · 44 by 30 yrs out
Nearby sold comps map
Loading sold comps map…
Walkable amenities ~0.75 mi
Loading nearby amenities…
Taxation est. · year 1
- Rental income
- $19,927
- − Mortgage interest
- −$11,763
- − Property taxes
- −$719
- − Insurance
- −$1,050
- − Repairs & maintenance
- −$1,594
- − Management
- −$1,594
- − Depreciation
- −$6,109
- Taxable loss
- −$2,903
- Est. tax savings @ 24.0%
- +$697
- After-tax cash flow
- $1,455/yr
For passive investors: Depreciation is non-cash, so a rental often shows a tax loss while cash-flowing — sheltering income. Rental losses are passive: they offset passive income freely, and up to $25,000/yr can offset ordinary (W-2) income if you actively participate and your MAGI is under $100k (phasing out to $0 by $150k); unused losses carry forward. On sale, claimed depreciation is recaptured at up to 25%, and gains may owe capital-gains tax (a 1031 exchange can defer both). Figures are a year-1 estimate at your 24.0% rate — not tax advice; consult a CPA.
Schools (NCES district)
- District
- Fresno Unified
- NCES district ID
- 0614550
- Math proficiency
- 18% ▼ -12.00%
- Reading proficiency
- 47% ▲ 9.00%
- Median HH income
- $36,095
- Composite
- 26.83/100
- National rank
- #7111
- State rank
- #327 of 517 in CA
Livability — Fresno
- Score
- 62/100
- State rank
- #469
- US rank
- #15907
Category grades
Schools grade is shown separately in the Schools card above.
Census & demographics
- Census place
- Fresno, CA
- County
- Fresno County · 834,801 people
- City population
- 593,114
- Metro
- Fresno, CA
- Population (ZIP)
- 9,808
- Household income
- $32,768
- Rent vs Own
- Severe rent burden
- 1072.0
Population outlook (Fresno County) Hauer SSP2
- Today (2025)
- 1,042,971 people
- By 2030
- 1,072,198 · +2.8%
- By 2040
- 1,122,408 · +7.6%
- By 2050
- 1,157,251 · +11.0%
- By 2075
- 1,182,575 · +13.4%
- By 2100
- 1,105,899 · +6.0%
Race, ethnicity, and origin ACS 2023
- Neighborhood character
- Predominantly Hispanic (77%)
- Race & ethnicity
- Hispanic / Latino 77% Two or more races 23% White 10% Black 6% Asian 4% Native American 3%
- Hispanic origin (detail)
- Mexican 75%
- Common ancestry
- Scotch-Irish 1% Italian 1%
- Foreign-born
- 32% · Canada
- Languages at home
- 33% English-only · Spanish 61% Other Asian/Pacific 3%
Political lean MEDSL · Fresno
- 2024 margin
- Toss-up / Even · D 46.5% · R 50.9% · Other 2.6%
- 2008→2024 swing
- -6.5pp toward R · 2008: 2.1pp · 2024: -4.4pp
- All cycles
- 2024: R+4.4 2020: D+7.8 2016: D+3.9 2012: R+2.9 2008: D+2.1
Not yet ingested
- Civics
- —
Market trends
- HPI YoY
- ▲ 27.24%
- Current HPI
- 452.1844
- Rent YoY
- —
- Metro
- Fresno, CA
- State GDP YoY
- ▲ 3.21%
- F500 in state
- 116
Industry mix (Fortune 500 HQ in CA)
| Industry | F500 HQs | Revenue |
|---|---|---|
| Technology | 27 | $1,492B |
|
||
| Financial Services | 3 | $174B |
|
||
| Retail | 3 | $44B |
|
||
| Insurance | 3 | $26B |
|
||
| Media / Entertainment | 2 | $115B |
|
||
| Pharmaceuticals / Biotech | 2 | $62B |
|
||
Price history
+950.0% since first listed14 events — show timeline
- 2026-05-28 Listed $210,000 FRESNOMLS
- 2026-03-24 Sold (Public Records) $6,600,000 Public Records
- 2009-10-21 Sold (MLS) $41,500 FRESNOMLS
- 2009-10-02 Delisted — FRESNOMLS
- 2009-10-02 Price Changed $45,900 FRESNOMLS
- 2009-08-10 Listed $41,500 FRESNOMLS
- 2004-08-02 Price Changed $139,950 FRESNOMLS
- 2004-07-30 Sold (Public Records) $143,000 Public Records
- 2004-07-30 Sold (MLS) $143,000 FRESNOMLS
- 2004-06-18 Delisted — FRESNOMLS
- 2004-06-14 Listed $143,000 FRESNOMLS
- 2003-10-08 Sold (Public Records) $206,000 Public Records
- 2002-06-11 Sold (Public Records) $38,500 Public Records
- 1993-09-16 Sold (Public Records) $20,000 Public Records
Property tax history
+2.3%/yrLatest (2025): $719 · +3.8% YoY. Source: county tax records.
Cash-flow waterfall
monthlySold comps — $/sqft
last 12 mo · ≤1 miLoading sold comps…