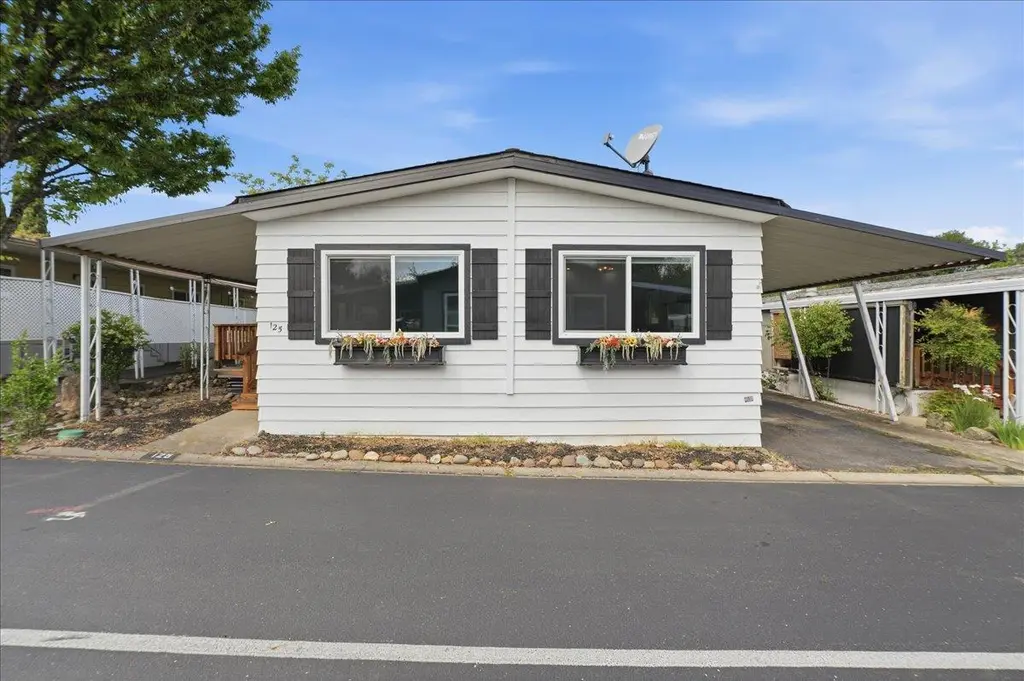
2681 Cameron Park Dr #125 · Cameron Park, CA
Flood risk 1/10 · Minimal
- FEMA flood zone
- X (unshaded)
- Chance of flooding over 30 yrs
- 0.0%
- Est. flood insurance / yr
- $507 – $1,088
Fire risk 10/10 · Severe
- Est. fire insurance / yr
- $659 – $1,223
Heat risk 6/10 · Moderate
- Hot days now (above 100°F)
- 7 days/yr
- Hot days in 30 yrs
- 15 days/yr
Wind risk 1/10 · Minimal
- Chance of severe wind over 30 yrs
- —
Air-quality risk 10/10 · Severe
- Unhealthy air days now
- 26 days/yr
- Unhealthy air days in 30 yrs
- 31 days/yr
Risk factors via First Street. Map © Google.
Why this score? — see what drove the C grade
The composite is a weighted blend of 9 inputs, each scored 0–100. Each bar is that input's sub-score; the figure is the points it added to the 100-point composite (weight × sub-score).
- Cash flow +23.0/30.0
- DSCR +7.4/10.0
- 1% rule +6.0/10.0
- Schools +6.0/10.0
- ARV discount +5.0/15.0
- Condition / age +4.0/5.0
- Rent growth +3.2/5.0
- Livability +2.8/5.0
- Appreciation +0.0/10.0
$199,000
🖨 Deal sheet 📄 Offer letter ✓ Due diligence
Listing remarks
Beautifully updated double wide home located in the desirable Cameron Park Mobile Home Estates 55+ community. This inviting residence features a built in electric fireplace, newer cabinetry, countertops, and appliances, creating a warm and modern living space. Offering approximately 1,440 sq ft, the home includes two spacious bedrooms, each with its own updated bathroom, perfect for comfort and privacy. The indoor laundry room adds convenience, while abundant storage throughout the home makes everyday living easy. Step outside to a lovely entry deck, ideal for relaxing or enjoying the peaceful surroundings. The large shed with a workbench provides excellent space for hobbies, projects, or a
Key facts
- Entry deck
- Indoor laundry room
- Parking
Tags
Property features AI
Finance
- Other: Land lease: No
- HOA & community: No homeowners association
Exterior
- Parking: Covered parking
- Utilities: Public water; Public sewer
- Home design: Manufactured in park; Double wide; Built in 1978; Located in a senior community
- Construction: Hillcrest make; Aluminum skirting
- Exterior features: Composition roof; Cul-de-sac setting
Interior
- Kitchen: Dishwasher; Free-standing electric range; Breakfast area; Slab countertops; Kitchen island
- Bedrooms: 2 bedrooms
- Flooring: Vinyl
- Bathrooms: 2 full bathrooms; Shower stall(s)
- Heating & cooling: Central heating; Central cooling
- Interior features: Vinyl flooring; Electric fireplace in the living room; Deck attached to the living room
- Laundry & utility: Laundry room inside; 220V outlet in laundry
Neighborhood map
What this means for you Summary
Snapshot
- This is a 2-bed/2.0-bath manufactured listed at $199k. Condition is rated good.
Deal economics
- At list price, monthly cash flow is $352 ($4k/yr) — positive.
- The deal already cash-flows at list — no discount required.
- Meets the 1% rule at list price ($2k rent vs $199k).
- Recommended offer: $193k (3.0% below list) — sets the bar for market timing.
- Cap rate 8.4% vs local median 2.7% in Cameron Park — top-decile yield for the area; either an underpriced asset or a hidden risk that comps aren't pricing in. Stress-test before assuming the spread holds.
Location & tenants
- Location reads 55/100 on livability (#832 in CA) — a working-class tenant base; expect higher turnover. Strengths: employment A+, housing B+; Watch: crime D+, amenities F, commute F.
- Rescue Union Elementary (suburban): math 61% / reading 69% proficiency, ranked #56 of 517 in CA (top 11%) — acceptable for families but not a draw, mixed tenant base, ~2y average lease; only 11% free/reduced lunch — higher-income household profile.
- Market conditions: Rents rising (+2.9%/yr); 236 active listings in the ZIP; 8 comparable units currently listed for rent nearby; rentals leasing fast (median 2d on market — plan ~1-2 weeks tenant-placement turnaround); high-income renter base; 437 units permitted in El Dorado County in 2024 (0 in 5+ unit buildings).
Forward outlook
- Local home prices are declining (-3.0%/yr); year-one equity from $1k of loan paydown is wiped out by about $6k of value loss. Plan a longer hold.
- El Dorado County population projected to shrink 3% by 2050 — rents likely to lag national; underwrite the cash flow, not the appreciation.
Negotiation context
- It's been on market 50 days — a 3% lower offer ($193k) is reasonable based on typical stale-listing flexibility.
Risks & watch-outs
- Climate carrying-cost: severe wildfire risk; extreme-heat days projected 7→15/yr by 2055 (HVAC capex compounding) — expect insurance premiums to compound above CPI over the hold.
Questions for the listing agent
- It's been on market 50 days. Have you received any prior offers? Is the seller open to a 3% concession, seller financing, or rate buy-down credit?
- Built in 1978 — when were the roof, HVAC, electrical panel, plumbing, and water heater last replaced?
- Is there a deadline driving the sale (1031 exchange, divorce, estate, relocation)? That informs how much negotiation room exists.
- Schools are B-rated — typically a magnet for longer-tenancy family renters. What's the average tenant stay here, and is there a school-zone premium baked into asking?
- Crime grade is D in this area — have there been break-ins, vandalism, or insurance claims at this property in the last 3 years? What carrier currently insures it and at what premium?
- What's the average days-on-market for RENTAL listings here right now (not sales)? A rising rental-DOM trend means longer vacancies and softer asking-rent achievability than the comps imply.
- What's the recent tenant-quality profile in this submarket — average credit score on applications, eviction rate, late-payment / NSF rate, and stable-employment percentage? A property-management company in the area should have these aggregated.
- How much new for-sale + rental construction is in the pipeline within 1–3 miles? Heavy new supply typically softens prices + rents 12–24 months out; constrained supply supports both.
Investment metrics
- 1% rule
- 1.10% ✓
- Cap rate
- 8.41%
- Cash-on-cash
- 7.58%
- DSCR
- 1.34
- GRM
- 7.6
CMA / ARV
- ARV (on-the-fly)
- $188,640
- Comps found
- 11
Show comp detail 11 sales within ~0.75 mi
| Address | Dist | Beds/Ba | Sqft | Sold | Price | $/sf | Match |
|---|---|---|---|---|---|---|---|
| 2681 Cameron Park Dr #91 | 0.07mi | 2/2.0 | 1,440 (0%) | 6mo | $207,500 | $144 | 92 |
| 2681 Cameron Park Dr #5 | 0.04mi | 2/2.0 | 1,440 (0%) | 15mo | $140,000 | $97 | 86 |
| 2681 Cameron Park Dr #107 | 0.05mi | 2/2.0 | 1,440 (0%) | 15mo | $285,000 | $198 | 85 |
| 2681 Cameron Park Dr #139 | 0.05mi | 2/2.0 | 1,440 (0%) | 16mo | $185,000 | $128 | 84 |
| 2681 Cameron Park Dr #155 | 0.07mi | 2/2.0 | 1,344 (-7%) | 4mo | $320,000 | $238 | 83 |
| 2681 Cameron Park Dr #21 | 0.07mi | 2/2.0 | 1,440 (0%) | 22mo | $250,000 | $174 | 79 |
| 2681 Cameron Park Dr #17 | 0.13mi | 2/2.0 | 1,440 (0%) | 19mo | $188,000 | $131 | 78 |
| 2681 Cameron Park Dr #64 | 0.11mi | 3/2.0 (+1) | 1,352 (-6%) | 9mo | $160,000 | $118 | 72 |
| 2681 Cameron Park Dr #37 | 0.16mi | 3/2.0 (+1) | 1,440 (0%) | 23mo | $160,000 | $111 | 69 |
| 2681 Cameron Park Dr #156 | 0.05mi | 3/2.0 (+1) | 1,610 (+12%) | 12mo | $270,000 | $168 | 63 |
| 2681 Cameron Park Dr #117 | 0.02mi | 2/2.0 | 1,648 (+14%) | 22mo | $205,000 | $124 | 56 |
Match score weights: distance 35% · size 25% · config 20% · recency 20%. Top-matched comps best support the ARV.
Projected returns pro-forma
-3.0% appreciation · 2.86% rent growth · sell at horizon
- IRR
- -4.9%
- Equity multiple
- 0.82×
- Total profit
- $-10,110
- Equity at exit
- $29,672
- IRR
- 4.7%
- Equity multiple
- 1.34×
- Total profit
- $18,930
- Equity at exit
- $17,206
Cash invested: $55,720 (down + closing). Projections, not guarantees.
Landlord ↔ Tenant lean methodology
- Overall (STATE)
- 18 Strongly Tenant-Friendly
- State California
- 18 Strongly Tenant-Friendly · D+13
- County
- — inherits STATE
- City
- — inherits STATE
ZIP-level market 95682
- Rents YoY
- 2.9%
- Active inventory
- 236
- Price-to-rent
- 7.6×
Monthly cashflow live
- Estimated rent
- $2,186 high interval (Pro) →
- Mortgage (P&I)
- −$1,044
- Tax est. 1.5%
- −$249 /mo · $2,985/yr
- Insurance
- −$83
- HOA
- −$0
- Vacancy / Maint / Mgmt
- −$459
- Net cashflow
- $352
Break-even live
UW: 25.0% down · 7.5% · 30yr · 1.5% tax · 5.0% vac · 8.0% maint · 8.0% mgmt
Financing live
Cash to close
- Down payment
- $49,750
- Closing costs
- $5,970
- Reserves months
- —
- Total cash needed
- —
Loan-product check · same deal, 3 products live
Conventional
25% down · 7.5% · 30yr
- Down + closing
- —
- Monthly P&I
- —
- Monthly cashflow
- —
- DSCR
- —
- Eligible?
- —
Personal DTI + credit; lowest rate.
DSCR
20% down · 8.5% · 30yr
- Down + closing
- —
- Monthly P&I
- —
- Monthly cashflow
- —
- DSCR
- —
- Eligible?
- —
No personal income docs; deal must DSCR.
Hard money
10% down · 12.0% · 12mo
- Down + closing
- —
- Monthly P&I
- —
- Monthly cashflow
- —
- DSCR
- —
- Eligible?
- —
Short-term bridge; refi at stabilization.
Rent comps 8 comps
| Address | Beds | Baths | Sqft | Rent | $/sqft | DOM | Units | Dist |
|---|---|---|---|---|---|---|---|---|
| 3397 Cimmarron Ct #4 Cameron Park, CA | 2.0 | 1.5 | 912 | $1,695 | $1.86 | 1d | 1 | 0.18mi |
| 2545 Chesapeake Bay Cir Cameron Park, CA | 3.0 | 2.5 | 1358 | $2,700 | $1.99 | 1d | 1 | 0.19mi |
| 2641 La Crescenta Dr Unit 02 Cameron Park, CA | 2.0 | 1.5 | 1150 | $1,950 | $1.70 | 1d | 1 | 0.26mi |
| 3337 La Canada Dr Unit 3339 A Cameron Park, CA | 2.0 | 1.5 | 875 | $1,925 | $2.20 | 7d | 1 | 0.28mi |
| 3261 La Canada Dr #1 Cameron Park, CA | 2.0 | 1.5 | 900 | $1,600 | $1.78 | 14d | 1 | 0.45mi |
| 2640 Cambridge Rd Cameron Park, CA | 2.0 | 2.0 | 966 | $2,432 | $2.52 | 1d | 6 | 0.58mi |
| 2361 Bass Lake Rd Apt 1221 Cameron Park, CA | 2.0 | 2.0 | 877 | $1,632 | $1.86 | 1d | 1 | 0.72mi |
| 3104 Cambridge Rd Unit 4C Cameron Park, CA | 2.0 | 2.0 | 1005 | $2,000 | $1.99 | 1d | 1 | 1.12mi |
Listing history 13 events
-
2026-06-18days on market $199,000 Active 50 DOM
-
2026-06-17days on market $199,000 Active 49 DOM
-
2026-06-16days on market $199,000 Active 48 DOM
-
2026-06-15days on market $199,000 Active 47 DOM
-
2026-06-13days on market $199,000 Active 45 DOM
-
2026-06-13days on market $199,000 Active 44 DOM
-
2026-06-09days on market $199,000 Active 41 DOM
-
2026-06-08days on market $199,000 Active 40 DOM
-
2026-06-07days on market $199,000 Active 39 DOM
-
2026-06-03days on market $199,000 Active 35 DOM
-
2026-06-02days on market $199,000 Active 34 DOM
-
2026-06-01days on market $199,000 Active 33 DOM
-
2026-05-31days on market $199,000 Active 32 DOM
ⓘ Source: listings_history table (triggers on properties + properties_extension) + one-shot
backfill from property_details.listing_events for pre-trigger history.
Climate risk First Street
- Flood 1/10 Low FEMA zone X (unshaded) · 0% chance over 30 yrs
- Wildfire 10/10 Extreme
- Heat 6/10 Major 7 d/yr ≥100°F today · 15 d/yr by 30 yrs out
- Wind 1/10 Low
- Air quality 10/10 Extreme 26 unhealthy d/yr today · 31 by 30 yrs out
Nearby sold comps map
Loading sold comps map…
Walkable amenities ~0.75 mi
Loading nearby amenities…
Taxation est. · year 1
- Rental income
- $26,235
- − Mortgage interest
- −$11,147
- − Property taxes
- −$2,985
- − Insurance
- −$995
- − Repairs & maintenance
- −$2,099
- − Management
- −$2,099
- − Depreciation
- −$5,789
- Taxable income
- $1,121
- Est. tax owed @ 24.0%
- −$269
- After-tax cash flow
- $3,953/yr
For passive investors: Depreciation is non-cash, so a rental often shows a tax loss while cash-flowing — sheltering income. Rental losses are passive: they offset passive income freely, and up to $25,000/yr can offset ordinary (W-2) income if you actively participate and your MAGI is under $100k (phasing out to $0 by $150k); unused losses carry forward. On sale, claimed depreciation is recaptured at up to 25%, and gains may owe capital-gains tax (a 1031 exchange can defer both). Figures are a year-1 estimate at your 24.0% rate — not tax advice; consult a CPA.
Condition & rehab AI · 12 photos
This beautifully updated double-wide home in a desirable community offers a good condition with minimal repairs needed. It's move-in ready with a good ROI potential for both resale and rental.
Value-add opportunities
- Both landscaping — enhances curb appeal and adds value
- Both exterior paint — refreshes the home's appearance
- Both roof inspection — ensures durability and longevity
Renovation cost estimate screening
Value-add ROI direction
- Both landscaping — enhances curb appeal and adds value ↑
- Both exterior paint — refreshes the home's appearance ↑
- Both roof inspection — ensures durability and longevity ↑
ⓘ Cost ranges are severity-bucket heuristics (US national rule-of-thumb). Get contractor quotes + a written scope before underwriting a rehab budget.
Schools (NCES district)
- District
- Rescue Union Elementary
- NCES district ID
- 0632310
- Math proficiency
- 61% ▼ -4.00%
- Reading proficiency
- 69% ▼ -5.00%
- Median HH income
- $98,351
- Composite
- 59.82/100
- National rank
- #895
- State rank
- #56 of 517 in CA
Livability — Cameron Park
- Score
- 55/100
- State rank
- #832
- US rank
- #23166
Category grades
Schools grade is shown separately in the Schools card above.
Census & demographics
- Census place
- Cameron Park, CA
- County
- El Dorado County · 144,198 people
- Metro
- Sacramento-Roseville-Folsom, CA
- Population (ZIP)
- 30,065
- Household income
- $122,436
- Rent vs Own
- Severe rent burden
- 634.0
Population outlook (El Dorado County) Hauer SSP2
- Today (2025)
- 191,666 people
- By 2030
- 193,662 · +1.0%
- By 2040
- 192,583 · +0.5%
- By 2050
- 185,904 · -3.0%
- By 2075
- 169,543 · -11.5%
- By 2100
- 139,623 · -27.2%
Race, ethnicity, and origin ACS 2023
- Neighborhood character
- Predominantly White (80%)
- Race & ethnicity
- White 80% Hispanic / Latino 13% Two or more races 8% Asian 2%
- Hispanic origin (detail)
- Mexican 9%
- Common ancestry
- Lithuanian 3% Portuguese 3% Italian 3%
- Foreign-born
- 5% · Canada, China
- Languages at home
- 93% English-only · Spanish 3% German/W. Germanic 1% Chinese 1%
Political lean MEDSL · El Dorado
- 2024 margin
- R (+12.0) · D 42.6% · R 54.6% · Other 2.8%
- 2008→2024 swing
- -1.5pp toward R · 2008: -10.5pp · 2024: -12.0pp
- All cycles
- 2024: R+12.0 2020: R+8.8 2016: R+13.9 2012: R+18.2 2008: R+10.5
Not yet ingested
- Civics
- —
Market trends
- HPI YoY
- ▼ -417.68%
- Current HPI
- 279.3817
- Rent YoY
- ▲ 2.86%
- Metro
- Sacramento-Roseville-Folsom, CA
- State GDP YoY
- ▲ 3.21%
- F500 in state
- 116
Industry mix (Fortune 500 HQ in CA)
| Industry | F500 HQs | Revenue |
|---|---|---|
| Technology | 27 | $1,492B |
|
||
| Financial Services | 3 | $174B |
|
||
| Retail | 3 | $44B |
|
||
| Insurance | 3 | $26B |
|
||
| Media / Entertainment | 2 | $115B |
|
||
| Pharmaceuticals / Biotech | 2 | $62B |
|
||
Cash-flow waterfall
monthlySold comps — $/sqft
last 12 mo · ≤1 miLoading sold comps…