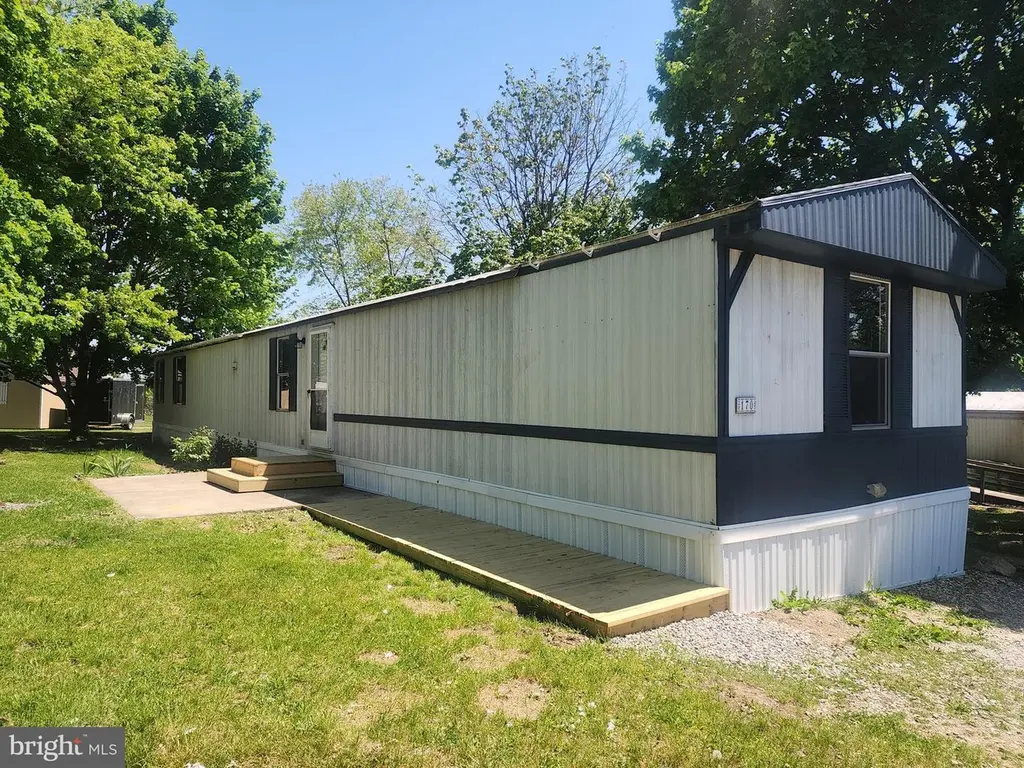
17 Mountain View Ter · Upper Frankford, PA
Flood risk 8/10 · Major
- FEMA flood zone
- X (unshaded)
- Chance of flooding over 30 yrs
- 0.99%
- Est. flood insurance / yr
- $507 – $1,088
Fire risk 1/10 · Minimal
- Est. fire insurance / yr
- $511 – $949
Heat risk 5/10 · Moderate
- Hot days now (above 101°F)
- 7 days/yr
- Hot days in 30 yrs
- 15 days/yr
Wind risk 2/10 · Minimal
- Chance of severe wind over 30 yrs
- 3.0%
Air-quality risk 2/10 · Minimal
- Unhealthy air days now
- 1 days/yr
- Unhealthy air days in 30 yrs
- 1 days/yr
Risk factors via First Street. Map © Google.
Why this score? — see what drove the B- grade
The composite is a weighted blend of 9 inputs, each scored 0–100. Each bar is that input's sub-score; the figure is the points it added to the 100-point composite (weight × sub-score).
- Cash flow +30.0/30.0
- 1% rule +10.0/10.0
- DSCR +10.0/10.0
- ARV discount +7.5/15.0
- Schools +4.4/10.0
- Rent growth +2.5/5.0
- Livability +2.5/5.0
- Condition / age +2.5/5.0
- Appreciation +0.0/10.0
$65,000
🖨 Deal sheet 📄 Offer letter ✓ Due diligence
Listing remarks
Looking for affordable living in the peaceful countryside? This clean and refreshed single wide home offers an open concept living, dining and kitchen area featuring a breakfast bar and new vinyl flooring. The kitchen includes a double-basin sink, industrial-style faucet, refrigerator, electric range/oven and dishwasher. There's a convenient pantry and laundry closet off the kitchen. The primary bedroom features a walk-in closet and full bath with walk-in shower, soaking tub and dual sink vanity. Two more bedrooms and a full bath on the other end of the house completes the floor plan. Shade trees provide a relaxing atmosphere, and there's a front patio with new steps and deck walkway lead
Key facts
- Double basin sink
- Laundry closet
- Convenient pantry
Tags
Property features AI
Finance
- Other: Property manager present; Improvement assessed value listed (estimated)
- Financial info: Ownership is ground rent; Ground rent amount $385 monthly; Lease not considered
Exterior
- Parking: Gravel driveway; Driveway parking with 2 spaces (plus 2 driveway spaces noted)
- Utilities: Propane (leased) for heating; Electric hot water; Community water; Community septic tank
- Home design: Manufactured single-wide home; One level; Oakwood make; Estimated year built
- Construction: Modular/Manufactured construction; Structure type: Manufactured; Other structures listed above and below grade; Mobile home dimensions approximately 14 ft wide by 70 ft long
- Exterior features: Not in a federal flood zone; Community water; Community septic tank; Ground rent paid monthly ($385); Pets allowed with number and size/weight limits
Interior
- Bedrooms: Three bedrooms on the main level
- Bathrooms: Two full bathrooms on the main level
- Heating & cooling: Forced air heating; Propane (leased) fuel; Electric hot water
- Interior features: Estimated living area; No basement
Neighborhood map
What this means for you Summary
Snapshot
- This is a 2-bed/1.0-bath manufactured listed at $65k.
Deal economics
- At list price, monthly cash flow is $665 ($8k/yr) — positive.
- The deal already cash-flows at list — no discount required.
- Meets the 1% rule at list price ($1k rent vs $65k).
- Recommended offer: $64k (1.5% below list) — sets the bar for market timing.
Location & tenants
- Location reads: area grade B — affects rentability + tenant quality, not the cash-flow math above.
- Big Spring SD (rural): math 39% / reading 62% proficiency, ranked #162 of 539 in PA (top 30%) — acceptable for families but not a draw, mixed tenant base, ~2y average lease.
- Zoned schools: Big Spring Ms (math 21% / reading 59%, grade F, #257 of 512 statewide, top 52%, 593 students, 44% FRL); Big Spring Hs (math 57% / reading 24%, grade F, #255 of 437 statewide, top 60%, 739 students, 33% FRL).
- Market conditions: 45 active listings in the ZIP; 1,052 units permitted in Cumberland County in 2024 (310 in 5+ unit buildings).
Forward outlook
- Local home prices are declining (-3.0%/yr); year-one equity from $449 of loan paydown is wiped out by about $2k of value loss. Plan a longer hold.
- Cumberland County population projected at +17% by 2050 — long-run rental-demand tailwind backs the buy-and-hold thesis.
- At projected returns (-3.0% appreciation + 3.0% rent growth), your $18k cash investment doubles in ~3 years — after that, you're playing with house money.
Negotiation context
- It's been on market 21 days — a 2% lower offer ($64k) is reasonable based on typical stale-listing flexibility.
Risks & watch-outs
- Watch-outs: flood insurance adds $66/mo.
- Climate carrying-cost: severe flood risk; extreme-heat days projected 7→15/yr by 2055 (HVAC capex compounding) — expect insurance premiums to compound above CPI over the hold.
Questions for the listing agent
- What's the actual annual flood-insurance premium (NFIP or private), and is the property in a SFHA with mandatory coverage?
- Is there a deadline driving the sale (1031 exchange, divorce, estate, relocation)? That informs how much negotiation room exists.
- What's the average days-on-market for RENTAL listings here right now (not sales)? A rising rental-DOM trend means longer vacancies and softer asking-rent achievability than the comps imply.
- What's the recent tenant-quality profile in this submarket — average credit score on applications, eviction rate, late-payment / NSF rate, and stable-employment percentage? A property-management company in the area should have these aggregated.
- How much new for-sale + rental construction is in the pipeline within 1–3 miles? Heavy new supply typically softens prices + rents 12–24 months out; constrained supply supports both.
Investment metrics
- 1% rule
- 2.17% ✓
- Cap rate
- 19.80%
- Cash-on-cash
- 48.23%
- DSCR
- 3.15
- GRM
- 3.8
CMA / ARV
- ARV (median comp)
- $29,058
- List price
- $65,000
- Delta
- 123.69%
- Verdict
- OVERPRICED
- Comps
- 3 within 1.0 mi
Projected returns pro-forma
-3.0% appreciation · 3.0% rent growth · sell at horizon
- IRR
- 40.8%
- Equity multiple
- 2.75×
- Total profit
- $31,842
- Equity at exit
- $9,692
- IRR
- 47.0%
- Equity multiple
- 5.52×
- Total profit
- $82,352
- Equity at exit
- $5,620
Cash invested: $18,200 (down + closing). Projections, not guarantees.
Landlord ↔ Tenant lean methodology
- Overall (STATE)
- 62 Landlord-Friendly
- State Pennsylvania
- 62 Landlord-Friendly · EVEN
- County
- — inherits STATE
- City
- — inherits STATE
ZIP-level market 17241
- Home prices YoY
- -10.3%
- Active inventory
- 45
- Price-to-rent
- 3.8×
Monthly cashflow live
- Estimated rent
- $1,412 medium interval (Pro) →
- Mortgage (P&I)
- −$341
- Tax from tax record
- −$16 /mo · $193/yr
- Insurance
- −$27
- Flood insurance flood zone
- −$66 /mo · $798/yr
- HOA
- −$0
- Vacancy / Maint / Mgmt
- −$297
- Net cashflow
- $665
Break-even live
UW: 25.0% down · 7.5% · 30yr · 1.5% tax · 5.0% vac · 8.0% maint · 8.0% mgmt
Financing live
Cash to close
- Down payment
- $16,250
- Closing costs
- $1,950
- Reserves months
- —
- Total cash needed
- —
Loan-product check · same deal, 3 products live
Conventional
25% down · 7.5% · 30yr
- Down + closing
- —
- Monthly P&I
- —
- Monthly cashflow
- —
- DSCR
- —
- Eligible?
- —
Personal DTI + credit; lowest rate.
DSCR
20% down · 8.5% · 30yr
- Down + closing
- —
- Monthly P&I
- —
- Monthly cashflow
- —
- DSCR
- —
- Eligible?
- —
No personal income docs; deal must DSCR.
Hard money
10% down · 12.0% · 12mo
- Down + closing
- —
- Monthly P&I
- —
- Monthly cashflow
- —
- DSCR
- —
- Eligible?
- —
Short-term bridge; refi at stabilization.
Listing history 2 events
-
2026-05-31status $65,000 Pending 21 DOM
-
2026-05-08$65,000 Active 982-char remark
ⓘ Source: listings_history table (triggers on properties + properties_extension) + one-shot
backfill from property_details.listing_events for pre-trigger history.
Tax reassessment forecast PA · Partial reset (capped growth)
- Current annual tax
- $193 · $16/mo
- Projected year-2 tax
- $610 · $51/mo
- Expected delta
- +$417/yr (+$35/mo · 215.7%)
ⓘ Screening estimate from a state-policy table — verify with the county assessor before closing.
Climate risk First Street
- Flood 8/10 Severe FEMA zone X (unshaded) · 99% chance over 30 yrs
- Wildfire 1/10 Low
- Heat 5/10 Major 7 d/yr ≥101°F today · 15 d/yr by 30 yrs out
- Wind 2/10 Low 3% chance of damaging wind over 30 yrs
- Air quality 2/10 Low 1 unhealthy d/yr today · 1 by 30 yrs out
Nearby sold comps map
Loading sold comps map…
Walkable amenities ~0.75 mi
Loading nearby amenities…
Taxation est. · year 1
- Rental income
- $16,944
- − Mortgage interest
- −$3,641
- − Property taxes
- −$193
- − Insurance
- −$1,122
- − Repairs & maintenance
- −$1,356
- − Management
- −$1,356
- − Depreciation
- −$1,891
- Taxable income
- $7,385
- Est. tax owed @ 24.0%
- −$1,772
- After-tax cash flow
- $6,207/yr
For passive investors: Depreciation is non-cash, so a rental often shows a tax loss while cash-flowing — sheltering income. Rental losses are passive: they offset passive income freely, and up to $25,000/yr can offset ordinary (W-2) income if you actively participate and your MAGI is under $100k (phasing out to $0 by $150k); unused losses carry forward. On sale, claimed depreciation is recaptured at up to 25%, and gains may owe capital-gains tax (a 1031 exchange can defer both). Figures are a year-1 estimate at your 24.0% rate — not tax advice; consult a CPA.
Schools (NCES district)
- District
- Big Spring SD
- NCES district ID
- 4203660
- Math proficiency
- 39% ▼ -12.00%
- Reading proficiency
- 62% ▼ -6.00%
- Median HH income
- $56,941
- Composite
- 43.77/100
- National rank
- #2942
- State rank
- #162 of 539 in PA
Livability — Upper Frankford
No livability data for this city. (Only ~50 U.S. cities are tracked.)
Census & demographics
- Population (ZIP)
- 11,094
Population outlook (Cumberland County) Hauer SSP2
- Today (2025)
- 267,950 people
- By 2030
- 278,105 · +3.8%
- By 2040
- 296,552 · +10.7%
- By 2050
- 312,937 · +16.8%
- By 2075
- 349,233 · +30.3%
- By 2100
- 361,875 · +35.1%
Race, ethnicity, and origin ACS 2023
- Neighborhood character
- Predominantly White (94%)
- Race & ethnicity
- White 94% Two or more races 3% Hispanic / Latino 2%
- Common ancestry
- Slovak 2% Romanian 2% Iranian 1%
- Foreign-born
- 1%
- Languages at home
- 95% English-only · German/W. Germanic 4% Spanish 1%
Political lean MEDSL · Cumberland
- 2024 margin
- Lean R (+9.4) · D 44.6% · R 54.1% · Other 1.3%
- 2008→2024 swing
- +4.2pp toward D · 2008: -13.6pp · 2024: -9.4pp
- All cycles
- 2024: R+9.4 2020: R+10.6 2016: R+18.6 2012: R+18.5 2008: R+13.6
Not yet ingested
- Civics
- —
Market trends
- HPI YoY
- ▼ -32.92%
- Current HPI
- 285.3994
- Rent YoY
- —
- Metro
- —
- State GDP YoY
- ▲ 1.68%
- F500 in state
- 34
Industry mix (Fortune 500 HQ in PA)
| Industry | F500 HQs | Revenue |
|---|---|---|
| Healthcare | 2 | $309B |
|
||
| Insurance | 2 | $27B |
|
||
| Telecommunications / Media | 1 | $124B |
|
||
| Industrial Distribution | 1 | $22B |
|
||
| Financial Services | 1 | $20B |
|
||
| Chemicals / Materials | 1 | $18B |
|
||
Price history
2 events — show timeline
- 2026-05-29 Pending — BRIGHT MLS
- 2026-05-08 Listed $65,000 BRIGHT MLS
Property tax history
+2.1%/yrLatest (2026): $193 · +0.8% YoY. Source: county tax records.
Cash-flow waterfall
monthlySold comps — $/sqft
last 12 mo · ≤1 miLoading sold comps…