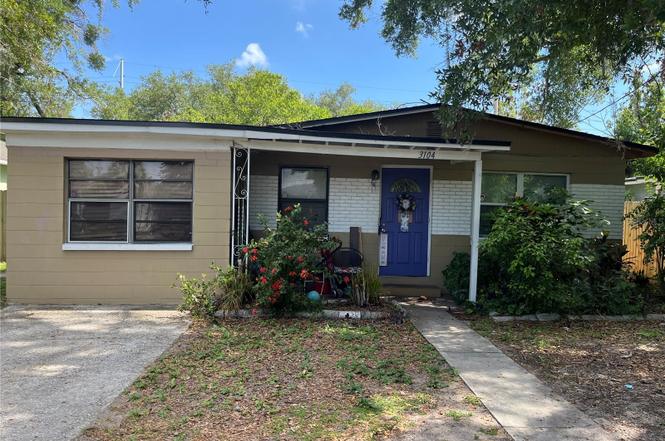
3104 E Chelsea St · Tampa, FL
Flood risk 4/10 · Minor
- FEMA flood zone
- X (unshaded)
- Chance of flooding over 30 yrs
- 0.2%
- Est. flood insurance / yr
- $507 – $1,088
Fire risk 1/10 · Minimal
- Est. fire insurance / yr
- $947 – $1,759
Heat risk 10/10 · Severe
- Hot days now (above 109°F)
- 7 days/yr
- Hot days in 30 yrs
- 26 days/yr
Wind risk 9/10 · Severe
- Chance of severe wind over 30 yrs
- 99.0%
Air-quality risk 3/10 · Minor
- Unhealthy air days now
- 3 days/yr
- Unhealthy air days in 30 yrs
- 4 days/yr
Risk factors via First Street. Map © Google.
Why this score? — see what drove the D grade
The composite is a weighted blend of 9 inputs, each scored 0–100. Each bar is that input's sub-score; the figure is the points it added to the 100-point composite (weight × sub-score).
- Cash flow +16.0/30.0
- ARV discount +7.5/15.0
- DSCR +4.9/10.0
- Schools +4.2/10.0
- Livability +4.0/5.0
- 1% rule +3.6/10.0
- Condition / age +2.5/5.0
- Rent growth +1.3/5.0
- Appreciation +0.0/10.0
$260,000
🖨 Deal sheet (PDF) 📄 Offer letter ✓ Due diligence
Listing remarks MLS
NOT a Short Sale, NOT a bank owned property. Can Close IMMEDIATELY!!! This is a 3 bedroom, 2 bath home in Tampa! With over 1000 sqft of living space, it has a nice kitchen and plenty of room for storage along with appliances. It has earth tone tile flooring in the main area and brand new carpet in bedrooms. Nice fenced in yard just perfect for pets. Great starter home with amazing potential here!! Centrally located just off of E Dr. MLK jr Blvd and N 34th St. Easy access to I-4, Ybor City, Downtown Tampa and more!!
Key facts
- 4,512 sq ft lot
- Built 1961
- Listed 5 days
Property features AI
Finance
- Other: Residential property zoned RS-50; Living area approximately 1,054 sq ft (building area 1,179 sq ft)
- Financial info: Homestead exemption claimed
- HOA & community: No HOA reported
Exterior
- Parking: No parking details provided
- Security: No security features reported
- Utilities: Public sewer; Water available; Water source not specified
- Home design: Single family residence; One story; South-facing entry
- Construction: Block construction; Shingle roof; Slab foundation; Built on a 0.1-acre lot (approx. 48 x 94)
- Exterior features: Asphalt road access
Interior
- Kitchen: No appliances reported
- Bedrooms: 3 bedrooms
- Flooring: Carpet; Ceramic tile
- Bathrooms: 2 full bathrooms
- Heating & cooling: Central heating; Central air conditioning
- Interior features: No interior features reported
- Laundry & utility: No laundry facilities reported
Neighborhood map
What this means for you Summary
Snapshot
- This is a 3-bed/2.0-bath single-family listed at $260k.
Deal economics
- At list price, monthly cash flow is $128 ($2k/yr) — positive.
- The deal already cash-flows at list — no discount required.
- To meet the 1% rule (rent ≥ 1% of price), the offer needs to be $225k (13.6% below list).
- Recommended offer: $225k (13.6% below list) — sets the bar for 1% rule.
Location & tenants
- Location reads 79/100 on livability (#142 in FL, #2,135 nationally) — a middle-class / working-renter tenant base. Strengths: commute A+, housing A+, health & safety A+; Watch: crime D+.
- Hillsborough (suburban): math 47% / reading 50% proficiency, ranked #41 of 73 in FL (top 56%) — families likely to look elsewhere, expect single-tenant / working-renter base with shorter leases.
- Zoned schools: Potter Elementary School (math 32% / reading 22%, grade F, #1,969 of 2,144 statewide, top 94%, 472 students, 89% FRL); Mclane Middle School (math 20% / reading 20%, grade F, #558 of 571 statewide, top 98%, 817 students, 74% FRL); Middleton High School (math 23% / reading 51%, grade F, #340 of 667 statewide, top 52%, 1,511 students, 57% FRL) — zoned schools average 74% FRL vs 52% district-wide (22 pts higher); higher-poverty schools than district average — tighter screening recommended.
- Zoned-school proficiency averages 28% at this address vs 48% district-wide (-20 pts) — the specific schools serving this property underperform the Hillsborough average; the district grade overstates school quality for this exact location.
- Market conditions: Rents falling (-4.7%/yr); 282 active listings in the ZIP; 40 comparable units currently listed for rent nearby; rentals at typical pace (median 22d on market — plan ~3-4 weeks tenant-placement turnaround); 9,053 units permitted in Hillsborough County in 2024 (4,555 in 5+ unit buildings).
- At $2,246/mo this rent would consume 50% of the median local household income ($54k/yr) (locally 2431% of renters already pay >50% of income on rent) — very limited rent-growth headroom before tenants either downsize or default.
Forward outlook
- Local home prices are declining (-3.0%/yr); year-one equity from $2k of loan paydown is wiped out by about $8k of value loss. Plan a longer hold.
- Hillsborough County population projected at +37% by 2050 — long-run rental-demand tailwind backs the buy-and-hold thesis.
Negotiation context
- Only 5 days on market — expect competitive offers; lowballing is unlikely to land.
- 2 sale attempts since 8y ago with the ask held roughly flat each time — persistent listings suggest the price (not the market) is what's stuck; bring a comps-based counter.
- Current owner paid $129k; list at $260k implies a 102% gain — meaningful room to come down on a strong offer.
Risks & watch-outs
- Climate carrying-cost: severe wind risk, 99% chance of damaging wind over 30y; extreme-heat days projected 7→26/yr by 2055 (HVAC capex compounding) — expect insurance premiums to compound above CPI over the hold.
Questions for the listing agent
- Built in 1961 — when were the roof, HVAC, electrical panel, plumbing, and water heater last replaced?
- Is there a deadline driving the sale (1031 exchange, divorce, estate, relocation)? That informs how much negotiation room exists.
- Crime grade is D in this area — have there been break-ins, vandalism, or insurance claims at this property in the last 3 years? What carrier currently insures it and at what premium?
- The area grade is low — what's the realistic commute time and amenity access for the typical tenant pool here? Any planned neighborhood developments (good or bad) we should know about?
- What's the average days-on-market for RENTAL listings here right now (not sales)? A rising rental-DOM trend means longer vacancies and softer asking-rent achievability than the comps imply.
- What's the recent tenant-quality profile in this submarket — average credit score on applications, eviction rate, late-payment / NSF rate, and stable-employment percentage? A property-management company in the area should have these aggregated.
- How much new for-sale + rental construction is in the pipeline within 1–3 miles? Heavy new supply typically softens prices + rents 12–24 months out; constrained supply supports both.
Investment metrics
- 1% rule
- 0.86% ✗
- Cap rate
- 6.89%
- Cash-on-cash
- 2.12%
- DSCR
- 1.09
- GRM
- 9.6
CMA / ARV
No comps found within radius.
Projected returns pro-forma
-3.0% appreciation · 0.0% rent growth · sell at horizon
- IRR
- -16.1%
- Equity multiple
- 0.44×
- Total profit
- $-40,588
- Equity at exit
- $38,767
- IRR
- -13.7%
- Equity multiple
- 0.31×
- Total profit
- $-50,478
- Equity at exit
- $22,480
Cash invested: $72,800 (down + closing). Projections, not guarantees.
Landlord ↔ Tenant lean methodology
- Overall (STATE)
- 87 Strongly Landlord-Friendly
- State Florida
- 87 Strongly Landlord-Friendly · R+3
- County
- — inherits STATE
- City
- — inherits STATE
ZIP-level market 33610
- Home prices YoY
- -27.0%
- Rents YoY
- -4.7%
- Active inventory
- 282
- Price-to-rent
- 9.6×
Monthly cashflow live
- Estimated rent
- $2,246 high interval (Pro) →
- Mortgage (P&I)
- −$1,363
- Tax from tax record
- −$174 /mo · $2,084/yr
- Insurance
- −$108
- HOA
- −$0
- Vacancy / Maint / Mgmt
- −$472
- Net cashflow
- $128
Break-even live
Sensitivity live
| Price | -10% $276 | -5% $202 | +0% $128 | +5% $55 | +10% $-19 |
|---|---|---|---|---|---|
| Rent | -10% $-49 | -5% $40 | +0% $128 | +5% $217 | +10% $306 |
| Rate | -1.0pp $259 | -0.5pp $195 | base $128 | +0.5pp $61 | +1.0pp $-7 |
UW: 25.0% down · 7.5% · 30yr · 1.5% tax · 5.0% vac · 8.0% maint · 8.0% mgmt
Financing live
Cash to close
- Down payment
- $65,000
- Closing costs
- $7,800
- Reserves months
- —
- Total cash needed
- —
Loan-product check · same deal, 3 products live
Conventional
25% down · 7.5% · 30yr
- Down + closing
- —
- Monthly P&I
- —
- Monthly cashflow
- —
- DSCR
- —
- Eligible?
- —
Personal DTI + credit; lowest rate.
DSCR
20% down · 8.5% · 30yr
- Down + closing
- —
- Monthly P&I
- —
- Monthly cashflow
- —
- DSCR
- —
- Eligible?
- —
No personal income docs; deal must DSCR.
Hard money
10% down · 12.0% · 12mo
- Down + closing
- —
- Monthly P&I
- —
- Monthly cashflow
- —
- DSCR
- —
- Eligible?
- —
Short-term bridge; refi at stabilization.
Rent comps 40 comps
| Address | Beds | Baths | Sqft | Rent | $/sqft | DOM | Units | Dist |
|---|---|---|---|---|---|---|---|---|
| 4303 N 30th St Tampa, FL | 3.0 | 2.0 | 1260 | $3,200 | $2.54 | 3d | 1 | 0.08mi |
| 3111 E Cayuga St Tampa, FL | 4.0 | 2.0 | 1315 | $2,250 | $1.71 | 26d | 1 | 0.09mi |
| 3002 E 38th Ave Tampa, FL | 3.0 | 2.0 | 1413 | $2,600 | $1.84 | 26d | 1 | 0.11mi |
| 3212 E Emma St Tampa, FL | 4.0 | 2.0 | 1332 | $2,300 | $1.73 | 5d | 1 | 0.12mi |
| 4204 N 29th St Tampa, FL | 3.0 | 1.0 | 957 | $1,800 | $1.88 | 26d | 1 | 0.24mi |
| 3716 N 31st St Tampa, FL | 3.0 | 2.0 | 1200 | $1,895 | $1.58 | 6d | 1 | 0.39mi |
| 3413 E Louisiana Ave #2 Tampa, FL | 3.0 | 2.5 | 1489 | $2,500 | $1.68 | 26d | 1 | 0.39mi |
| 3705 E North Bay St Tampa, FL | 3.0 | 2.0 | 969 | $1,850 | $1.91 | 5d | 1 | 0.47mi |
| 2607 Lindell Ave Tampa, FL | 4.0 | 2.0 | 1448 | $2,395 | $1.65 | 4d | 1 | 0.47mi |
| 3724 E 38th Ave Tampa, FL | 3.0 | 2.0 | 1188 | $1,895 | $1.60 | 26d | 1 | 0.51mi |
| 2402 E Doctor Martin Luther King Junior Blvd Tampa, FL | 2.0 | 1.0 | 710 | $1,699 | $2.39 | 26d | 1 | 0.51mi |
| 3001 E McBerry St Tampa, FL | 3.0 | 2.0 | 1118 | $1,945 | $1.74 | 6d | 1 | 0.55mi |
| 4501 N 39th St Tampa, FL | 4.0 | 1.0 | 1072 | $1,595 | $1.49 | 23d | 1 | 0.55mi |
| 3205 E Shadowlawn Ave Tampa, FL | 4.0 | 2.0 | 1293 | $2,550 | $1.97 | 1d | 1 | 0.60mi |
| 3507 E 29th Ave Tampa, FL | 3.0 | 2.0 | 928 | $1,700 | $1.83 | 26d | 1 | 0.65mi |
| 3107 Chipco St Tampa, FL | 3.0 | 1.0 | 1268 | $1,799 | $1.42 | 26d | 1 | 0.66mi |
| 3910 E Ellicott St Tampa, FL | 2.0 | 1.0 | 950 | $1,800 | $1.89 | 26d | 1 | 0.71mi |
| 3706 E Shadowlawn Ave Tampa, FL | 3.0 | 1.0 | 1080 | $1,950 | $1.81 | 12d | 1 | 0.77mi |
| 4506 N 42nd St Tampa, FL | 3.0 | 1.5 | 792 | $1,900 | $2.40 | 1d | 1 | 0.77mi |
| 2704 E 25th Ave Tampa, FL | 3.0 | 1.0 | 858 | $1,595 | $1.86 | 23d | 1 | 0.83mi |
| 1709 E Chelsea St Unit F Tampa, FL | 2.0 | 1.0 | 1041 | $1,625 | $1.56 | 25d | 1 | 0.87mi |
| 3511 Bishop Eddie Newkirk Way Tampa, FL | 3.0 | 1.0 | 1056 | $1,800 | $1.70 | 26d | 1 | 0.88mi |
| 3511 Bishop Eddie Newkirk Way Tampa, FL | 3.0 | 1.0 | 1056 | $1,800 | $1.70 | 12d | 1 | 0.88mi |
| 2205 Chipco St Tampa, FL | 2.0 | 1.0 | 1100 | $1,600 | $1.45 | 26d | 1 | 0.88mi |
| 3517 Bishop Eddie Newkirk Way Tampa, FL | 3.0 | 2.0 | 1200 | $2,500 | $2.08 | 26d | 1 | 0.89mi |
| 3022 Deleuil Ave Tampa, FL | 3.0 | 2.0 | 1053 | $1,850 | $1.76 | 21d | 1 | 0.93mi |
| 1711 E New Orleans Ave Tampa, FL | 3.0 | 2.0 | 1136 | $2,250 | $1.98 | 22d | 1 | 0.98mi |
| 1602 E North Bay St Tampa, FL | 3.0 | 2.0 | 1200 | $2,100 | $1.75 | 26d | 1 | 1.00mi |
| 5541 N 22nd St Tampa, FL | 1.0–2.0 | 1.0–2.0 | 798 | $1,950 | $2.44 | 0d | 28 | 1.02mi |
| 1608 E New Orleans Ave Tampa, FL | 4.0 | 2.0 | 1254 | $1,895 | $1.51 | 16d | 1 | 1.05mi |
| 1501 E Palifox St Tampa, FL | 3.0 | 2.0 | 1248 | $1,750 | $1.40 | 15d | 1 | 1.08mi |
| 1517 E Ellicott St Tampa, FL | 3.0 | 2.0 | 1292 | $2,225 | $1.72 | 18d | 1 | 1.09mi |
| 1605 E 29th Ave Tampa, FL | 3.0 | 1.0 | 870 | $1,800 | $2.07 | 22d | 1 | 1.11mi |
| 1504 E 33rd Ave Tampa, FL | 3.0 | 2.0 | 1108 | $2,900 | $2.62 | 26d | 1 | 1.11mi |
| 1515 E 31st Ave Tampa, FL | 2.0 | 1.0 | 914 | $1,500 | $1.64 | 6d | 1 | 1.12mi |
| 2108 E 22nd Ave Tampa, FL | 3.0 | 3.0 | 1308 | $2,100 | $1.61 | 6d | 1 | 1.14mi |
| 2108 E 22nd Ave Tampa, FL | 3.0 | 3.0 | 1308 | $2,100 | $1.61 | 5d | 1 | 1.14mi |
| 3101 E 18th Ave Tampa, FL | 3.0 | 1.0 | 1050 | $1,750 | $1.67 | 5d | 1 | 1.17mi |
| 4207 N 13th St Unit A Tampa, FL | 2.0 | 2.0 | 832 | $2,150 | $2.58 | 26d | 1 | 1.19mi |
| 2007 E Henry Ave Tampa, FL | 2.0 | 2.0 | 1278 | $2,250 | $1.76 | 26d | 1 | 1.21mi |
Listing history 4 events
-
2026-06-21days on market $260,000 Active 5 DOM
-
2026-06-18days on market $260,000 Active 2 DOM
-
2026-06-17remarks 28-char remark
-
2026-06-17$260,000 Active 1 DOM
ⓘ Source: listings_history table (triggers on properties + properties_extension) + one-shot
backfill from property_details.listing_events for pre-trigger history.
Tax reassessment forecast FL · Resets to sale price
- Current annual tax
- $2,084 · $174/mo
- Projected year-2 tax
- $2,158 · $180/mo
- Expected delta
- +$74/yr (+$6/mo · 3.5%)
ⓘ Screening estimate from a state-policy table — verify with the county assessor before closing.
Climate risk First Street
- Flood 4/10 Moderate FEMA zone X (unshaded) · 20% chance over 30 yrs
- Wildfire 1/10 Low
- Heat 10/10 Extreme 7 d/yr ≥109°F today · 26 d/yr by 30 yrs out
- Wind 9/10 Extreme 99% chance of damaging wind over 30 yrs
- Air quality 3/10 Moderate 3 unhealthy d/yr today · 4 by 30 yrs out
Nearby sold comps map
Loading sold comps map…
Walkable amenities ~0.75 mi
Loading nearby amenities…
Taxation est. · year 1
- Rental income
- $26,946
- − Mortgage interest
- −$14,564
- − Property taxes
- −$2,084
- − Insurance
- −$1,300
- − Repairs & maintenance
- −$2,156
- − Management
- −$2,156
- − Depreciation
- −$7,564
- Taxable loss
- −$2,877
- Est. tax savings @ 24.0%
- +$690
- After-tax cash flow
- $2,232/yr
For passive investors: Depreciation is non-cash, so a rental often shows a tax loss while cash-flowing — sheltering income. Rental losses are passive: they offset passive income freely, and up to $25,000/yr can offset ordinary (W-2) income if you actively participate and your MAGI is under $100k (phasing out to $0 by $150k); unused losses carry forward. On sale, claimed depreciation is recaptured at up to 25%, and gains may owe capital-gains tax (a 1031 exchange can defer both). Figures are a year-1 estimate at your 24.0% rate — not tax advice; consult a CPA.
Schools (NCES district)
- District
- Hillsborough
- NCES district ID
- 1200870
- Math proficiency
- 47% ▼ -8.00%
- Reading proficiency
- 50% ▼ -4.00%
- Median HH income
- $50,622
- Composite
- 41.6/100
- National rank
- #3435
- State rank
- #41 of 73 in FL
Livability — Tampa
- Score
- 79/100
- State rank
- #142
- US rank
- #2135
Category grades
Schools grade is shown separately in the Schools card above.
Census & demographics
- Census place
- Tampa, FL
- County
- Hillsborough County · 1,540,968 people
- City population
- 523,346
- Metro
- Tampa-St. Petersburg-Clearwater, FL
- Population (ZIP)
- 46,587
- Household income
- $54,209
- Rent vs Own
- Severe rent burden
- 2431.0
Population outlook (Hillsborough County) Hauer SSP2
- Today (2025)
- 1,607,022 people
- By 2030
- 1,733,968 · +7.9%
- By 2040
- 1,979,565 · +23.2%
- By 2050
- 2,203,427 · +37.1%
- By 2075
- 2,667,893 · +66.0%
- By 2100
- 2,891,558 · +79.9%
Race, ethnicity, and origin ACS 2023
- Neighborhood character
- Diverse neighborhood (Simpson 0.62)
- Race & ethnicity
- Black 55% Hispanic / Latino 22% White 17% Two or more races 13% Asian 3%
- Hispanic origin (detail)
- Mexican 3% Puerto Rican 7% Cuban 6%
- Common ancestry
- Hispanic 2% Romanian 1% Slovak 1%
- Foreign-born
- 18% · Canada
- Languages at home
- 75% English-only · Spanish 18% French/Haitian/Cajun 3% Other Asian/Pacific 1%
Political lean MEDSL · Hillsborough
- 2024 margin
- Toss-up / Even · D 47.8% · R 50.9% · Other 1.3%
- 2008→2024 swing
- -10.2pp toward R · 2008: 7.1pp · 2024: -3.1pp
- All cycles
- 2024: R+3.1 2020: D+6.9 2016: D+6.8 2012: D+6.7 2008: D+7.1
Not yet ingested
- Civics
- —
Market trends
- HPI YoY
- ▼ -158.81%
- Current HPI
- 428.9741
- Rent YoY
- ▼ -4.72%
- Metro
- Tampa-St. Petersburg-Clearwater, FL
- State GDP YoY
- ▲ 3.28%
- F500 in state
- 36
Industry mix (Fortune 500 HQ in FL)
| Industry | F500 HQs | Revenue |
|---|---|---|
| Industrial Technology | 2 | $29B |
|
||
| Insurance | 2 | $17B |
|
||
| Retail | 1 | $60B |
|
||
| Technology Distribution | 1 | $58B |
|
||
| Homebuilding | 1 | $35B |
|
||
| Technology Manufacturing | 1 | $35B |
|
||
Price history
+73.4% since first listed8 events — show timeline
- 2026-06-16 Listed $260,000 Stellar MLS as Distributed by MLS Grid
- 2018-11-29 Sold (Public Records) $129,000 Public Records
- 2018-11-26 Sold (MLS) $129,000 Stellar MLS as Distributed by MLS Grid
- 2018-10-08 Pending — Stellar MLS as Distributed by MLS Grid
- 2018-09-26 Price Changed $130,000 Stellar MLS as Distributed by MLS Grid
- 2018-09-18 Price Changed $140,000 Stellar MLS as Distributed by MLS Grid
- 2018-08-30 Price Changed $145,000 Stellar MLS as Distributed by MLS Grid
- 2018-08-04 Listed $149,900 Stellar MLS as Distributed by MLS Grid
Property tax history
+11.8%/yrLatest (2025): $2,084 · +11.5% YoY. Source: county tax records.
Cash-flow waterfall
monthlySold comps — $/sqft
last 12 mo · ≤1 miLoading sold comps…