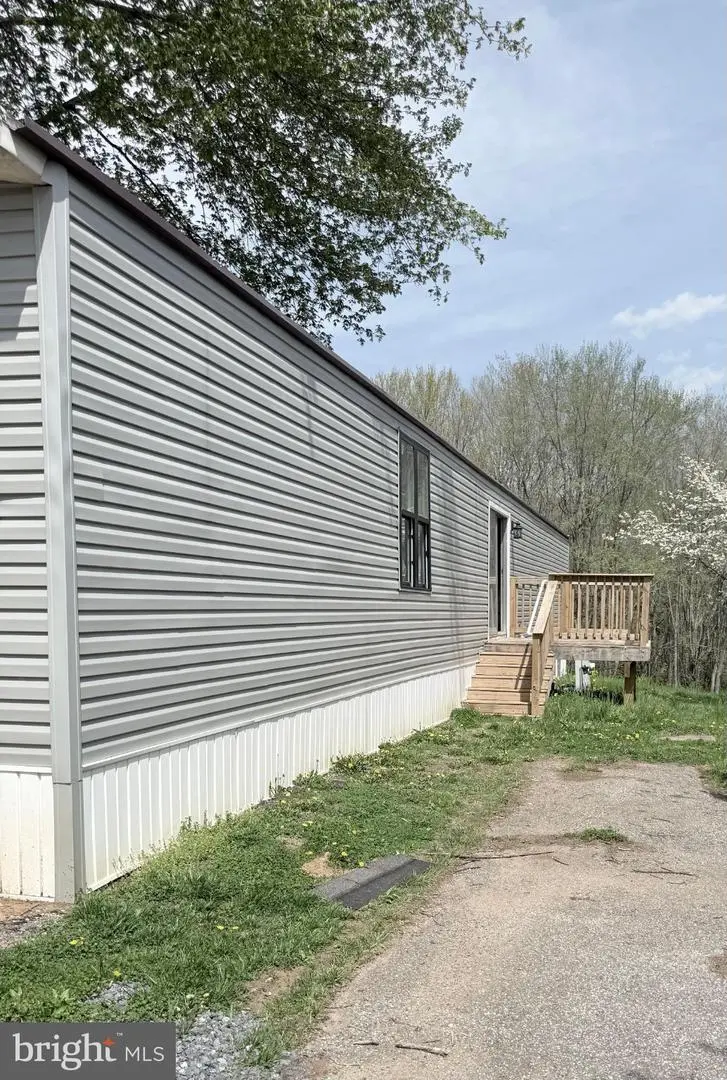
35 Mayer Dr W · Eldersburg, MD
Flood risk No data
- FEMA flood zone
- —
- Chance of flooding over 30 yrs
- —
- Est. flood insurance / yr
- —
Fire risk No data
- Est. fire insurance / yr
- —
Heat risk No data
- Hot days now (above threshold)
- —
- Hot days in 30 yrs
- —
Wind risk No data
- Chance of severe wind over 30 yrs
- —
Air-quality risk No data
- Unhealthy air days now
- —
- Unhealthy air days in 30 yrs
- —
Risk factors via First Street. Map © Google.
Why this score? — see what drove the B+ grade
The composite is a weighted blend of 9 inputs, each scored 0–100. Each bar is that input's sub-score; the figure is the points it added to the 100-point composite (weight × sub-score).
- Cash flow +30.0/30.0
- ARV discount +15.0/15.0
- 1% rule +10.0/10.0
- DSCR +10.0/10.0
- Livability +3.8/5.0
- Schools +3.7/10.0
- Rent growth +2.5/5.0
- Condition / age +2.2/5.0
- Appreciation +0.0/10.0
$55,000
🖨 Deal sheet 📄 Offer letter ✓ Due diligence
Listing remarks MLS
Well-located 3-bedrom, 2-bath mobile offering a functional layout with strong potential for renovation or customization. This property presents and excellent opportunity for investors , handymen, cash buyers, or end users looking for an affordable home with value-add potential. The home features a spacious floor plan with good room sizes and natural flow throughout. It is being sold in its current condition, allowing the next owner to complete updates and improvements to their preference. Bring your vision and take advantage of this opportunity. Schedule you showing today!. Property is being sold AS IS.
Key facts
- Built 1989
- Listed 63 days
Neighborhood map
What this means for you Summary
Snapshot
- This is a 3-bed/2.0-bath single-family listed at $55k. Condition is rated fair.
Deal economics
- At list price, monthly cash flow is $805 ($10k/yr) — positive.
- The deal already cash-flows at list — no discount required.
- Meets the 1% rule at list price ($2k rent vs $55k).
- Recommended offer: $52k (6.0% below list) — sets the bar for market timing.
- Cap rate 23.9% vs local median 2.2% in Eldersburg — top-decile yield for the area; either an underpriced asset or a hidden risk that comps aren't pricing in. Stress-test before assuming the spread holds.
Location & tenants
- Location reads 75/100 on livability (#103 in MD, #3,957 nationally) — a middle-class / working-renter tenant base. Strengths: employment A+, housing A+, health & safety A+; Watch: commute F, cost of living F.
- Carroll County Public Schools (suburban): math 32% / reading 47% proficiency, ranked #2 of 24 in MD (top 8%) — families likely to look elsewhere, expect single-tenant / working-renter base with shorter leases; only 16% free/reduced lunch — higher-income household profile.
- Market conditions: 36 active listings in the ZIP; 1 comparable units currently listed for rent nearby; 156 units permitted in Carroll County in 2024 (12 in 5+ unit buildings).
Forward outlook
- Local home prices are declining (-3.0%/yr); year-one equity from $380 of loan paydown is wiped out by about $2k of value loss. Plan a longer hold.
- Carroll County population projected to shrink 7% by 2050 — rents likely to lag national; underwrite the cash flow, not the appreciation.
- At projected returns (-3.0% appreciation + 3.0% rent growth), your $15k cash investment doubles in ~2 years — after that, you're playing with house money.
Negotiation context
- It's been on market 63 days — a 6% lower offer ($52k) is reasonable based on typical stale-listing flexibility.
- 3 sale attempts; this cycle's ask has dropped $10k (15%) from the opening price — seller is motivated, your offer sets the floor, not the list.
Questions for the listing agent
- It's been on market 63 days. Have you received any prior offers? Is the seller open to a 6% concession, seller financing, or rate buy-down credit?
- Have any recent inspections been done? Can we get a copy of the seller's disclosures and any deferred-maintenance estimates?
- Why hasn't it sold? Are there any deal-killer items the seller is aware of (foundation, flood, title, zoning, code violations)?
- Is there a deadline driving the sale (1031 exchange, divorce, estate, relocation)? That informs how much negotiation room exists.
- Schools are B-rated — typically a magnet for longer-tenancy family renters. What's the average tenant stay here, and is there a school-zone premium baked into asking?
- What's the average days-on-market for RENTAL listings here right now (not sales)? A rising rental-DOM trend means longer vacancies and softer asking-rent achievability than the comps imply.
- What's the recent tenant-quality profile in this submarket — average credit score on applications, eviction rate, late-payment / NSF rate, and stable-employment percentage? A property-management company in the area should have these aggregated.
- How much new for-sale + rental construction is in the pipeline within 1–3 miles? Heavy new supply typically softens prices + rents 12–24 months out; constrained supply supports both.
Investment metrics
- 1% rule
- 2.73% ✓
- Cap rate
- 23.85%
- Cash-on-cash
- 62.72%
- DSCR
- 3.79
- GRM
- 3.1
CMA / ARV
- ARV (median comp)
- $91,838
- List price
- $55,000
- Delta
- -40.11%
- Verdict
- UNDERPRICED
- Comps
- 13 within 1.0 mi
Show comp detail 5 sales within ~0.75 mi
| Address | Dist | Beds/Ba | Sqft | Sold | Price | $/sf | Match |
|---|---|---|---|---|---|---|---|
| 2525-#13 Baltimore Blvd | 0.33mi | 3/2.0 | 1,000 (0%) | 6mo | $40,000 | $40 | 79 |
| 2551 Baltimore Blvd #67 | 0.15mi | 3/1.5 | 1,100 (+10%) | 23mo | $71,000 | $65 | 55 |
| 2551 Baltimore Blvd #64 | 0.15mi | 2/2.0 (-1) | 1,100 (+10%) | 20mo | $89,500 | $81 | 54 |
| 2525 Lot 20 Baltimore Blvd | 0.42mi | 2/2.0 (-1) | 924 (-8%) | 13mo | $107,500 | $116 | 52 |
| 2112 Spencer Ln | 0.61mi | 2/1.0 (-1) | 988 (-1%) | 19mo | $350,000 | $354 | 45 |
Match score weights: distance 35% · size 25% · config 20% · recency 20%. Top-matched comps best support the ARV.
Projected returns pro-forma
-3.0% appreciation · 3.0% rent growth · sell at horizon
- IRR
- 61.7%
- Equity multiple
- 3.75×
- Total profit
- $42,375
- Equity at exit
- $8,201
- IRR
- 66.3%
- Equity multiple
- 7.69×
- Total profit
- $103,003
- Equity at exit
- $4,755
Cash invested: $15,400 (down + closing). Projections, not guarantees.
Landlord ↔ Tenant lean methodology
- Overall (STATE)
- 27 Tenant-Leaning
- State Maryland
- 27 Tenant-Leaning · D+14
- County
- — inherits STATE
- City
- — inherits STATE
ZIP-level market 21048
- Active inventory
- 36
- Price-to-rent
- 3.1×
Monthly cashflow live
- Estimated rent
- $1,500 medium interval (Pro) →
- Mortgage (P&I)
- −$288
- Tax est. 1.5%
- −$69 /mo · $825/yr
- Insurance
- −$23
- HOA
- −$0
- Vacancy / Maint / Mgmt
- −$315
- Net cashflow
- $805
Break-even live
UW: 25.0% down · 7.5% · 30yr · 1.5% tax · 5.0% vac · 8.0% maint · 8.0% mgmt
Financing live
Cash to close
- Down payment
- $13,750
- Closing costs
- $1,650
- Reserves months
- —
- Total cash needed
- —
Loan-product check · same deal, 3 products live
Conventional
25% down · 7.5% · 30yr
- Down + closing
- —
- Monthly P&I
- —
- Monthly cashflow
- —
- DSCR
- —
- Eligible?
- —
Personal DTI + credit; lowest rate.
DSCR
20% down · 8.5% · 30yr
- Down + closing
- —
- Monthly P&I
- —
- Monthly cashflow
- —
- DSCR
- —
- Eligible?
- —
No personal income docs; deal must DSCR.
Hard money
10% down · 12.0% · 12mo
- Down + closing
- —
- Monthly P&I
- —
- Monthly cashflow
- —
- DSCR
- —
- Eligible?
- —
Short-term bridge; refi at stabilization.
Rent comps 1 comps
| Address | Beds | Baths | Sqft | Rent | $/sqft | DOM | Units | Dist |
|---|---|---|---|---|---|---|---|---|
| 2717 Cedarhurst Rd Apt 4 Finksburg, MD | 2.0 | 1.0 | 747 | $1,500 | $2.01 | 17d | 1 | 1.20mi |
Listing history 24 events
-
2026-06-18days on market $55,000 Active 63 DOM
-
2026-06-17days on market $55,000 Active 62 DOM
-
2026-06-16days on market $55,000 Active 61 DOM
-
2026-06-15days on market $55,000 Active 60 DOM
-
2026-06-13days on market $55,000 Active 58 DOM
-
2026-06-09days on market $55,000 Active 54 DOM
-
2026-06-08days on market $55,000 Active 53 DOM
-
2026-06-07days on market $55,000 Active 52 DOM
-
2026-06-04days on market $55,000 Active 49 DOM
-
2026-06-03days on market $55,000 Active 48 DOM
-
2026-06-02days on market $55,000 Active 47 DOM
-
2026-06-01days on market $55,000 Active 46 DOM
-
2026-05-31days on market $55,000 Active 45 DOM
-
2026-05-05price $55,000 613-char remark
Show marketing remark (613 chars)
Well-located 3-bedrom, 2-bath mobile offering a functional layout with strong potential for renovation or customization. This property presents and excellent opportunity for investors , handymen, cash buyers, or end users looking for an affordable home with value-add potential. The home features a spacious floor plan with good room sizes and natural flow throughout. It is being sold in its current condition, allowing the next owner to complete updates and improvements to their preference. Bring your vision and take advantage of this opportunity. Schedule you showing today!. Property is being sold AS IS.
-
2026-04-16$65,000 Active 613-char remark
Show marketing remark (613 chars)
Well-located 3-bedrom, 2-bath mobile offering a functional layout with strong potential for renovation or customization. This property presents and excellent opportunity for investors , handymen, cash buyers, or end users looking for an affordable home with value-add potential. The home features a spacious floor plan with good room sizes and natural flow throughout. It is being sold in its current condition, allowing the next owner to complete updates and improvements to their preference. Bring your vision and take advantage of this opportunity. Schedule you showing today!. Property is being sold AS IS.
-
2026-04-08historical $65,000 613-char remark
Show marketing remark (613 chars)
Well-located 3-bedrom, 2-bath mobile offering a functional layout with strong potential for renovation or customization. This property presents and excellent opportunity for investors , handymen, cash buyers, or end users looking for an affordable home with value-add potential. The home features a spacious floor plan with good room sizes and natural flow throughout. It is being sold in its current condition, allowing the next owner to complete updates and improvements to their preference. Bring your vision and take advantage of this opportunity. Schedule you showing today!. Property is being sold AS IS.
-
2025-11-30historical
-
2025-10-17price $75,000
-
2025-08-26price $80,000
-
2025-08-19status Active
-
2025-06-18historical
-
2025-06-11price $85,000
-
2025-05-30$90,000 Active
-
2025-05-26historical
ⓘ Source: listings_history table (triggers on properties + properties_extension) + one-shot
backfill from property_details.listing_events for pre-trigger history.
Nearby sold comps map
Loading sold comps map…
Walkable amenities ~0.75 mi
Loading nearby amenities…
Taxation est. · year 1
- Rental income
- $18,000
- − Mortgage interest
- −$3,081
- − Property taxes
- −$825
- − Insurance
- −$275
- − Repairs & maintenance
- −$1,440
- − Management
- −$1,440
- − Depreciation
- −$1,600
- Taxable income
- $9,339
- Est. tax owed @ 24.0%
- −$2,241
- After-tax cash flow
- $7,417/yr
For passive investors: Depreciation is non-cash, so a rental often shows a tax loss while cash-flowing — sheltering income. Rental losses are passive: they offset passive income freely, and up to $25,000/yr can offset ordinary (W-2) income if you actively participate and your MAGI is under $100k (phasing out to $0 by $150k); unused losses carry forward. On sale, claimed depreciation is recaptured at up to 25%, and gains may owe capital-gains tax (a 1031 exchange can defer both). Figures are a year-1 estimate at your 24.0% rate — not tax advice; consult a CPA.
Condition & rehab AI · 4 photos
This single-family home presents a fair condition with significant potential for moderate renovations. The exterior siding and interior flooring require major repairs, while the kitchen and bathrooms need moderate upgrades. Painting and updating the interior will significantly enhance its curb appeal and value.
Repairs flagged
- Major exterior siding — Significant wear and tear
- Minor interior walls — Some scuff marks
- Major flooring — Worn and stained carpet
- Moderate kitchen cabinets — Dated appearance
- Minor bathroom fixtures — Standard fixtures
Value-add opportunities
- Both Paint interior walls — Enhances curb appeal and interior aesthetics
- Both Replace carpet — Improves comfort and reduces maintenance
- Both Upgrade kitchen cabinets — Modernizes the space and increases appeal
- Both Upgrade bathroom fixtures — Enhances functionality and aesthetics
Renovation cost estimate screening
| Repair item | Severity | Est. cost |
|---|---|---|
| exterior siding · Significant wear and tear | Major | $15,000–50,000 |
| interior walls · Some scuff marks | Minor | $500–3,000 |
| flooring · Worn and stained carpet | Major | $15,000–50,000 |
| kitchen cabinets · Dated appearance | Moderate | $3,000–15,000 |
| bathroom fixtures · Standard fixtures | Minor | $500–3,000 |
| Total estimated repair cost · 5 items | $34,000–121,000 |
Value-add ROI direction
- Both Paint interior walls — Enhances curb appeal and interior aesthetics ↑
- Both Replace carpet — Improves comfort and reduces maintenance ↑
- Both Upgrade kitchen cabinets — Modernizes the space and increases appeal ↑
- Both Upgrade bathroom fixtures — Enhances functionality and aesthetics ↑
ⓘ Cost ranges are severity-bucket heuristics (US national rule-of-thumb). Get contractor quotes + a written scope before underwriting a rehab budget.
Schools (NCES district)
- District
- Carroll County Public Schools
- NCES district ID
- 2400210
- Math proficiency
- 32% ▼ -25.00%
- Reading proficiency
- 47% ▼ -16.00%
- Median HH income
- $84,594
- Composite
- 37.33/100
- National rank
- #4441
- State rank
- #2 of 24 in MD
Livability — Eldersburg
- Score
- 75/100
- State rank
- #103
- US rank
- #3957
Category grades
Schools grade is shown separately in the Schools card above.
Census & demographics
- City population
- 37,813
- Population (ZIP)
- 10,002
Population outlook (Carroll County) Hauer SSP2
- Today (2025)
- 169,677 people
- By 2030
- 169,605 · +-0.0%
- By 2040
- 166,205 · -2.0%
- By 2050
- 158,312 · -6.7%
- By 2075
- 143,013 · -15.7%
- By 2100
- 122,431 · -27.8%
Race, ethnicity, and origin ACS 2023
- Neighborhood character
- Predominantly White (86%)
- Race & ethnicity
- White 86% Asian 5% Two or more races 4% Black 4% Hispanic / Latino 3%
- Common ancestry
- Romanian 5% Slovak 4% Italian 3%
- Foreign-born
- 6% · Canada, China, Philippines
- Languages at home
- 94% English-only · Other Indo-European 1% Spanish 1% Other Asian/Pacific 1%
Political lean MEDSL · Carroll
- 2024 margin
- Strong R (+24.9) · D 36.2% · R 61.2% · Other 2.6%
- 2008→2024 swing
- +6.2pp toward D · 2008: -31.2pp · 2024: -24.9pp
- All cycles
- 2024: R+24.9 2020: R+23.7 2016: R+36.9 2012: R+34.0 2008: R+31.2
Not yet ingested
- Civics
- —
Market trends
- HPI YoY
- ▼ -204.28%
- Current HPI
- 276.108
- Rent YoY
- —
- Metro
- —
- State GDP YoY
- ▲ 2.97%
- F500 in state
- 12
Industry mix (Fortune 500 HQ in MD)
| Industry | F500 HQs | Revenue |
|---|---|---|
| Aerospace / Defense | 1 | $71B |
|
||
| Utilities | 1 | $25B |
|
||
| Hotels | 1 | $24B |
|
||
| Consumer Goods | 1 | $7B |
|
||
| Real Estate | 1 | $6B |
|
||
| Chemicals | 1 | $2B |
|
||
Price history
-38.9% since first listed11 events — show timeline
- 2026-05-05 Price Changed $55,000 BRIGHT MLS
- 2026-04-16 Listed $65,000 BRIGHT MLS
- 2026-04-08 Coming Soon $65,000 BRIGHT MLS
- 2025-11-30 Listing Removed — BRIGHT MLS
- 2025-10-17 Price Changed $75,000 BRIGHT MLS
- 2025-08-26 Price Changed $80,000 BRIGHT MLS
- 2025-08-19 Relisted — BRIGHT MLS
- 2025-06-18 Listing Removed — BRIGHT MLS
- 2025-06-11 Price Changed $85,000 BRIGHT MLS
- 2025-05-30 Listed $90,000 BRIGHT MLS
- 2025-05-26 Coming Soon — BRIGHT MLS
Cash-flow waterfall
monthlySold comps — $/sqft
last 12 mo · ≤1 miLoading sold comps…