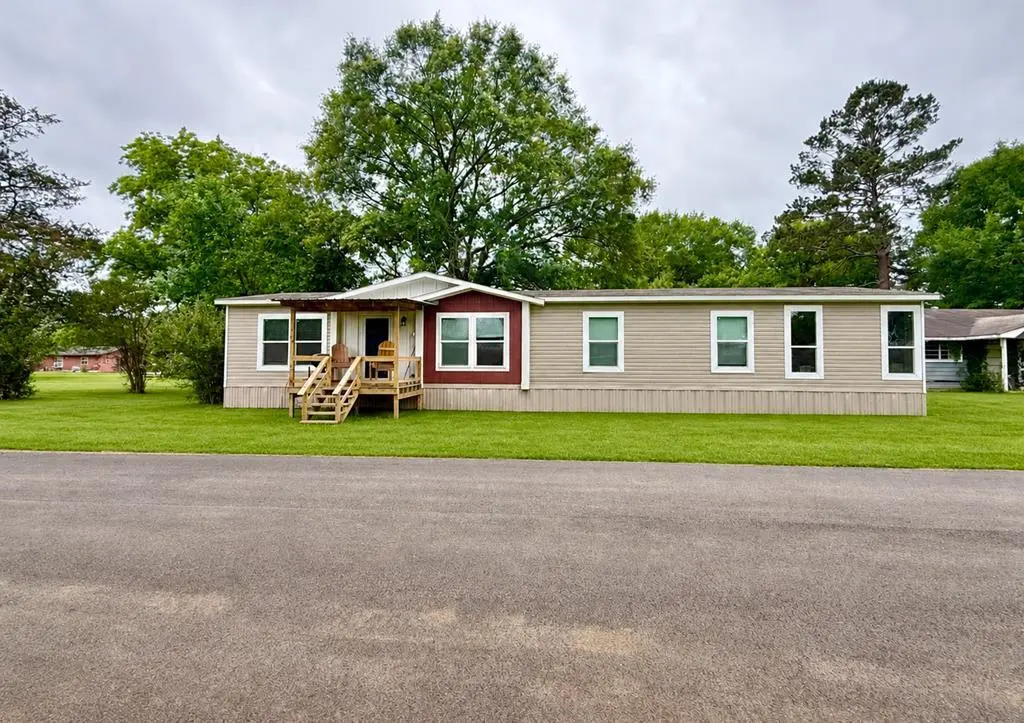
217 Fears St · Pineland, TX
Flood risk 1/10 · Minimal
- FEMA flood zone
- X
- Chance of flooding over 30 yrs
- 0.0%
- Est. flood insurance / yr
- $507 – $1,088
Fire risk 4/10 · Minor
- Est. fire insurance / yr
- $1,222 – $2,270
Heat risk 8/10 · Major
- Hot days now (above 111°F)
- 7 days/yr
- Hot days in 30 yrs
- 23 days/yr
Wind risk 8/10 · Major
- Chance of severe wind over 30 yrs
- 91.0%
Air-quality risk 1/10 · Minimal
- Unhealthy air days now
- 0 days/yr
- Unhealthy air days in 30 yrs
- 0 days/yr
Risk factors via First Street. Map © Google.
Why this score? — see what drove the C- grade
The composite is a weighted blend of 9 inputs, each scored 0–100. Each bar is that input's sub-score; the figure is the points it added to the 100-point composite (weight × sub-score).
- ARV discount +15.0/15.0
- Cash flow +12.1/30.0
- Appreciation +7.0/10.0
- DSCR +3.6/10.0
- 1% rule +3.2/10.0
- Livability +3.1/5.0
- Schools +2.7/10.0
- Rent growth +2.5/5.0
- Condition / age +2.5/5.0
$155,000
🖨 Deal sheet 📄 Offer letter ✓ Due diligence
Listing remarks
Welcome to this beautiful 28x68 doublewide manufactured home offering 4 bedrooms, 2 full baths, and a layout that actually works for real life. Spacious primary suite, featuring a walk-in shower, garden tub, and walk in closet. The kitchen comes fully equipped with all new appliances. You'll also appreciate the oversized laundry room, tucked conveniently off the kitchen, with enough space to function as a mudroom or secondary workspace. Additional flex space—perfect for a home office, playroom, second living area, or whatever your life needs next. Set on a nice lot in the heart of Pineland and is on city utilities.
Key facts
- Walk in closet
- Walk in shower
- Garden tub
Tags
Property features AI
Exterior
- Parking: No garage
- Utilities: Public water; Public sewer
- Home design: Manufactured home; Residential property; Lot is approximately 0.5 acres
- Construction: Vinyl siding
- Exterior features: Composition roof
Interior
- Kitchen: Microwave; Refrigerator
- Flooring: Laminate; Vinyl
- Bathrooms: 2 full bathrooms
- Heating & cooling: Central heating; Central air conditioning
- Interior features: Walk-in closet(s)
- Laundry & utility: Washer; Dryer
Neighborhood map
What this means for you Summary
Snapshot
- This is a 4-bed/2.0-bath single-family listed at $155k.
Deal economics
- At list price, monthly cash flow is $-33 ($-394/yr) — negative.
- To cash-flow at today's rent, offer at most $149k (3.7% below list).
- To meet the 1% rule (rent ≥ 1% of price), the offer needs to be $126k (18.5% below list).
- Recommended offer: $126k (18.5% below list) — sets the bar for 1% rule.
Location & tenants
- Location reads 62/100 on livability (#966 in TX) — a middle-class / working-renter tenant base. Strengths: cost of living A+, housing A; Watch: schools D+, amenities F, commute F.
- West Sabine ISD (rural): math 33% / reading 32% proficiency, ranked #597 of 826 in TX (top 72%) — families likely to look elsewhere, expect single-tenant / working-renter base with shorter leases; 67% free/reduced lunch — lower-income household profile, screen leases tightly.
- Market conditions: 43 active listings in the ZIP.
Forward outlook
- In year one you build about $7k of equity ($1k loan paydown + $6k appreciation (4.0% local appreciation)).
- Sabine County population projected at -23% by 2050 — secular population decline; favor cash flow + early exit over multi-decade hold.
- At projected returns (4.0% appreciation + 3.0% rent growth), your $43k cash investment doubles in ~6 years — after that, you're playing with house money.
- By year 5, paydown + projected appreciation supports a ~$31k cash-out refi (75% LTV) — recoverable capital for the next deal without selling this one.
Negotiation context
- It's been on market 41 days — a 3% lower offer ($150k) is reasonable based on typical stale-listing flexibility.
Risks & watch-outs
- Watch-outs: built in 1945 — expect roof / HVAC / electrical / plumbing capex.
- Climate carrying-cost: severe wind risk, 91% chance of damaging wind over 30y; extreme-heat days projected 7→23/yr by 2055 (HVAC capex compounding) — expect insurance premiums to compound above CPI over the hold.
Questions for the listing agent
- What do current leases actually rent for vs. the listed asking? Can we see a recent rent roll and the last 12 months of T-12 income?
- It's been on market 41 days. Have you received any prior offers? Is the seller open to a 18% concession, seller financing, or rate buy-down credit?
- Built in 1945 — when were the roof, HVAC, electrical panel, plumbing, and water heater last replaced?
- Is there a deadline driving the sale (1031 exchange, divorce, estate, relocation)? That informs how much negotiation room exists.
- Schools are D-rated, which usually means shorter tenancies and higher turnover. Who's the typical renter profile here, and what's been the actual vacancy rate?
- What's the average days-on-market for RENTAL listings here right now (not sales)? A rising rental-DOM trend means longer vacancies and softer asking-rent achievability than the comps imply.
- What's the recent tenant-quality profile in this submarket — average credit score on applications, eviction rate, late-payment / NSF rate, and stable-employment percentage? A property-management company in the area should have these aggregated.
- How much new for-sale + rental construction is in the pipeline within 1–3 miles? Heavy new supply typically softens prices + rents 12–24 months out; constrained supply supports both.
Investment metrics
- 1% rule
- 0.82% ✗
- Cap rate
- 6.04%
- Cash-on-cash
- -0.91%
- DSCR
- 0.96
- GRM
- 10.2
CMA / ARV
- ARV (median comp)
- $205,572
- List price
- $155,000
- Delta
- -24.60%
- Verdict
- UNDERPRICED
- Comps
- 3 within 2.0 mi
Projected returns pro-forma
3.98% appreciation · 3.0% rent growth · sell at horizon
- IRR
- 9.4%
- Equity multiple
- 1.57×
- Total profit
- $24,799
- Equity at exit
- $78,445
- IRR
- 11.4%
- Equity multiple
- 2.88×
- Total profit
- $81,485
- Equity at exit
- $128,190
Cash invested: $43,400 (down + closing). Projections, not guarantees.
Landlord ↔ Tenant lean methodology
- Overall (STATE)
- 87 Strongly Landlord-Friendly
- State Texas
- 87 Strongly Landlord-Friendly · R+5
- County
- — inherits STATE
- City
- — inherits STATE
ZIP-level market 75968
- Home prices YoY
- 5.2%
- Active inventory
- 43
- Price-to-rent
- 10.2×
Monthly cashflow live
- Estimated rent
- $1,264 medium interval (Pro) →
- Mortgage (P&I)
- −$813
- Tax from tax record
- −$154 /mo · $1,844/yr
- Insurance
- −$65
- HOA
- −$0
- Vacancy / Maint / Mgmt
- −$265
- Net cashflow
- $-33
Break-even live
UW: 25.0% down · 7.5% · 30yr · 1.5% tax · 5.0% vac · 8.0% maint · 8.0% mgmt
Financing live
Cash to close
- Down payment
- $38,750
- Closing costs
- $4,650
- Reserves months
- —
- Total cash needed
- —
Loan-product check · same deal, 3 products live
Conventional
25% down · 7.5% · 30yr
- Down + closing
- —
- Monthly P&I
- —
- Monthly cashflow
- —
- DSCR
- —
- Eligible?
- —
Personal DTI + credit; lowest rate.
DSCR
20% down · 8.5% · 30yr
- Down + closing
- —
- Monthly P&I
- —
- Monthly cashflow
- —
- DSCR
- —
- Eligible?
- —
No personal income docs; deal must DSCR.
Hard money
10% down · 12.0% · 12mo
- Down + closing
- —
- Monthly P&I
- —
- Monthly cashflow
- —
- DSCR
- —
- Eligible?
- —
Short-term bridge; refi at stabilization.
Listing history 16 events
-
2026-06-17days on market $155,000 Active 41 DOM
-
2026-06-16days on market $155,000 Active 40 DOM
-
2026-06-15days on market $155,000 Active 39 DOM
-
2026-06-15days on market $155,000 Active 38 DOM
-
2026-06-13days on market $155,000 Active 37 DOM
-
2026-06-12days on market $155,000 Active 36 DOM
-
2026-06-09days on market $155,000 Active 33 DOM
-
2026-06-08days on market $155,000 Active 32 DOM
-
2026-06-08days on market $155,000 Active 31 DOM
-
2026-06-05days on market $155,000 Active 29 DOM
-
2026-06-04price $155,000 Active 27 DOM
-
2026-06-03days on market $165,000 Active 27 DOM
-
2026-06-02days on market $165,000 Active 26 DOM
-
2026-06-01days on market $165,000 Active 25 DOM
-
2026-05-31days on market $165,000 Active 24 DOM
-
2026-05-03$165,000 Active 628-char remark
ⓘ Source: listings_history table (triggers on properties + properties_extension) + one-shot
backfill from property_details.listing_events for pre-trigger history.
Tax reassessment forecast TX · Resets to sale price
- Current annual tax
- $1,844 · $154/mo
- Projected year-2 tax
- $2,836 · $236/mo
- Expected delta
- +$993/yr (+$83/mo · 53.9%)
ⓘ Screening estimate from a state-policy table — verify with the county assessor before closing.
Climate risk First Street
- Flood 1/10 Low FEMA zone X · 0% chance over 30 yrs
- Wildfire 4/10 Moderate
- Heat 8/10 Severe 7 d/yr ≥111°F today · 23 d/yr by 30 yrs out
- Wind 8/10 Severe 91% chance of damaging wind over 30 yrs
- Air quality 1/10 Low 0 unhealthy d/yr today · 0 by 30 yrs out
Nearby sold comps map
Loading sold comps map…
Walkable amenities ~0.75 mi
Loading nearby amenities…
Taxation est. · year 1
- Rental income
- $15,162
- − Mortgage interest
- −$8,682
- − Property taxes
- −$1,844
- − Insurance
- −$775
- − Repairs & maintenance
- −$1,213
- − Management
- −$1,213
- − Depreciation
- −$4,509
- Taxable loss
- −$3,074
- Est. tax savings @ 24.0%
- +$738
- After-tax cash flow
- $343/yr
For passive investors: Depreciation is non-cash, so a rental often shows a tax loss while cash-flowing — sheltering income. Rental losses are passive: they offset passive income freely, and up to $25,000/yr can offset ordinary (W-2) income if you actively participate and your MAGI is under $100k (phasing out to $0 by $150k); unused losses carry forward. On sale, claimed depreciation is recaptured at up to 25%, and gains may owe capital-gains tax (a 1031 exchange can defer both). Figures are a year-1 estimate at your 24.0% rate — not tax advice; consult a CPA.
Schools (NCES district)
- District
- West Sabine ISD
- NCES district ID
- 4845180
- Math proficiency
- 33% ▼ -14.00%
- Reading proficiency
- 32% ▼ -6.00%
- Median HH income
- $31,860
- Composite
- 26.55/100
- National rank
- #7193
- State rank
- #597 of 826 in TX
Livability — Pineland
- Score
- 62/100
- State rank
- #966
- US rank
- #17147
Category grades
Schools grade is shown separately in the Schools card above.
Census & demographics
- Census place
- Pineland, TX
- Population (ZIP)
- 1,966
Population outlook (Sabine County) Hauer SSP2
- Today (2025)
- 9,354 people
- By 2030
- 8,806 · -5.9%
- By 2040
- 7,871 · -15.9%
- By 2050
- 7,224 · -22.8%
- By 2075
- 6,351 · -32.1%
- By 2100
- 5,465 · -41.6%
Race, ethnicity, and origin ACS 2023
- Neighborhood character
- Predominantly White (92%)
- Race & ethnicity
- White 92% Black 6%
- Common ancestry
- Lithuanian 2% Serbian 1% Italian 1%
- Foreign-born
- 0% · Canada
- Languages at home
- 99% English-only · Spanish 1%
Political lean MEDSL · Sabine
- 2024 margin
- Solid R (+78.5) · D 10.6% · R 89.1%
- 2008→2024 swing
- -23.7pp toward R · 2008: -54.8pp · 2024: -78.5pp
- All cycles
- 2024: R+78.5 2020: R+75.0 2016: R+72.8 2012: R+63.9 2008: R+54.8
Not yet ingested
- Civics
- —
Market trends
- HPI YoY
- ▲ 3.98%
- Current HPI
- 81.0253
- Rent YoY
- —
- Metro
- —
- State GDP YoY
- ▲ 3.95%
- F500 in state
- 110
Industry mix (Fortune 500 HQ in TX)
| Industry | F500 HQs | Revenue |
|---|---|---|
| Energy | 16 | $1,198B |
|
||
| Technology | 5 | $198B |
|
||
| Engineering / Construction | 4 | $72B |
|
||
| Energy Services | 3 | $60B |
|
||
| Utilities | 3 | $41B |
|
||
| Healthcare | 2 | $330B |
|
||
Price history
-6.1% since first listed2 events — show timeline
- 2026-06-03 Price Changed $155,000 Deep East Texas MLS
- 2026-05-03 Listed $165,000 Deep East Texas MLS
Property tax history
+4.2%/yrLatest (2025): $1,844 · +14.1% YoY. Source: county tax records.
Cash-flow waterfall
monthlySold comps — $/sqft
last 12 mo · ≤1 miLoading sold comps…