 🏗️ New Construction
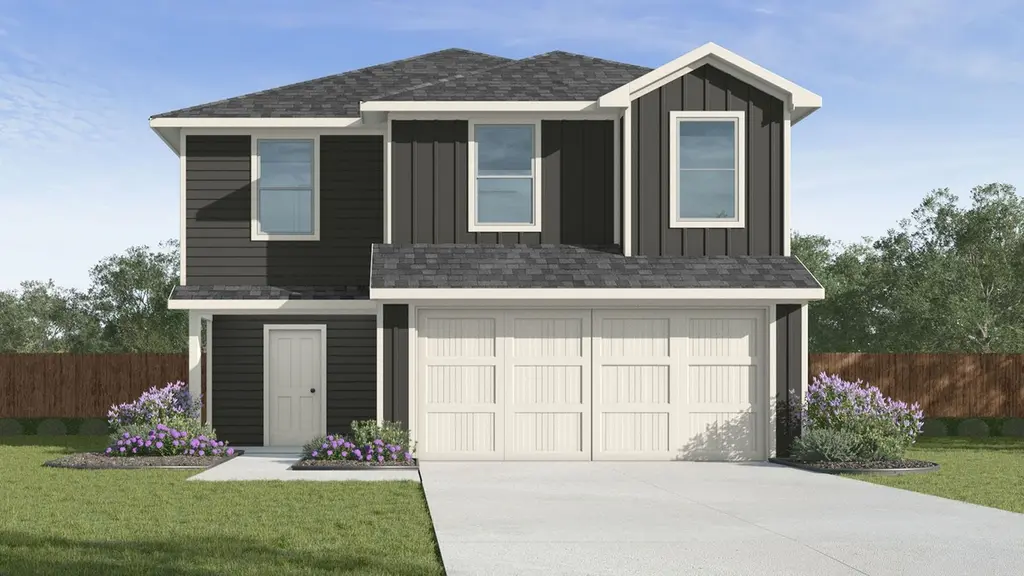
Franklin Plan · Temple, TX
Flood risk No data
- FEMA flood zone
- —
- Chance of flooding over 30 yrs
- —
- Est. flood insurance / yr
- —
Fire risk No data
- Est. fire insurance / yr
- —
Heat risk No data
- Hot days now (above threshold)
- —
- Hot days in 30 yrs
- —
Wind risk No data
- Chance of severe wind over 30 yrs
- —
Air-quality risk No data
- Unhealthy air days now
- —
- Unhealthy air days in 30 yrs
- —
Risk factors via First Street. Map © Google.
Why this score? — see what drove the D- grade
The composite is a weighted blend of 9 inputs, each scored 0–100. Each bar is that input's sub-score; the figure is the points it added to the 100-point composite (weight × sub-score).
- Cash flow +8.9/30.0
- ARV discount +7.5/15.0
- Condition / age +4.8/5.0
- Livability +3.8/5.0
- 1% rule +2.7/10.0
- Schools +2.7/10.0
- DSCR +2.5/10.0
- Rent growth +2.3/5.0
- Appreciation +0.0/10.0
$252,990
🖨 Deal sheet (PDF) 📄 Offer letter ✓ Due diligence
Listing remarks MLS
Step into the stunning Franklin floorplan at Pepper Creek Crossing in Jarrell, Texas. Featuring 5 bedrooms, 2.5 bathrooms, and approximately 1,892 sq. ft. of meticulously crafted living space, this home is perfect for you. On the first floor, you'll find a spacious, open concept living area ideal for entertaining guests or enjoying family time. The beautifully designed kitchen is the heart of the home, showcasing a large island, sleek stainless-steel appliances, and generous counter space-perfect for cooking, serving, and gathering. A conveniently located half bath sits near the stairs for added ease. Upstairs, all five bedrooms are thoughtfully arranged alongside the laundry room for easy access. The secondary bedrooms feature carpet flooring, ample closet space, and easy access the secondary bathroom. The primary bedroom offers a relaxing retreat with its own bathroom that features a walk-in shower, walk-in closet, and plenty of room for your personal touches. The Franklin floorplan was created with your lifestyle in mind, offering room to grow, space to gather, and comfort at every turn. Plus, with the included smart home package, you can control and secure your home through the Qolsys smart panel, your smartphone, or even your voice. With its blend of style, convenience, and modern technology, the Franklin is living at its finest. Contact us today to learn more about making the Franklin your new home!
Key facts
- 2 garage spots
- Listed 72 days
Neighborhood map
What this means for you Summary
Snapshot
- This is a 5-bed/2.5-bath single-family listed at $253k. Condition is rated excellent.
Deal economics
- At list price, monthly cash flow is $-229 ($-3k/yr) — negative.
- To cash-flow at today's rent, offer at most $250k (1.4% below list).
- To meet the 1% rule (rent ≥ 1% of price), the offer needs to be $218k (13.7% below list).
- Recommended offer: $218k (13.7% below list) — sets the bar for 1% rule.
- Cap rate 5.3% vs local median 3.6% in Temple — top-decile yield for the area; either an underpriced asset or a hidden risk that comps aren't pricing in. Stress-test before assuming the spread holds.
Location & tenants
- Location reads 75/100 on livability (#122 in TX, #3,814 nationally) — a middle-class / working-renter tenant base. Strengths: cost of living A+, housing A+, health & safety A+; Watch: schools C-, commute C-, crime D+.
- Temple ISD (urban): math 32% / reading 31% proficiency, ranked #590 of 826 in TX (top 71%) — families likely to look elsewhere, expect single-tenant / working-renter base with shorter leases; 66% free/reduced lunch — lower-income household profile, screen leases tightly.
- Market conditions: Rents soft (-0.8%/yr); 1126 active listings in the ZIP; 14 comparable units currently listed for rent nearby; rentals lingering (median 46d on market — plan ~5-8 weeks vacancy on turnover, expect pricing pressure); 50% of comp listings sitting > 30 days — soft ceiling on asking rent; solid renter incomes; 3,222 units permitted in Bell County in 2024 (246 in 5+ unit buildings).
- This rent runs 32% of the median local income ($82k/yr) — at the standard rent-burdened threshold; future hikes will face affordability resistance.
Forward outlook
- Local home prices are declining (-3.0%/yr); year-one equity from $2k of loan paydown is wiped out by about $8k of value loss. Plan a longer hold.
- Bell County population projected at +21% by 2050 — long-run rental-demand tailwind backs the buy-and-hold thesis.
Negotiation context
- It's been on market 72 days — a 6% lower offer ($238k) is reasonable based on typical stale-listing flexibility.
Questions for the listing agent
- What do current leases actually rent for vs. the listed asking? Can we see a recent rent roll and the last 12 months of T-12 income?
- It's been on market 72 days. Have you received any prior offers? Is the seller open to a 14% concession, seller financing, or rate buy-down credit?
- Why hasn't it sold? Are there any deal-killer items the seller is aware of (foundation, flood, title, zoning, code violations)?
- Is there a deadline driving the sale (1031 exchange, divorce, estate, relocation)? That informs how much negotiation room exists.
- Crime grade is D in this area — have there been break-ins, vandalism, or insurance claims at this property in the last 3 years? What carrier currently insures it and at what premium?
- The area grade is low — what's the realistic commute time and amenity access for the typical tenant pool here? Any planned neighborhood developments (good or bad) we should know about?
- What's the average days-on-market for RENTAL listings here right now (not sales)? A rising rental-DOM trend means longer vacancies and softer asking-rent achievability than the comps imply.
- What's the recent tenant-quality profile in this submarket — average credit score on applications, eviction rate, late-payment / NSF rate, and stable-employment percentage? A property-management company in the area should have these aggregated.
- How much new for-sale + rental construction is in the pipeline within 1–3 miles? Heavy new supply typically softens prices + rents 12–24 months out; constrained supply supports both.
Investment metrics
- 1% rule
- 0.77% ✗
- Cap rate
- 5.32%
- Cash-on-cash
- -3.47%
- DSCR
- 0.85
- GRM
- 10.8
CMA / ARV
- ARV (median comp)
- $282,648
- List price
- $252,990
- Delta
- -10.49%
- Verdict
- UNDERPRICED
- Comps
- 20 within 1.0 mi
Show comp detail 12 sales within ~0.75 mi
| Address | Dist | Beds/Ba | Sqft | Sold | Price | $/sf | Match |
|---|---|---|---|---|---|---|---|
| 7429 Garden Glen Dr | 0.49mi | 4/2.0 (-1) | 1,882 (-0%) | 4mo | $279,499 | $149 | 66 |
| 7719 Krenek Tap Dr | 0.48mi | 4/3.0 (-1) | 2,043 (+8%) | 2mo | $309,900 | $152 | 56 |
| 2205 Koppe Tap Ln | 0.44mi | 4/3.0 (-1) | 2,043 (+8%) | 5mo | $305,900 | $150 | 55 |
| 8202 Dominik Dr | 0.69mi | 4/2.0 (-1) | 1,878 (-1%) | 8mo | $274,900 | $146 | 53 |
| 2213 Koppe Tap Ln | 0.45mi | 4/2.0 (-1) | 1,662 (-12%) | 3mo | $268,255 | $161 | 50 |
| 2313 Helena Dr | 0.60mi | 4/3.0 (-1) | 2,043 (+8%) | 3mo | $316,750 | $155 | 49 |
| 7824 Krenek Tap Dr | 0.54mi | 4/3.0 (-1) | 2,043 (+8%) | 8mo | $313,400 | $153 | 48 |
| 2303 Koppe Tap Ln | 0.47mi | 4/2.0 (-1) | 1,662 (-12%) | 4mo | $280,900 | $169 | 48 |
| 8109 Northgate Loop | 0.54mi | 4/2.0 (-1) | 1,690 (-11%) | 4mo | $245,000 | $145 | 46 |
| 7823 Krenek Tap Dr | 0.52mi | 4/2.0 (-1) | 1,662 (-12%) | 5mo | $280,900 | $169 | 44 |
| 1643 Hillside Dr | 0.44mi | 4/2.0 (-1) | 1,610 (-15%) | 4mo | $249,900 | $155 | 44 |
| 1030 Aurora Grove Bnd | 0.61mi | 4/2.0 (-1) | 1,634 (-14%) | 24mo | $290,000 | $177 | 22 |
Match score weights: distance 35% · size 25% · config 20% · recency 20%. Top-matched comps best support the ARV.
Projected returns pro-forma
-3.0% appreciation · 0.0% rent growth · sell at horizon
- IRR
- -25.5%
- Equity multiple
- 0.16×
- Total profit
- $-66,743
- Equity at exit
- $42,144
- IRR
- -35.1%
- Equity multiple
- -0.28×
- Total profit
- $-101,477
- Equity at exit
- $24,438
Cash invested: $79,141 (down + closing). Projections, not guarantees.
Landlord ↔ Tenant lean methodology
- Overall (STATE)
- 87 Strongly Landlord-Friendly
- State Texas
- 87 Strongly Landlord-Friendly · R+5
- County
- — inherits STATE
- City
- — inherits STATE
ZIP-level market 76502
- Rents YoY
- -0.8%
- Active inventory
- 1126
- Price-to-rent
- 9.7×
Monthly cashflow live
- Estimated rent
- $2,183 high interval (Pro) →
- Mortgage (P&I)
- −$1,482
- Tax est. 1.5%
- −$353 /mo · $4,240/yr
- Insurance
- −$118
- HOA
- −$0
- Vacancy / Maint / Mgmt
- −$458
- Net cashflow
- $-229
Break-even live
Sensitivity live
| Price | -10% $-34 | -5% $-131 | +0% $-229 | +5% $-327 | +10% $-424 |
|---|---|---|---|---|---|
| Rent | -10% $-401 | -5% $-315 | +0% $-229 | +5% $-143 | +10% $-56 |
| Rate | -1.0pp $-87 | -0.5pp $-157 | base $-229 | +0.5pp $-302 | +1.0pp $-377 |
UW: 25.0% down · 7.5% · 30yr · 1.5% tax · 5.0% vac · 8.0% maint · 8.0% mgmt
Financing live
Cash to close
- Down payment
- $70,662
- Closing costs
- $8,479
- Reserves months
- —
- Total cash needed
- —
Loan-product check · same deal, 3 products live
Conventional
25% down · 7.5% · 30yr
- Down + closing
- —
- Monthly P&I
- —
- Monthly cashflow
- —
- DSCR
- —
- Eligible?
- —
Personal DTI + credit; lowest rate.
DSCR
20% down · 8.5% · 30yr
- Down + closing
- —
- Monthly P&I
- —
- Monthly cashflow
- —
- DSCR
- —
- Eligible?
- —
No personal income docs; deal must DSCR.
Hard money
10% down · 12.0% · 12mo
- Down + closing
- —
- Monthly P&I
- —
- Monthly cashflow
- —
- DSCR
- —
- Eligible?
- —
Short-term bridge; refi at stabilization.
Rent comps 14 comps
| Address | Beds | Baths | Sqft | Rent | $/sqft | DOM | Units | Dist |
|---|---|---|---|---|---|---|---|---|
| 7809 Montclair Dr Temple, TX | 4.0 | 2.0 | 1818 | $1,875 | $1.03 | 25d | 1 | 0.43mi |
| 2231 Hornbeam St Temple, TX | 4.0 | 2.0 | 1639 | $2,123 | $1.30 | 23d | 1 | 0.87mi |
| 2204 Hornbeam St Temple, TX | 4.0 | 3.0 | 2012 | $2,123 | $1.06 | 45d | 1 | 0.88mi |
| 8515 Chena Ridge Dr Temple, TX | 4.0 | 2.0 | 1700 | $2,100 | $1.24 | 15d | 1 | 0.92mi |
| 8015 Pineridge Way Temple, TX | 4.0 | 2.0 | 1700 | $1,850 | $1.09 | 45d | 1 | 0.98mi |
| 8614 Glade Dr Temple, TX | 4.0 | 2.0 | 1552 | $3,200 | $2.06 | 45d | 1 | 0.98mi |
| 917 Hollyhock Dr Temple, TX | 4.0 | 2.0 | 1600 | $1,900 | $1.19 | 15d | 1 | 1.00mi |
| 717 Hollyhock Dr Temple, TX | 4.0 | 3.0 | 2612 | $2,495 | $0.96 | 15d | 1 | 1.07mi |
| 1211 Fawn Lily Dr Temple, TX | 4.0 | 2.5 | 2077 | $2,145 | $1.03 | 15d | 1 | 1.09mi |
| 8612 Cantera Ridge Rd Temple, TX | 4.0 | 2.0 | 1800 | $1,895 | $1.05 | 25d | 1 | 1.36mi |
| 1129 Stone Valley Rd Unit B Temple, TX | 4.0 | 2.0 | 1479 | $1,699 | $1.15 | 45d | 1 | 1.39mi |
| 1119 Stone Valley Rd Unit B Temple, TX | 4.0 | 2.0 | 1479 | $1,699 | $1.15 | 45d | 1 | 1.41mi |
| 1012 Ribeye Rd Temple, TX | 4.0 | 2.0 | 1612 | $1,850 | $1.15 | 45d | 1 | 1.42mi |
| 1126 Stone Valley Rd Unit A Temple, TX | 4.0 | 2.0 | 1479 | $1,800 | $1.22 | 45d | 1 | 1.43mi |
Listing history 16 events
-
2026-06-22days on market $252,990 Active 72 DOM
-
2026-06-18days on market $252,990 Active 69 DOM
-
2026-06-17days on market $252,990 Active 68 DOM
-
2026-06-16days on market $252,990 Active 67 DOM
-
2026-06-15days on market $252,990 Active 66 DOM
-
2026-06-14days on market $252,990 Active 64 DOM
-
2026-06-10days on market $252,990 Active 61 DOM
-
2026-06-09days on market $252,990 Active 60 DOM
-
2026-06-08days on market $252,990 Active 59 DOM
-
2026-06-07days on market $252,990 Active 58 DOM
-
2026-06-03days on market $252,990 Active 54 DOM
-
2026-06-02days on market $252,990 Active 53 DOM
-
2026-06-01days on market $252,990 Active 52 DOM
-
2026-05-31days on market $252,990 Active 51 DOM
-
2026-05-30days on market $252,990 Active 50 DOM
-
2026-04-10$252,990 Active 1428-char remark
Show marketing remark (1428 chars)
Step into the stunning Franklin floorplan at Pepper Creek Crossing in Jarrell, Texas. Featuring 5 bedrooms, 2.5 bathrooms, and approximately 1,892 sq. ft. of meticulously crafted living space, this home is perfect for you. On the first floor, you'll find a spacious, open concept living area ideal for entertaining guests or enjoying family time. The beautifully designed kitchen is the heart of the home, showcasing a large island, sleek stainless-steel appliances, and generous counter space-perfect for cooking, serving, and gathering. A conveniently located half bath sits near the stairs for added ease. Upstairs, all five bedrooms are thoughtfully arranged alongside the laundry room for easy access. The secondary bedrooms feature carpet flooring, ample closet space, and easy access the secondary bathroom. The primary bedroom offers a relaxing retreat with its own bathroom that features a walk-in shower, walk-in closet, and plenty of room for your personal touches. The Franklin floorplan was created with your lifestyle in mind, offering room to grow, space to gather, and comfort at every turn. Plus, with the included smart home package, you can control and secure your home through the Qolsys smart panel, your smartphone, or even your voice. With its blend of style, convenience, and modern technology, the Franklin is living at its finest. Contact us today to learn more about making the Franklin your new home!
ⓘ Source: listings_history table (triggers on properties + properties_extension) + one-shot
backfill from property_details.listing_events for pre-trigger history.
Nearby sold comps map
Loading sold comps map…
Walkable amenities ~0.75 mi
Loading nearby amenities…
Taxation est. · year 1
- Rental income
- $26,194
- − Mortgage interest
- −$15,833
- − Property taxes
- −$4,240
- − Insurance
- −$1,413
- − Repairs & maintenance
- −$2,096
- − Management
- −$2,096
- − Depreciation
- −$8,222
- Taxable loss
- −$7,705
- Est. tax savings @ 24.0%
- +$1,849
- After-tax cash flow
- $-897/yr
For passive investors: Depreciation is non-cash, so a rental often shows a tax loss while cash-flowing — sheltering income. Rental losses are passive: they offset passive income freely, and up to $25,000/yr can offset ordinary (W-2) income if you actively participate and your MAGI is under $100k (phasing out to $0 by $150k); unused losses carry forward. On sale, claimed depreciation is recaptured at up to 25%, and gains may owe capital-gains tax (a 1031 exchange can defer both). Figures are a year-1 estimate at your 24.0% rate — not tax advice; consult a CPA.
Condition & rehab AI · 1 photo
This Franklin Plan home in Temple, TX is in excellent condition with no visible repairs needed. It offers a good return on investment with updates to the exterior and interior that can significantly increase its value.
Value-add opportunities
- Both Painting the exterior siding — Enhances curb appeal and can increase both resale and rental value.
- Both Landscaping improvements — Enhances curb appeal and can increase both resale and rental value.
- Resale Kitchen appliances upgrade — Modernizes the kitchen and can attract more buyers.
- Resale Bathroom updates — Modernizes the bathrooms and can attract more buyers.
Renovation cost estimate screening
Value-add ROI direction
- Both Painting the exterior siding — Enhances curb appeal and can increase both resale and rental value. ↑
- Both Landscaping improvements — Enhances curb appeal and can increase both resale and rental value. ↑
- Resale Kitchen appliances upgrade — Modernizes the kitchen and can attract more buyers. ↑
- Resale Bathroom updates — Modernizes the bathrooms and can attract more buyers. ↑
ⓘ Cost ranges are severity-bucket heuristics (US national rule-of-thumb). Get contractor quotes + a written scope before underwriting a rehab budget.
Schools (NCES district)
- District
- Temple ISD
- NCES district ID
- 4842330
- Math proficiency
- 32% ▼ -8.00%
- Reading proficiency
- 31% ▼ -4.00%
- Median HH income
- $43,120
- Composite
- 26.8/100
- National rank
- #7123
- State rank
- #590 of 826 in TX
Livability — Temple
- Score
- 75/100
- State rank
- #122
- US rank
- #3814
Category grades
Schools grade is shown separately in the Schools card above.
Census & demographics
- Census place
- Temple, TX
- County
- Bell County · 345,090 people
- City population
- 96,587
- Metro
- Killeen-Temple, TX
- Population (ZIP)
- 52,669
- Household income
- $82,088
- Rent vs Own
- Severe rent burden
- 1890.0
Population outlook (Bell County) Hauer SSP2
- Today (2025)
- 371,114 people
- By 2030
- 389,104 · +4.8%
- By 2040
- 420,592 · +13.3%
- By 2050
- 447,779 · +20.7%
- By 2075
- 499,130 · +34.5%
- By 2100
- 505,680 · +36.3%
Race, ethnicity, and origin ACS 2023
- Neighborhood character
- Diverse neighborhood (Simpson 0.59)
- Race & ethnicity
- White 58% Hispanic / Latino 26% Two or more races 15% Black 9% Asian 3%
- Hispanic origin (detail)
- Mexican 21% Puerto Rican 2%
- Common ancestry
- Italian 2% Slovak 2% Serbian 1%
- Foreign-born
- 7% · Canada, South Korea, China
- Languages at home
- 86% English-only · Spanish 10% Other Indo-European 1% Korean 1%
Political lean MEDSL · Bell
- 2024 margin
- R (+16.2) · D 41.3% · R 57.6% · Other 1.1%
- 2008→2024 swing
- -6.5pp toward R · 2008: -9.8pp · 2024: -16.2pp
- All cycles
- 2024: R+16.2 2020: R+8.5 2016: R+15.1 2012: R+16.4 2008: R+9.8
Not yet ingested
- Civics
- —
Market trends
- HPI YoY
- ▼ -216.80%
- Current HPI
- 166.927
- Rent YoY
- ▼ -0.79%
- Metro
- Killeen-Temple, TX
- State GDP YoY
- ▲ 3.95%
- F500 in state
- 110
Industry mix (Fortune 500 HQ in TX)
| Industry | F500 HQs | Revenue |
|---|---|---|
| Energy | 16 | $1,198B |
|
||
| Technology | 5 | $198B |
|
||
| Engineering / Construction | 4 | $72B |
|
||
| Energy Services | 3 | $60B |
|
||
| Utilities | 3 | $41B |
|
||
| Healthcare | 2 | $330B |
|
||
Price history
1 event — show timeline
- 2026-04-10 Listed $252,990 Zillow
Cash-flow waterfall
monthlySold comps — $/sqft
last 12 mo · ≤1 miLoading sold comps…