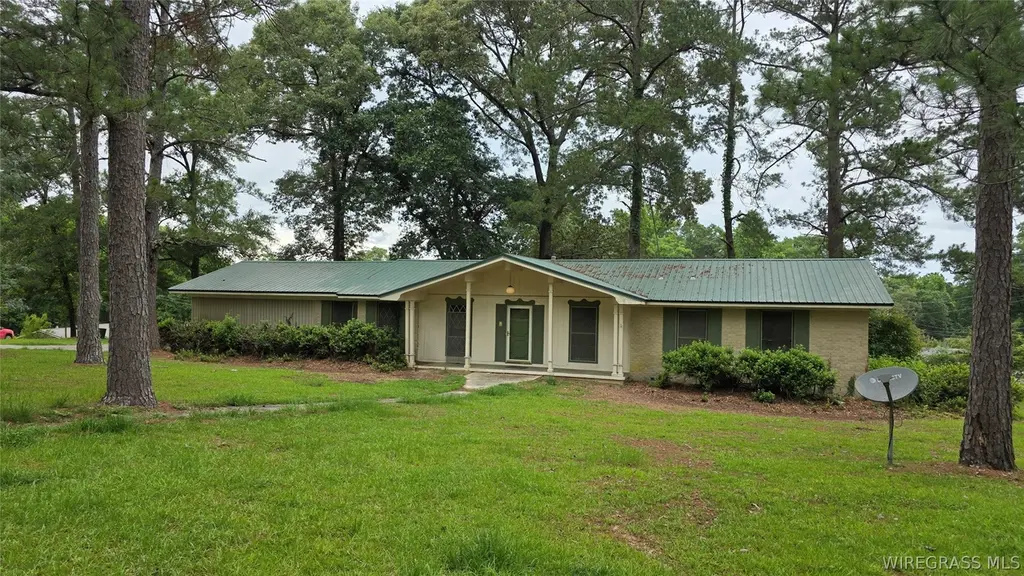
29 Woodland Ct · Daleville, AL
Flood risk 1/10 · Minimal
- FEMA flood zone
- X (unshaded)
- Chance of flooding over 30 yrs
- 0.0%
- Est. flood insurance / yr
- $507 – $1,088
Fire risk 4/10 · Minor
- Est. fire insurance / yr
- $916 – $1,700
Heat risk 8/10 · Major
- Hot days now (above 106°F)
- 7 days/yr
- Hot days in 30 yrs
- 19 days/yr
Wind risk 8/10 · Major
- Chance of severe wind over 30 yrs
- 99.0%
Air-quality risk 1/10 · Minimal
- Unhealthy air days now
- 0 days/yr
- Unhealthy air days in 30 yrs
- 0 days/yr
Risk factors via First Street. Map © Google.
Why this score? — see what drove the A grade
The composite is a weighted blend of 9 inputs, each scored 0–100. Each bar is that input's sub-score; the figure is the points it added to the 100-point composite (weight × sub-score).
- Cash flow +30.0/30.0
- ARV discount +15.0/15.0
- 1% rule +10.0/10.0
- DSCR +10.0/10.0
- Appreciation +10.0/10.0
- Livability +3.1/5.0
- Rent growth +2.5/5.0
- Condition / age +2.5/5.0
- Schools +2.0/10.0
$87,900
🖨 Deal sheet 📄 Offer letter ✓ Due diligence
Listing remarks
Wonderful investment or flip opportunity in the Ft. Rucker area! Or the chance to remodel and create your dream home from a house built with great bones. Bring your tools and ideas to create your new masterpiece! This home was built with love & integrity by the current owners grandfather, an Army helicopter pilot and flight trainer who watched over every aspect of it's build to ensure the best quality build. Situated on a 1/2 acre lot, this 4 Bedroom 2 Bath features a large living room, spacious eat in kitchen with all appliances and plenty of counter space, a formal dining room with views of the patio and back yard, 3 spacious bedrooms and a smaller room great for a nursery or h
Key facts
- Formal dining room
- 1/2 acre lot
- Large living room
Tags
Property features AI
Exterior
- Parking: Attached carport; 2-car carport; Driveway; Parking pad
- Utilities: Public water; Public sewer; Electricity available; Cable available
- Home design: Single-family residence; One level; Brick construction
- Construction: Brick construction
- Exterior features: Level topography; City lot; Corner lot; Paved road access
Interior
- Kitchen: Dishwasher; Electric cooktop; Electric oven; Electric range; Range hood; Refrigerator; Electric water heater
- Flooring: Carpet; Vinyl; Wood
- Bathrooms: 2 full bathrooms
- Heating & cooling: Central heating; Hot water heating; Electric heating; Central air conditioning; Electric cooling; Heat pump
- Interior features: Storage; Patio; Fenced yard (full)
- Laundry & utility: Washer hookup
Neighborhood map
What this means for you Summary
Snapshot
- This is a 4-bed/1.0-bath single-family listed at $88k.
Deal economics
- At list price, monthly cash flow is $580 ($7k/yr) — positive.
- The deal already cash-flows at list — no discount required.
- Meets the 1% rule at list price ($1k rent vs $88k).
- Cap rate 14.2% vs local median 6.5% in Daleville — top-decile yield for the area; either an underpriced asset or a hidden risk that comps aren't pricing in. Stress-test before assuming the spread holds.
Location & tenants
- Location reads 61/100 on livability (#278 in AL) — a middle-class / working-renter tenant base. Strengths: cost of living A+, housing A-; Watch: health & safety D, schools F, amenities F.
- Daleville City (town): math 9% / reading 37% proficiency, ranked #97 of 129 in AL (top 75%) — low school quality limits family demand, transient renter base, plan for 1-2y turnover; 62% free/reduced lunch — lower-income household profile, screen leases tightly.
- Market conditions: 41 active listings in the ZIP; 38 units permitted in Dale County in 2024 (0 in 5+ unit buildings).
- This rent runs 38% of the median local income ($47k/yr) — at the standard rent-burdened threshold; future hikes will face affordability resistance.
Forward outlook
- In year one you build about $9k of equity ($608 loan paydown + $9k appreciation (10.0% local appreciation)).
- Dale County population projected at -20% by 2050 — secular population decline; favor cash flow + early exit over multi-decade hold.
- At projected returns (10.0% appreciation + 3.0% rent growth), your $25k cash investment doubles in ~2 years — after that, you're playing with house money.
- By year 4, paydown + projected appreciation supports a ~$33k cash-out refi (75% LTV) — recoverable capital for the next deal without selling this one.
Negotiation context
- Only 3 days on market — expect competitive offers; lowballing is unlikely to land.
Risks & watch-outs
- Climate carrying-cost: severe wind risk, 99% chance of damaging wind over 30y; extreme-heat days projected 7→19/yr by 2055 (HVAC capex compounding) — expect insurance premiums to compound above CPI over the hold.
Questions for the listing agent
- Built in 1968 — when were the roof, HVAC, electrical panel, plumbing, and water heater last replaced?
- Is there a deadline driving the sale (1031 exchange, divorce, estate, relocation)? That informs how much negotiation room exists.
- Schools are F-rated, which usually means shorter tenancies and higher turnover. Who's the typical renter profile here, and what's been the actual vacancy rate?
- What's the average days-on-market for RENTAL listings here right now (not sales)? A rising rental-DOM trend means longer vacancies and softer asking-rent achievability than the comps imply.
- What's the recent tenant-quality profile in this submarket — average credit score on applications, eviction rate, late-payment / NSF rate, and stable-employment percentage? A property-management company in the area should have these aggregated.
- How much new for-sale + rental construction is in the pipeline within 1–3 miles? Heavy new supply typically softens prices + rents 12–24 months out; constrained supply supports both.
Investment metrics
- 1% rule
- 1.68% ✓
- Cap rate
- 14.21%
- Cash-on-cash
- 28.27%
- DSCR
- 2.26
- GRM
- 5.0
CMA / ARV
- ARV (on-the-fly)
- $169,800
- Comps found
- 12
Show comp detail 12 sales within ~0.75 mi
| Address | Dist | Beds/Ba | Sqft | Sold | Price | $/sf | Match |
|---|---|---|---|---|---|---|---|
| 127 Fairview Ln | 0.08mi | 3/2.0 (-1) | 1,540 (-9%) | 7mo | $135,000 | $88 | 66 |
| 3 Meadow Dr | 0.14mi | 3/2.0 (-1) | 1,473 (-13%) | 4mo | $238,000 | $162 | 59 |
| 3 Brown Ave | 0.59mi | 4/3.0 | 1,686 (-1%) | 5mo | $185,000 | $110 | 59 |
| 25 Andrews Dr | 0.62mi | 3/2.0 (-1) | 1,702 (+0%) | 11mo | $172,000 | $101 | 53 |
| 26 Goff St | 0.41mi | 3/2.0 (-1) | 1,905 (+12%) | 2mo | $190,000 | $100 | 50 |
| 47 Andrews Dr | 0.57mi | 3/2.0 (-1) | 1,732 (+2%) | 14mo | $163,000 | $94 | 50 |
| 15 Hall St | 0.65mi | 3/2.0 (-1) | 1,609 (-5%) | 4mo | $175,000 | $109 | 48 |
| 21 Hall St | 0.60mi | 3/2.0 (-1) | 1,836 (+8%) | 6mo | $95,000 | $52 | 45 |
| 50 Richardson Dr | 0.48mi | 3/2.5 (-1) | 1,816 (+7%) | 14mo | $150,000 | $83 | 43 |
| 16 Wells Ave | 0.64mi | 3/2.5 (-1) | 1,786 (+5%) | 13mo | $141,000 | $79 | 40 |
| 39 Andrews Dr | 0.53mi | 3/2.5 (-1) | 1,922 (+13%) | 10mo | $145,000 | $75 | 34 |
| 65 Andrews Dr | 0.71mi | 3/2.0 (-1) | 1,842 (+8%) | 12mo | $184,900 | $100 | 34 |
Match score weights: distance 35% · size 25% · config 20% · recency 20%. Top-matched comps best support the ARV.
Projected returns pro-forma
10.0% appreciation · 3.0% rent growth · sell at horizon
- IRR
- 45.7%
- Equity multiple
- 4.45×
- Total profit
- $84,818
- Equity at exit
- $79,187
- IRR
- 39.7%
- Equity multiple
- 9.97×
- Total profit
- $220,751
- Equity at exit
- $170,770
Cash invested: $24,612 (down + closing). Projections, not guarantees.
Landlord ↔ Tenant lean methodology
- Overall (STATE)
- 90 Strongly Landlord-Friendly
- State Alabama
- 90 Strongly Landlord-Friendly · R+15
- County
- — inherits STATE
- City
- — inherits STATE
ZIP-level market 36322
- Home prices YoY
- 31.4%
- Active inventory
- 41
- Price-to-rent
- 5.0×
Monthly cashflow live
- Estimated rent
- $1,480 medium interval (Pro) →
- Mortgage (P&I)
- −$461
- Tax from tax record
- −$91 /mo · $1,097/yr
- Insurance
- −$37
- HOA
- −$0
- Vacancy / Maint / Mgmt
- −$311
- Net cashflow
- $580
Break-even live
UW: 25.0% down · 7.5% · 30yr · 1.5% tax · 5.0% vac · 8.0% maint · 8.0% mgmt
Financing live
Cash to close
- Down payment
- $21,975
- Closing costs
- $2,637
- Reserves months
- —
- Total cash needed
- —
Loan-product check · same deal, 3 products live
Conventional
25% down · 7.5% · 30yr
- Down + closing
- —
- Monthly P&I
- —
- Monthly cashflow
- —
- DSCR
- —
- Eligible?
- —
Personal DTI + credit; lowest rate.
DSCR
20% down · 8.5% · 30yr
- Down + closing
- —
- Monthly P&I
- —
- Monthly cashflow
- —
- DSCR
- —
- Eligible?
- —
No personal income docs; deal must DSCR.
Hard money
10% down · 12.0% · 12mo
- Down + closing
- —
- Monthly P&I
- —
- Monthly cashflow
- —
- DSCR
- —
- Eligible?
- —
Short-term bridge; refi at stabilization.
Listing history 4 events
-
2026-06-07statusdays on market $87,900 Pending 3 DOM
-
2026-06-05days on market $87,900 Active 2 DOM
-
2026-06-03remarks 695-char remark
-
2026-06-03$87,900 Active 1 DOM
ⓘ Source: listings_history table (triggers on properties + properties_extension) + one-shot
backfill from property_details.listing_events for pre-trigger history.
Tax reassessment forecast AL · Resets to sale price
- Current annual tax
- $1,097 · $91/mo
- Projected year-2 tax
- $1,097 · $91/mo
- Expected delta
- $0/yr ($0/mo · 0.0%)
ⓘ Screening estimate from a state-policy table — verify with the county assessor before closing.
Climate risk First Street
- Flood 1/10 Low FEMA zone X (unshaded) · 0% chance over 30 yrs
- Wildfire 4/10 Moderate
- Heat 8/10 Severe 7 d/yr ≥106°F today · 19 d/yr by 30 yrs out
- Wind 8/10 Severe 99% chance of damaging wind over 30 yrs
- Air quality 1/10 Low 0 unhealthy d/yr today · 0 by 30 yrs out
Nearby sold comps map
Loading sold comps map…
Walkable amenities ~0.75 mi
Loading nearby amenities…
Taxation est. · year 1
- Rental income
- $17,756
- − Mortgage interest
- −$4,924
- − Property taxes
- −$1,097
- − Insurance
- −$440
- − Repairs & maintenance
- −$1,420
- − Management
- −$1,420
- − Depreciation
- −$2,557
- Taxable income
- $5,897
- Est. tax owed @ 24.0%
- −$1,415
- After-tax cash flow
- $5,543/yr
For passive investors: Depreciation is non-cash, so a rental often shows a tax loss while cash-flowing — sheltering income. Rental losses are passive: they offset passive income freely, and up to $25,000/yr can offset ordinary (W-2) income if you actively participate and your MAGI is under $100k (phasing out to $0 by $150k); unused losses carry forward. On sale, claimed depreciation is recaptured at up to 25%, and gains may owe capital-gains tax (a 1031 exchange can defer both). Figures are a year-1 estimate at your 24.0% rate — not tax advice; consult a CPA.
Schools (NCES district)
- District
- Daleville City
- NCES district ID
- 0101080
- Math proficiency
- 9% ▼ -18.00%
- Reading proficiency
- 37% ▲ 1.00%
- Median HH income
- $45,865
- Composite
- 19.89/100
- National rank
- #8687
- State rank
- #97 of 129 in AL
Livability — Daleville
- Score
- 61/100
- State rank
- #278
- US rank
- #18463
Category grades
Schools grade is shown separately in the Schools card above.
Census & demographics
- Census place
- Daleville, AL
- County
- Dale County · 7,959 people
- City population
- 7,740
- Metro
- Ozark, AL
- Population (ZIP)
- 7,959
- Household income
- $47,276
- Rent vs Own
- Severe rent burden
- 115.0
Population outlook (Dale County) Hauer SSP2
- Today (2025)
- 46,805 people
- By 2030
- 45,176 · -3.5%
- By 2040
- 41,523 · -11.3%
- By 2050
- 37,575 · -19.7%
- By 2075
- 28,931 · -38.2%
- By 2100
- 22,172 · -52.6%
Race, ethnicity, and origin ACS 2023
- Neighborhood character
- Diverse neighborhood (Simpson 0.59)
- Race & ethnicity
- White 59% Black 23% Two or more races 9% Hispanic / Latino 7% Asian 2% Native American 1%
- Hispanic origin (detail)
- Mexican 4% Puerto Rican 3%
- Common ancestry
- Lithuanian 3% Italian 2% Slovak 1%
- Foreign-born
- 5% · South Korea, China, Canada
- Languages at home
- 92% English-only · Spanish 4% Other Indo-European 1% Korean 1%
Political lean MEDSL · Dale
- 2024 margin
- Solid R (+52.3) · D 23.5% · R 75.8%
- 2008→2024 swing
- -7.7pp toward R · 2008: -44.6pp · 2024: -52.3pp
- All cycles
- 2024: R+52.3 2020: R+46.3 2016: R+50.4 2012: R+42.2 2008: R+44.6
Not yet ingested
- Civics
- —
Market trends
- HPI YoY
- ▲ 49.15%
- Current HPI
- 205.6
- Rent YoY
- —
- Metro
- Ozark, AL
- State GDP YoY
- ▲ 2.94%
- F500 in state
- 4
Industry mix (Fortune 500 HQ in AL)
| Industry | F500 HQs | Revenue |
|---|---|---|
| Financial Services | 1 | $8B |
|
||
| Healthcare | 1 | $5B |
|
||
Price history
1 event — show timeline
- 2026-06-02 Listed $87,900 WBR
Property tax history
+4.0%/yrLatest (2025): $1,097 · +6.8% YoY. Source: county tax records.
Cash-flow waterfall
monthlySold comps — $/sqft
last 12 mo · ≤1 miLoading sold comps…