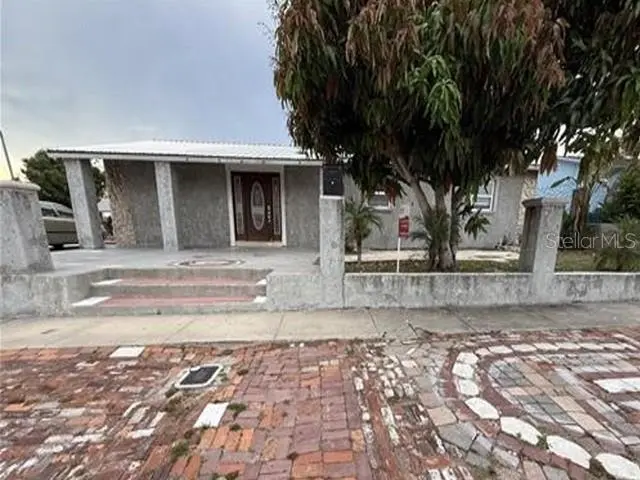
1129 SW Golden Ave · Arcadia, FL
Flood risk 1/10 · Minimal
- FEMA flood zone
- X (unshaded)
- Chance of flooding over 30 yrs
- 0.0%
- Est. flood insurance / yr
- $507 – $1,088
Fire risk 5/10 · Moderate
- Est. fire insurance / yr
- $947 – $1,759
Heat risk 9/10 · Severe
- Hot days now (above 108°F)
- 7 days/yr
- Hot days in 30 yrs
- 27 days/yr
Wind risk 10/10 · Severe
- Chance of severe wind over 30 yrs
- 99.0%
Air-quality risk 2/10 · Minimal
- Unhealthy air days now
- 2 days/yr
- Unhealthy air days in 30 yrs
- 2 days/yr
Risk factors via First Street. Map © Google.
Why this score? — see what drove the C grade
The composite is a weighted blend of 9 inputs, each scored 0–100. Each bar is that input's sub-score; the figure is the points it added to the 100-point composite (weight × sub-score).
- Cash flow +19.2/30.0
- ARV discount +15.0/15.0
- DSCR +6.1/10.0
- 1% rule +5.9/10.0
- Livability +3.6/5.0
- Schools +2.6/10.0
- Rent growth +2.5/5.0
- Condition / age +2.5/5.0
- Appreciation +0.0/10.0
$125,200
🖨 Deal sheet 📄 Offer letter ✓ Due diligence
Listing remarks
Opportunity awaits with this solid, metal-roof home located in the heart of Arcadia, just a few blocks from Louise Anderson Park. Offering a stately presence and distinctive architectural character, this property provides a strong foundation for renovation and restoration. The interior reflects deferred maintenance and will require repairs and updates, making it ideal for investors, renovators, or buyers seeking a value-add project. Discover the charm of DeSoto County, known for its citrus groves, ranches, agricultural heritage, and popular downtown antique shops. Conveniently located within the town of Arcadia with access to parks, shopping, and local amenities. Priced to reflect condition
Key facts
- 6,534 sq ft lot
- Built 1972
- Listed 9 days
Property features AI
Finance
- Other: Zoning: RMF-6; Lot approximately 0.15 acres (dimensions 75x51x103x121); Public maintained paved road access
- HOA & community: No HOA association; Community amenities: park, playground; Pets allowed
Exterior
- Parking: Driveway; Open parking; Parking pad
- Utilities: Public water; Public sewer; Electricity connected; Sewer connected
- Home design: Single family residence; One story; Facing southeast; Completed condition
- Construction: Block construction; Metal roof; Slab foundation; Built on one level
- Exterior features: Front porch; Patio; Outdoor lighting; Located on a paved cul-de-sac lot; City limits; Sidewalks
Interior
- Kitchen: No built-in appliances included
- Bedrooms: 3 bedrooms
- Flooring: Concrete; Laminate; Tile
- Bathrooms: 1 full bathroom
- Heating & cooling: Central heating (electric); Central air conditioning
- Interior features: Ceiling fans; Eat-in kitchen; Open floor plan
- Laundry & utility: Interior laundry
Neighborhood map
What this means for you Summary
Snapshot
- This is a 3-bed/1.0-bath single-family listed at $125k.
Deal economics
- At list price, monthly cash flow is $135 ($2k/yr) — positive.
- The deal already cash-flows at list — no discount required.
- Meets the 1% rule at list price ($1k rent vs $125k).
- Cap rate 7.6% vs local median 3.5% in Arcadia — top-decile yield for the area; either an underpriced asset or a hidden risk that comps aren't pricing in. Stress-test before assuming the spread holds.
Location & tenants
- Location reads 72/100 on livability (#345 in FL) — a middle-class / working-renter tenant base. Strengths: cost of living A+, housing A+, health & safety A+; Watch: crime D, amenities F, commute F.
- Desoto (town): math 31% / reading 32% proficiency, ranked #69 of 73 in FL (top 94%) — families likely to look elsewhere, expect single-tenant / working-renter base with shorter leases; 71% free/reduced lunch — lower-income household profile, screen leases tightly.
- Zoned schools: Desoto County High School (math 26% / reading 33%, grade F, #447 of 667 statewide, top 68%, 1,244 students, 67% FRL) — zoned schools at 67% FRL track the district average.
- Market conditions: 207 active listings in the ZIP; 5 comparable units currently listed for rent nearby; rentals at typical pace (median 21d on market — plan ~3-4 weeks tenant-placement turnaround); 71 units permitted in DeSoto County in 2024 (0 in 5+ unit buildings).
Forward outlook
- Local home prices are declining (-3.0%/yr); year-one equity from $866 of loan paydown is wiped out by about $4k of value loss. Plan a longer hold.
- DeSoto County population projected at -10% by 2050 — secular population decline; favor cash flow + early exit over multi-decade hold.
Negotiation context
- Only 9 days on market — expect competitive offers; lowballing is unlikely to land.
- Current owner paid $20k; list at $125k implies a 542% gain — meaningful room to come down on a strong offer.
Risks & watch-outs
- Climate carrying-cost: severe wind risk, 99% chance of damaging wind over 30y; moderate wildfire risk; extreme-heat days projected 7→27/yr by 2055 (HVAC capex compounding) — expect insurance premiums to compound above CPI over the hold.
Questions for the listing agent
- Built in 1972 — when were the roof, HVAC, electrical panel, plumbing, and water heater last replaced?
- Is there a deadline driving the sale (1031 exchange, divorce, estate, relocation)? That informs how much negotiation room exists.
- Crime grade is D in this area — have there been break-ins, vandalism, or insurance claims at this property in the last 3 years? What carrier currently insures it and at what premium?
- What's the average days-on-market for RENTAL listings here right now (not sales)? A rising rental-DOM trend means longer vacancies and softer asking-rent achievability than the comps imply.
- What's the recent tenant-quality profile in this submarket — average credit score on applications, eviction rate, late-payment / NSF rate, and stable-employment percentage? A property-management company in the area should have these aggregated.
- How much new for-sale + rental construction is in the pipeline within 1–3 miles? Heavy new supply typically softens prices + rents 12–24 months out; constrained supply supports both.
Investment metrics
- 1% rule
- 1.09% ✓
- Cap rate
- 7.58%
- Cash-on-cash
- 4.61%
- DSCR
- 1.21
- GRM
- 7.7
CMA / ARV
- ARV (on-the-fly)
- $192,128
- Comps found
- 10
Show comp detail 10 sales within ~0.75 mi
| Address | Dist | Beds/Ba | Sqft | Sold | Price | $/sf | Match |
|---|---|---|---|---|---|---|---|
| 1436 SW Harlem Cir | 0.21mi | 3/1.0 | 1,200 (-5%) | 4mo | $182,000 | $152 | 79 |
| 219 Alabama Ave | 0.46mi | 3/1.0 | 1,242 (-2%) | 4mo | $45,000 | $36 | 72 |
| 304 Potter Ave | 0.31mi | 4/1.0 (+1) | 1,199 (-5%) | 19mo | $188,000 | $157 | 56 |
| 301 S Dade Ave | 0.67mi | 3/1.0 | 1,200 (-5%) | 10mo | $33,000 | $28 | 52 |
| 1917 SW Hendry St | 0.32mi | 3/2.0 | 1,368 (+8%) | 20mo | $185,000 | $135 | 51 |
| 1556 SW Price Child St | 0.28mi | 3/2.0 | 1,398 (+11%) | 19mo | $286,000 | $205 | 50 |
| 2049 SW Poydras Ave | 0.65mi | 3/1.0 | 1,254 (-1%) | 23mo | $160,000 | $128 | 49 |
| 401 Citrus Ave | 0.64mi | 4/1.5 (+1) | 1,248 (-1%) | 16mo | $70,000 | $56 | 48 |
| 347 S Orange Ave | 0.46mi | 3/2.0 | 1,453 (+15%) | 8mo | $245,000 | $169 | 43 |
| 1038 SE Adel St | 0.72mi | 3/1.5 | 1,390 (+10%) | 22mo | $280,000 | $201 | 30 |
Match score weights: distance 35% · size 25% · config 20% · recency 20%. Top-matched comps best support the ARV.
Projected returns pro-forma
-3.0% appreciation · 3.0% rent growth · sell at horizon
- IRR
- -9.0%
- Equity multiple
- 0.67×
- Total profit
- $-11,636
- Equity at exit
- $18,668
- IRR
- 0.5%
- Equity multiple
- 1.03×
- Total profit
- $1,190
- Equity at exit
- $10,825
Cash invested: $35,056 (down + closing). Projections, not guarantees.
Landlord ↔ Tenant lean methodology
- Overall (STATE)
- 87 Strongly Landlord-Friendly
- State Florida
- 87 Strongly Landlord-Friendly · R+3
- County
- — inherits STATE
- City
- — inherits STATE
ZIP-level market 34266
- Home prices YoY
- -6.1%
- Active inventory
- 207
- Price-to-rent
- 7.7×
Monthly cashflow live
- Estimated rent
- $1,359 high interval (Pro) →
- Mortgage (P&I)
- −$657
- Tax from tax record
- −$230 /mo · $2,762/yr
- Insurance
- −$52
- HOA
- −$0
- Vacancy / Maint / Mgmt
- −$285
- Net cashflow
- $135
Break-even live
UW: 25.0% down · 7.5% · 30yr · 1.5% tax · 5.0% vac · 8.0% maint · 8.0% mgmt
Financing live
Cash to close
- Down payment
- $31,300
- Closing costs
- $3,756
- Reserves months
- —
- Total cash needed
- —
Loan-product check · same deal, 3 products live
Conventional
25% down · 7.5% · 30yr
- Down + closing
- —
- Monthly P&I
- —
- Monthly cashflow
- —
- DSCR
- —
- Eligible?
- —
Personal DTI + credit; lowest rate.
DSCR
20% down · 8.5% · 30yr
- Down + closing
- —
- Monthly P&I
- —
- Monthly cashflow
- —
- DSCR
- —
- Eligible?
- —
No personal income docs; deal must DSCR.
Hard money
10% down · 12.0% · 12mo
- Down + closing
- —
- Monthly P&I
- —
- Monthly cashflow
- —
- DSCR
- —
- Eligible?
- —
Short-term bridge; refi at stabilization.
Rent comps 5 comps
| Address | Beds | Baths | Sqft | Rent | $/sqft | DOM | Units | Dist |
|---|---|---|---|---|---|---|---|---|
| 1836 SW Harlem Cir Arcadia, FL | 2.0 | 1.0 | 889 | $1,300 | $1.46 | 21d | 1 | 0.23mi |
| 45 W Martin Luther King Jr St Arcadia, FL | 2.0–3.0 | 2.0 | 990 | $1,399 | $1.41 | 21d | 3 | 0.41mi |
| 219 Alabama Ave Arcadia, FL | 4.0 | 2.0 | 1242 | $1,500 | $1.21 | 21d | 1 | 0.49mi |
| 1650 SE Hargrave St Arcadia, FL | 1.0–3.0 | 1.0–2.0 | 790 | $1,105 | $1.40 | 13d | 10 | 1.30mi |
| 16 S 12th Ave Arcadia, FL | 3.0 | 2.0 | 1150 | $1,275 | $1.11 | 21d | 1 | 1.36mi |
Listing history 13 events
-
2026-06-18days on market $125,200 Active 9 DOM
-
2026-06-17days on market $125,200 Active 8 DOM
-
2026-06-16days on market $125,200 Active 7 DOM
-
2026-06-15days on market $125,200 Active 6 DOM
-
2026-06-14days on market $125,200 Active 4 DOM
-
2026-06-13days on market $125,200 Active 3 DOM
-
2026-06-10pricedays on market $125,200 Active 1 DOM
-
2026-05-31days on market $136,000 Active 106 DOM
-
2026-05-30days on market $136,000 Active 105 DOM
-
2026-05-08price $136,000
-
2026-04-01price $146,000
-
2026-02-14$156,000 Active
-
1977-08-01soldstatus $19,500
ⓘ Source: listings_history table (triggers on properties + properties_extension) + one-shot
backfill from property_details.listing_events for pre-trigger history.
Tax reassessment forecast FL · Resets to sale price
- Current annual tax
- $2,762 · $230/mo
- Projected year-2 tax
- $2,762 · $230/mo
- Expected delta
- $0/yr ($0/mo · 0.0%)
ⓘ Screening estimate from a state-policy table — verify with the county assessor before closing.
Climate risk First Street
- Flood 1/10 Low FEMA zone X (unshaded) · 0% chance over 30 yrs
- Wildfire 5/10 Major
- Heat 9/10 Extreme 7 d/yr ≥108°F today · 27 d/yr by 30 yrs out
- Wind 10/10 Extreme 99% chance of damaging wind over 30 yrs
- Air quality 2/10 Low 2 unhealthy d/yr today · 2 by 30 yrs out
Nearby sold comps map
Loading sold comps map…
Walkable amenities ~0.75 mi
Loading nearby amenities…
Taxation est. · year 1
- Rental income
- $16,309
- − Mortgage interest
- −$7,013
- − Property taxes
- −$2,762
- − Insurance
- −$626
- − Repairs & maintenance
- −$1,305
- − Management
- −$1,305
- − Depreciation
- −$3,642
- Taxable loss
- −$344
- Est. tax savings @ 24.0%
- +$82
- After-tax cash flow
- $1,700/yr
For passive investors: Depreciation is non-cash, so a rental often shows a tax loss while cash-flowing — sheltering income. Rental losses are passive: they offset passive income freely, and up to $25,000/yr can offset ordinary (W-2) income if you actively participate and your MAGI is under $100k (phasing out to $0 by $150k); unused losses carry forward. On sale, claimed depreciation is recaptured at up to 25%, and gains may owe capital-gains tax (a 1031 exchange can defer both). Figures are a year-1 estimate at your 24.0% rate — not tax advice; consult a CPA.
Schools (NCES district)
- District
- Desoto
- NCES district ID
- 1200420
- Math proficiency
- 31% ▼ -9.00%
- Reading proficiency
- 32% ▼ -3.00%
- Median HH income
- $35,136
- Composite
- 26.03/100
- National rank
- #7305
- State rank
- #69 of 73 in FL
Livability — Arcadia
- Score
- 72/100
- State rank
- #345
- US rank
- #5983
Category grades
Schools grade is shown separately in the Schools card above.
Census & demographics
- Population (ZIP)
- 29,065
Population outlook (DeSoto County) Hauer SSP2
- Today (2025)
- 34,958 people
- By 2030
- 34,465 · -1.4%
- By 2040
- 33,137 · -5.2%
- By 2050
- 31,273 · -10.5%
- By 2075
- 23,898 · -31.6%
- By 2100
- 15,517 · -55.6%
Race, ethnicity, and origin ACS 2023
- Neighborhood character
- Diverse neighborhood (Simpson 0.61)
- Race & ethnicity
- White 51% Hispanic / Latino 34% Black 13% Two or more races 11%
- Hispanic origin (detail)
- Mexican 26% Puerto Rican 2% Cuban 2%
- Common ancestry
- Lithuanian 2% Italian 2% Slovak 1%
- Foreign-born
- 15% · Canada
- Languages at home
- 76% English-only · Spanish 22% French/Haitian/Cajun 1%
Political lean MEDSL · DeSoto
- 2024 margin
- Solid R (+42.9) · D 28.2% · R 71.2%
- 2008→2024 swing
- -30.6pp toward R · 2008: -12.3pp · 2024: -42.9pp
- All cycles
- 2024: R+42.9 2020: R+32.0 2016: R+27.7 2012: R+14.3 2008: R+12.3
Not yet ingested
- Civics
- —
Market trends
- HPI YoY
- ▼ -26.01%
- Current HPI
- 403.1509
- Rent YoY
- —
- Metro
- —
- State GDP YoY
- ▲ 3.28%
- F500 in state
- 36
Industry mix (Fortune 500 HQ in FL)
| Industry | F500 HQs | Revenue |
|---|---|---|
| Industrial Technology | 2 | $29B |
|
||
| Insurance | 2 | $17B |
|
||
| Retail | 1 | $60B |
|
||
| Technology Distribution | 1 | $58B |
|
||
| Homebuilding | 1 | $35B |
|
||
| Technology Manufacturing | 1 | $35B |
|
||
Price history
+597.4% since first listed4 events — show timeline
- 2026-05-08 Price Changed $136,000 Stellar MLS as Distributed by MLS Grid
- 2026-04-01 Price Changed $146,000 Stellar MLS as Distributed by MLS Grid
- 2026-02-14 Listed $156,000 Stellar MLS as Distributed by MLS Grid
- 1977-08-01 Sold (Public Records) $19,500 Public Records
Property tax history
+11.2%/yrLatest (2025): $2,762 · +3.6% YoY. Source: county tax records.
Cash-flow waterfall
monthlySold comps — $/sqft
last 12 mo · ≤1 miLoading sold comps…