 25-Plex
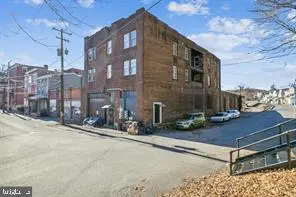
326 W Broad St · Tamaqua, PA
Flood risk 9/10 · Severe
- FEMA flood zone
- AE
- Chance of flooding over 30 yrs
- 0.99%
- Est. flood insurance / yr
- $1,737 – $8,500
Fire risk 3/10 · Minor
- Est. fire insurance / yr
- $511 – $949
Heat risk 4/10 · Minor
- Hot days now (above 95°F)
- 8 days/yr
- Hot days in 30 yrs
- 17 days/yr
Wind risk 4/10 · Minor
- Chance of severe wind over 30 yrs
- 8.0%
Air-quality risk 2/10 · Minimal
- Unhealthy air days now
- 1 days/yr
- Unhealthy air days in 30 yrs
- 2 days/yr
Risk factors via First Street. Map © Google.
Why this score? — see what drove the B grade
The composite is a weighted blend of 9 inputs, each scored 0–100. Each bar is that input's sub-score; the figure is the points it added to the 100-point composite (weight × sub-score).
- Cash flow +30.0/30.0
- 1% rule +10.0/10.0
- DSCR +10.0/10.0
- ARV discount +7.5/15.0
- Livability +4.0/5.0
- Schools +3.6/10.0
- Rent growth +2.5/5.0
- Condition / age +2.5/5.0
- Appreciation +0.0/10.0
$2,000,000
🖨 Deal sheet 📄 Offer letter ✓ Due diligence
Multi-family units
County records classify this as Multi-Family (5+ Unit). Listing-text estimate: 25 units. confirmed
5+ unit building — per-unit beds/baths from public records are typically unavailable; the breakdown below (if shown) is an estimate from the listing text.
Listing remarks
🔥 Investment Opportunity: 7-Property, 25-Unit Portfolio – Fully Renovated, Income-Producing Machine Introducing an exceptional turnkey 7-property portfolio with 25 total units, all properties near each other in Tamaqua, Lansford and Lehighton Pennsylvania. . With most units fully renovated, strong in-place cash flow, and $240,960 in annual income, this is a rare opportunity to scoop up stable, high-yield assets in one cohesive package. 📍 Property Breakdown Address Unit Count 326 W Broad Street 6 Units 200-202 W Bertsch Street 5 Units 134-134.5 Spruce Street 2 Units 6 Cherry Street 1 Unit 34 N Nescopec Street 5 Units 234 Mauch Chunk Street 2 Units 274-276 S 1st Street 4 Units Total 25
Key facts
- 2,178 sq ft lot
- Built 1900
- Listed 317 days
Neighborhood map
What this means for you Summary
Snapshot
- This is a 25 × 2-bed/1-bath units multifamily listed at $2.00M.
Deal economics
- At list price, monthly cash flow is $12k ($139k/yr) — positive. Per door: $463/mo.
- The deal already cash-flows at list — no discount required.
- Meets the 1% rule at list price ($30k rent vs $2.00M).
- Recommended offer: $1.76M (12.0% below list) — sets the bar for market timing.
- Cap rate 13.5% vs local median 6.8% in Tamaqua — top-decile yield for the area; either an underpriced asset or a hidden risk that comps aren't pricing in. Stress-test before assuming the spread holds.
Location & tenants
- Location reads 80/100 on livability (#209 in PA, #1,844 nationally) — a professional / high-income tenant draw. Strengths: amenities A+, cost of living A+, housing A+; Watch: commute D+, employment F.
- Tamaqua Area SD (rural): math 31% / reading 53% proficiency, ranked #331 of 539 in PA (top 61%) — families likely to look elsewhere, expect single-tenant / working-renter base with shorter leases.
- Market conditions: 75 active listings in the ZIP; 169 units permitted in Schuylkill County in 2024 (0 in 5+ unit buildings).
Forward outlook
- Local home prices are declining (-3.0%/yr); year-one equity from $14k of loan paydown is wiped out by about $60k of value loss. Plan a longer hold.
- Schuylkill County population projected at -16% by 2050 — secular population decline; favor cash flow + early exit over multi-decade hold.
- At projected returns (-3.0% appreciation + 3.0% rent growth), your $560k cash investment doubles in ~5 years — after that, you're playing with house money.
Negotiation context
- It's been on market 318 days — a 12% lower offer ($1.76M) is reasonable based on typical stale-listing flexibility.
- 15 sale attempts since 27y ago with the ask held roughly flat each time — persistent listings suggest the price (not the market) is what's stuck; bring a comps-based counter.
- Current owner paid $180k; list at $2.00M implies a 1011% gain — meaningful room to come down on a strong offer.
Risks & watch-outs
- Watch-outs: flood insurance adds $427/mo; built in 1900 — expect roof / HVAC / electrical / plumbing capex.
- Climate carrying-cost: in FEMA flood zone AE (mandatory federal flood insurance) — expect insurance premiums to compound above CPI over the hold.
Questions for the listing agent
- It's been on market 318 days. Have you received any prior offers? Is the seller open to a 12% concession, seller financing, or rate buy-down credit?
- Can we see the unit-by-unit rent roll, current vacancy, and any below-market leases? What's the average tenancy length?
- What capital expenditures (roof, boiler, parking lot, exteriors) have been made in the last 5 years, and what's planned in the next 2?
- Built in 1900 — when were the roof, HVAC, electrical panel, plumbing, and water heater last replaced?
- What's the actual annual flood-insurance premium (NFIP or private), and is the property in a SFHA with mandatory coverage?
- Why hasn't it sold? Are there any deal-killer items the seller is aware of (foundation, flood, title, zoning, code violations)?
- Is there a deadline driving the sale (1031 exchange, divorce, estate, relocation)? That informs how much negotiation room exists.
- What's the average days-on-market for RENTAL listings here right now (not sales)? A rising rental-DOM trend means longer vacancies and softer asking-rent achievability than the comps imply.
- What's the recent tenant-quality profile in this submarket — average credit score on applications, eviction rate, late-payment / NSF rate, and stable-employment percentage? A property-management company in the area should have these aggregated.
- How much new apartment / multifamily construction is in the pipeline within 1–3 miles? Heavy new supply (>2% of stock underway) typically softens rents 12–24 months out; light construction supports rent growth.
Investment metrics
- 1% rule
- 1.50% ✓
- Cap rate
- 13.49%
- Cash-on-cash
- 25.72%
- DSCR
- 2.14
- GRM
- 5.5
CMA / ARV
- ARV (median comp)
- $200,884
- List price
- $2,000,000
- Delta
- 895.60%
- Verdict
- OVERPRICED
- Comps
- 20 within 1.0 mi
Projected returns pro-forma
-3.0% appreciation · 3.0% rent growth · sell at horizon
- IRR
- 18.2%
- Equity multiple
- 1.74×
- Total profit
- $412,544
- Equity at exit
- $298,207
- IRR
- 26.6%
- Equity multiple
- 3.33×
- Total profit
- $1,306,247
- Equity at exit
- $172,923
Cash invested: $560,000 (down + closing). Projections, not guarantees.
Landlord ↔ Tenant lean methodology
- Overall (STATE)
- 62 Landlord-Friendly
- State Pennsylvania
- 62 Landlord-Friendly · EVEN
- County
- — inherits STATE
- City
- — inherits STATE
ZIP-level market 18252
- Home prices YoY
- -15.4%
- Active inventory
- 75
- Price-to-rent
- 138.5×
Monthly cashflow live
- Estimated rent
- $30,085 high interval (Pro) →
- Mortgage (P&I)
- −$10,488
- Tax from tax record
- −$445 /mo · $5,336/yr
- Insurance
- −$833
- Flood insurance flood zone
- −$427 /mo · $5,118/yr
- HOA
- −$0
- Vacancy / Maint / Mgmt
- −$6,318
- Net cashflow
- $11,574
Break-even live
25-unit breakdown (identical units grouped — click to expand)
| Units | Beds | Baths | Est. rent |
|---|---|---|---|
| 25× units | 2 | 1 | $30,075 |
| #1 | 2 | 1 | $1,203 |
| #2 | 2 | 1 | $1,203 |
| #3 | 2 | 1 | $1,203 |
| #4 | 2 | 1 | $1,203 |
| #5 | 2 | 1 | $1,203 |
| #6 | 2 | 1 | $1,203 |
| #7 | 2 | 1 | $1,203 |
| #8 | 2 | 1 | $1,203 |
| #9 | 2 | 1 | $1,203 |
| #10 | 2 | 1 | $1,203 |
| #11 | 2 | 1 | $1,203 |
| #12 | 2 | 1 | $1,203 |
| #13 | 2 | 1 | $1,203 |
| #14 | 2 | 1 | $1,203 |
| #15 | 2 | 1 | $1,203 |
| #16 | 2 | 1 | $1,203 |
| #17 | 2 | 1 | $1,203 |
| #18 | 2 | 1 | $1,203 |
| #19 | 2 | 1 | $1,203 |
| #20 | 2 | 1 | $1,203 |
| #21 | 2 | 1 | $1,203 |
| #22 | 2 | 1 | $1,203 |
| #23 | 2 | 1 | $1,203 |
| #24 | 2 | 1 | $1,203 |
| #25 | 2 | 1 | $1,203 |
| Total (25 units) | $30,085 | ||
UW: 25.0% down · 7.5% · 30yr · 1.5% tax · 5.0% vac · 8.0% maint · 8.0% mgmt
Financing live
Cash to close
- Down payment
- $500,000
- Closing costs
- $60,000
- Reserves months
- —
- Total cash needed
- —
Loan-product check · same deal, 3 products live
Conventional
25% down · 7.5% · 30yr
- Down + closing
- —
- Monthly P&I
- —
- Monthly cashflow
- —
- DSCR
- —
- Eligible?
- —
Personal DTI + credit; lowest rate.
DSCR
20% down · 8.5% · 30yr
- Down + closing
- —
- Monthly P&I
- —
- Monthly cashflow
- —
- DSCR
- —
- Eligible?
- —
No personal income docs; deal must DSCR.
Hard money
10% down · 12.0% · 12mo
- Down + closing
- —
- Monthly P&I
- —
- Monthly cashflow
- —
- DSCR
- —
- Eligible?
- —
Short-term bridge; refi at stabilization.
Listing history 48 events
-
2026-06-18days on market $2,000,000 Active 318 DOM
-
2026-06-17days on market $2,000,000 Active 317 DOM
-
2026-06-16days on market $2,000,000 Active 316 DOM
-
2026-06-15days on market $2,000,000 Active 315 DOM
-
2026-06-13days on market $2,000,000 Active 313 DOM
-
2026-06-12days on market $2,000,000 Active 312 DOM
-
2026-06-09days on market $2,000,000 Active 309 DOM
-
2026-06-08days on market $2,000,000 Active 308 DOM
-
2026-06-08days on market $2,000,000 Active 307 DOM
-
2026-06-07days on market $2,000,000 Active 306 DOM
-
2026-06-04days on market $2,000,000 Active 303 DOM
-
2026-06-02days on market $2,000,000 Active 302 DOM
-
2026-06-01days on market $2,000,000 Active 301 DOM
-
2026-05-31days on market $2,000,000 Active 300 DOM
-
2025-08-04$2,000,000 Active
-
2023-04-06soldstatus $180,000
-
2022-12-06historical
-
2022-04-18historical
-
2020-12-04historical
-
2018-04-27soldstatus $87,500
-
2018-04-27soldstatus $87,500
-
2018-04-27soldstatus $87,500
-
2018-04-27soldstatus $87,500
-
2018-03-15historical
-
2016-06-21$99,999
-
2016-06-21$99,999
-
2016-06-21$99,999
-
2016-04-18historical
-
2016-04-18historical
-
2015-10-16$99,999
-
2015-10-01historical
-
2015-04-01$116,500
-
2015-03-30historical
-
2014-03-31$119,900
-
2014-03-30historical
-
2013-06-04$99,999
-
2013-06-04$116,500
-
2013-06-04$119,900
-
2013-05-22$99,999
-
2006-08-26soldstatus $160,000
-
2006-08-26soldstatus $160,000
-
2006-08-25soldstatus $160,000
-
2006-06-22soldstatus $172,500
-
2006-05-18historical
-
2006-02-13$172,500
-
2006-02-11$160,000
-
2006-02-09$172,500
-
1999-10-28$140,000
ⓘ Source: listings_history table (triggers on properties + properties_extension) + one-shot
backfill from property_details.listing_events for pre-trigger history.
Tax reassessment forecast PA · Partial reset (capped growth)
- Current annual tax
- $5,336 · $445/mo
- Projected year-2 tax
- $18,468 · $1,539/mo
- Expected delta
- +$13,132/yr (+$1,094/mo · 246.1%)
ⓘ Screening estimate from a state-policy table — verify with the county assessor before closing.
Climate risk First Street
- Flood 9/10 Extreme FEMA zone AE · 99% chance over 30 yrs
- Wildfire 3/10 Moderate
- Heat 4/10 Moderate 8 d/yr ≥95°F today · 17 d/yr by 30 yrs out
- Wind 4/10 Moderate 8% chance of damaging wind over 30 yrs
- Air quality 2/10 Low 1 unhealthy d/yr today · 2 by 30 yrs out
Nearby sold comps map
Loading sold comps map…
Walkable amenities ~0.75 mi
Loading nearby amenities…
Taxation est. · year 1
- Rental income
- $361,020
- − Mortgage interest
- −$112,031
- − Property taxes
- −$5,336
- − Insurance
- −$15,118
- − Repairs & maintenance
- −$28,882
- − Management
- −$28,882
- − Depreciation
- −$58,182
- Taxable income
- $112,589
- Est. tax owed @ 24.0%
- −$27,021
- After-tax cash flow
- $111,871/yr
For passive investors: Depreciation is non-cash, so a rental often shows a tax loss while cash-flowing — sheltering income. Rental losses are passive: they offset passive income freely, and up to $25,000/yr can offset ordinary (W-2) income if you actively participate and your MAGI is under $100k (phasing out to $0 by $150k); unused losses carry forward. On sale, claimed depreciation is recaptured at up to 25%, and gains may owe capital-gains tax (a 1031 exchange can defer both). Figures are a year-1 estimate at your 24.0% rate — not tax advice; consult a CPA.
Schools (NCES district)
- District
- Tamaqua Area SD
- NCES district ID
- 4223220
- Math proficiency
- 31% ▼ -9.00%
- Reading proficiency
- 53% ▼ -8.00%
- Median HH income
- $45,184
- Composite
- 35.61/100
- National rank
- #4893
- State rank
- #331 of 539 in PA
Livability — Tamaqua
- Score
- 80/100
- State rank
- #209
- US rank
- #1844
Category grades
Schools grade is shown separately in the Schools card above.
Census & demographics
- Census place
- Tamaqua, PA
- Population (ZIP)
- 11,065
Population outlook (Schuylkill County) Hauer SSP2
- Today (2025)
- 137,447 people
- By 2030
- 133,121 · -3.1%
- By 2040
- 124,172 · -9.7%
- By 2050
- 115,611 · -15.9%
- By 2075
- 100,796 · -26.7%
- By 2100
- 86,667 · -36.9%
Race, ethnicity, and origin ACS 2023
- Neighborhood character
- Predominantly White (87%)
- Race & ethnicity
- White 87% Hispanic / Latino 9% Two or more races 8%
- Hispanic origin (detail)
- Mexican 3% Puerto Rican 3% Salvadoran 2%
- Common ancestry
- Romanian 11% Iranian 3% Polish 2%
- Foreign-born
- 2% · Canada, Dominican Republic
- Languages at home
- 97% English-only · Spanish 2%
Political lean MEDSL · Schuylkill
- 2024 margin
- Solid R (+42.1) · D 28.5% · R 70.6%
- 2008→2024 swing
- -33.4pp toward R · 2008: -8.7pp · 2024: -42.1pp
- All cycles
- 2024: R+42.1 2020: R+39.9 2016: R+43.4 2012: R+13.4 2008: R+8.7
Not yet ingested
- Civics
- —
Market trends
- HPI YoY
- ▼ -35.53%
- Current HPI
- 194.8976
- Rent YoY
- —
- Metro
- —
- State GDP YoY
- ▲ 1.68%
- F500 in state
- 34
Industry mix (Fortune 500 HQ in PA)
| Industry | F500 HQs | Revenue |
|---|---|---|
| Healthcare | 2 | $309B |
|
||
| Insurance | 2 | $27B |
|
||
| Telecommunications / Media | 1 | $124B |
|
||
| Industrial Distribution | 1 | $22B |
|
||
| Financial Services | 1 | $20B |
|
||
| Chemicals / Materials | 1 | $18B |
|
||
Price history
+1328.6% since first listed34 events — show timeline
- 2025-08-04 Listed $2,000,000 BRIGHT MLS
- 2023-04-06 Sold (Public Records) $180,000 Public Records
- 2022-12-06 Rental Removed — BRIGHTMLS
- 2022-04-18 Listing Removed — GLVRMLS
- 2020-12-04 Listing Removed — GLVRMLS
- 2018-04-27 Sold (Public Records) $87,500 Public Records
- 2018-04-27 Sold (MLS) $87,500 PMAR
- 2018-04-27 Sold (MLS) $87,500 BRIGHT MLS
- 2018-04-27 Sold (MLS) $87,500 GLVRMLS
- 2018-03-15 Listing Removed — BRIGHT MLS
- 2016-06-21 Listed $99,999 PMAR
- 2016-06-21 Listed $99,999 BRIGHT MLS
- 2016-06-21 Listed $99,999 GLVRMLS
- 2016-04-18 Listing Removed — BRIGHT MLS
- 2016-04-18 Listing Removed — GLVRMLS
- 2015-10-16 Listed $99,999 GLVRMLS
- 2015-10-01 Listing Removed — GLVRMLS
- 2015-04-01 Listed $116,500 GLVRMLS
- 2015-03-30 Listing Removed — GLVRMLS
- 2014-03-31 Listed $119,900 GLVRMLS
- 2014-03-30 Listing Removed — GLVRMLS
- 2013-06-04 Listed $119,900 GLVRMLS
- 2013-06-04 Listed $116,500 GLVRMLS
- 2013-06-04 Listed $99,999 PMAR
- 2013-05-22 Listed $99,999 BRIGHT MLS
- 2006-08-26 Sold (MLS) $160,000 BRIGHT MLS
- 2006-08-26 Sold (MLS) $160,000 GLVRMLS
- 2006-08-25 Sold (Public Records) $160,000 Public Records
- 2006-06-22 Sold (MLS) $172,500 PMAR
- 2006-05-18 Listing Removed — BRIGHT MLS
- 2006-02-13 Listed $172,500 GLVRMLS
- 2006-02-11 Listed $160,000 BRIGHT MLS
- 2006-02-09 Listed $172,500 PMAR
- 1999-10-28 Listed $140,000 GLVRMLS
Property tax history
+2.7%/yrLatest (2025): $5,336 · +7.9% YoY. Source: county tax records.
Cash-flow waterfall
monthlySold comps — $/sqft
last 12 mo · ≤1 miLoading sold comps…