 5-Plex
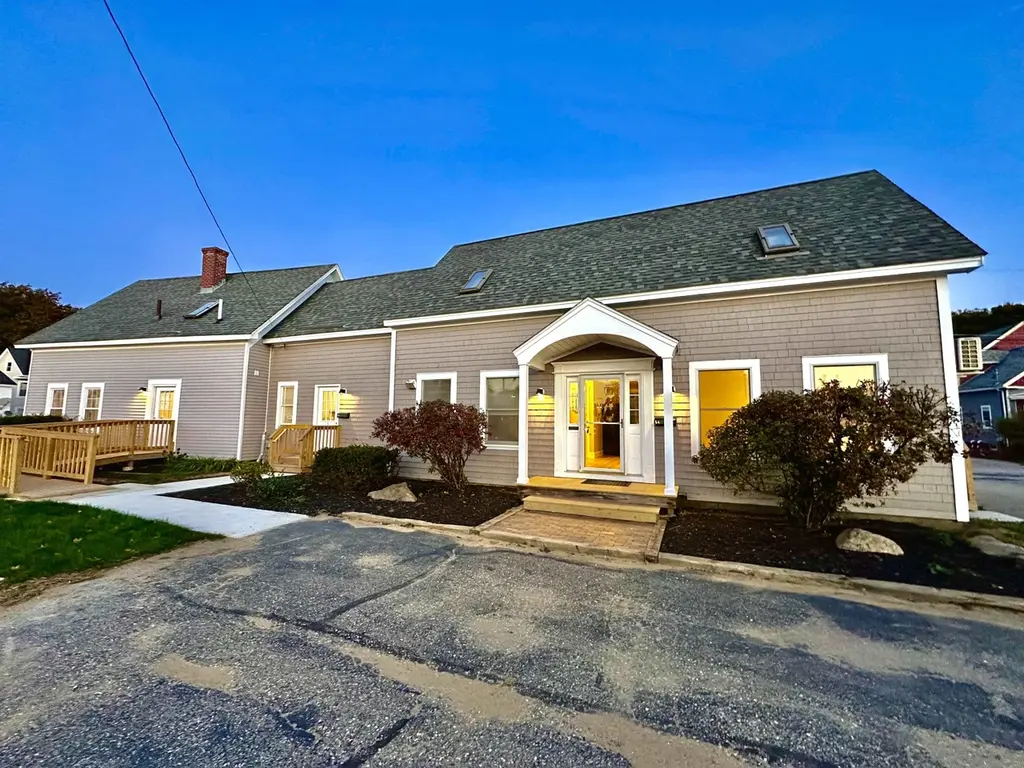
7 Jackson St · Rochester, NH
Flood risk No data
- FEMA flood zone
- —
- Chance of flooding over 30 yrs
- —
- Est. flood insurance / yr
- —
Fire risk No data
- Est. fire insurance / yr
- —
Heat risk No data
- Hot days now (above threshold)
- —
- Hot days in 30 yrs
- —
Wind risk No data
- Chance of severe wind over 30 yrs
- —
Air-quality risk No data
- Unhealthy air days now
- —
- Unhealthy air days in 30 yrs
- —
Risk factors via First Street. Map © Google.
Why this score? — see what drove the B grade
The composite is a weighted blend of 9 inputs, each scored 0–100. Each bar is that input's sub-score; the figure is the points it added to the 100-point composite (weight × sub-score).
- Cash flow +30.0/30.0
- DSCR +10.0/10.0
- 1% rule +8.3/10.0
- ARV discount +7.5/15.0
- Condition / age +4.8/5.0
- Livability +4.2/5.0
- Rent growth +3.6/5.0
- Schools +2.7/10.0
- Appreciation +0.0/10.0
$924,900
🖨 Deal sheet 📄 Offer letter ✓ Due diligence
Multi-family units
County records classify this as Multi-Family (5+ Unit). Listing-text estimate: 5 units. confirmed
5+ unit building — per-unit beds/baths from public records are typically unavailable; the breakdown below (if shown) is an estimate from the listing text.
Listing remarks MLS
This five unit multifamily property has undergone a complete renovation, effectively creating a brand-new building inside a classic shell. No expense was spared in the recent renovation as every major system has been replaced to ensure safety, efficiency, and tenant satisfaction. Highlights include a newly installed, state-of-the-art fire alarm and sprinkler system, electrical, plumbing and mini-split systems for heating and cooling. This property makes a great investment with a gross income of $101,340 and Rochester continues to see strong appreciation and rental demand as a key hub in the Seacoast region.
Key facts
- New plumbing system
- Complete renovation
- 0.25 acre lot
Tags
Neighborhood map
What this means for you Summary
Snapshot
- This is a 5 × 6-bed/1.0-bath units multifamily listed at $925k. Condition is rated excellent.
Deal economics
- At list price, monthly cash flow is $4k ($46k/yr) — positive. Per door: $772/mo.
- The deal already cash-flows at list — no discount required.
- Meets the 1% rule at list price ($12k rent vs $925k).
- Recommended offer: $869k (6.0% below list) — sets the bar for market timing.
- Cap rate 11.3% vs local median 3.6% in Rochester — top-decile yield for the area; either an underpriced asset or a hidden risk that comps aren't pricing in. Stress-test before assuming the spread holds.
Location & tenants
- Location reads 84/100 on livability (#8 in NH, #698 nationally) — a professional / high-income tenant draw. Strengths: crime A+, commute A+, cost of living A+; Watch: amenities C-.
- Rochester School District (suburban): math 27% / reading 35% proficiency, ranked #83 of 98 in NH (top 85%) — families likely to look elsewhere, expect single-tenant / working-renter base with shorter leases.
- Market conditions: Rents rising fast (+4.2%/yr); 108 active listings in the ZIP; solid renter incomes; 951 units permitted in Strafford County in 2024 (551 in 5+ unit buildings).
- At $12,324/mo this rent would consume 188% of the median local household income ($79k/yr) (locally 663% of renters already pay >50% of income on rent) — very limited rent-growth headroom before tenants either downsize or default.
Forward outlook
- Local home prices are declining (-3.0%/yr); year-one equity from $6k of loan paydown is wiped out by about $28k of value loss. Plan a longer hold.
- Strafford County population projected at +7% by 2050 — modest demand growth; plan on rents tracking national, not racing it.
- At projected returns (-3.0% appreciation + 4.2% rent growth), your $259k cash investment doubles in ~7 years — after that, you're playing with house money.
Negotiation context
- It's been on market 71 days — a 6% lower offer ($869k) is reasonable based on typical stale-listing flexibility.
- 6 sale attempts since 2y ago; this cycle's ask has dropped $74k (7%) from the opening price — seller is motivated, your offer sets the floor, not the list.
Risks & watch-outs
- Watch-outs: built in 1900 — expect roof / HVAC / electrical / plumbing capex.
Questions for the listing agent
- It's been on market 71 days. Have you received any prior offers? Is the seller open to a 6% concession, seller financing, or rate buy-down credit?
- Can we see the unit-by-unit rent roll, current vacancy, and any below-market leases? What's the average tenancy length?
- What capital expenditures (roof, boiler, parking lot, exteriors) have been made in the last 5 years, and what's planned in the next 2?
- Built in 1900 — when were the roof, HVAC, electrical panel, plumbing, and water heater last replaced?
- Why hasn't it sold? Are there any deal-killer items the seller is aware of (foundation, flood, title, zoning, code violations)?
- Is there a deadline driving the sale (1031 exchange, divorce, estate, relocation)? That informs how much negotiation room exists.
- What's the average days-on-market for RENTAL listings here right now (not sales)? A rising rental-DOM trend means longer vacancies and softer asking-rent achievability than the comps imply.
- What's the recent tenant-quality profile in this submarket — average credit score on applications, eviction rate, late-payment / NSF rate, and stable-employment percentage? A property-management company in the area should have these aggregated.
- How much new apartment / multifamily construction is in the pipeline within 1–3 miles? Heavy new supply (>2% of stock underway) typically softens rents 12–24 months out; light construction supports rent growth.
Investment metrics
- 1% rule
- 1.33% ✓
- Cap rate
- 11.30%
- Cash-on-cash
- 17.88%
- DSCR
- 1.80
- GRM
- 6.3
CMA / ARV
- ARV (median comp)
- $464,984
- List price
- $924,900
- Delta
- 114.85%
- Verdict
- OVERPRICED
- Comps
- 20 within 1.0 mi
Show comp detail 7 sales within ~0.75 mi
| Address | Dist | Beds/Ba | Sqft | Sold | Price | $/sf | Match |
|---|---|---|---|---|---|---|---|
| 163 N Main St | 0.04mi | 7/2.5 (+1) | 3,294 (+11%) | 3mo | $410,000 | $124 | 71 |
| 43-45 Charles St | 0.55mi | 7/3.0 (+1) | 2,875 (-3%) | 2mo | $595,500 | $207 | 62 |
| 65 Washington St | 0.29mi | 7/2.0 (+1) | 3,003 (+1%) | 20mo | $521,000 | $173 | 60 |
| 33-35 River St | 0.21mi | 7/2.0 (+1) | 2,574 (-14%) | 0mo | $312,500 | $121 | 58 |
| 103 Wakefield St | 0.48mi | 7/4.0 (+1) | 3,114 (+5%) | 22mo | $690,000 | $222 | 43 |
| 11 Leonard St | 0.62mi | 6/2.0 | 2,796 (-6%) | 20mo | $356,000 | $127 | 40 |
| 5 Coxeter Sq | 0.65mi | 6/2.0 | 3,260 (+10%) | 14mo | $400,000 | $123 | 38 |
Match score weights: distance 35% · size 25% · config 20% · recency 20%. Top-matched comps best support the ARV.
Projected returns pro-forma
-3.0% appreciation · 4.22% rent growth · sell at horizon
- IRR
- 10.7%
- Equity multiple
- 1.43×
- Total profit
- $111,008
- Equity at exit
- $137,906
- IRR
- 20.7%
- Equity multiple
- 2.84×
- Total profit
- $476,927
- Equity at exit
- $79,968
Cash invested: $258,972 (down + closing). Projections, not guarantees.
Landlord ↔ Tenant lean methodology
- Overall (STATE)
- 56 Moderately Landlord-Leaning
- State New Hampshire
- 56 Moderately Landlord-Leaning · D+1
- County
- — inherits STATE
- City
- — inherits STATE
ZIP-level market 03867
- Home prices YoY
- -22.0%
- Rents YoY
- 4.2%
- Active inventory
- 108
- Price-to-rent
- 31.3×
Monthly cashflow live
- Estimated rent
- $12,324 medium interval (Pro) →
- Mortgage (P&I)
- −$4,850
- Tax from tax record
- −$643 /mo · $7,711/yr
- Insurance
- −$385
- HOA
- −$0
- Vacancy / Maint / Mgmt
- −$2,588
- Net cashflow
- $3,858
Break-even live
5-unit breakdown (identical units grouped — click to expand)
| Units | Beds | Baths | Est. rent |
|---|---|---|---|
| 5× units | 6 | 1 | $12,325 |
| #1 | 6 | 1 | $2,465 |
| #2 | 6 | 1 | $2,465 |
| #3 | 6 | 1 | $2,465 |
| #4 | 6 | 1 | $2,465 |
| #5 | 6 | 1 | $2,465 |
| Total (5 units) | $12,324 | ||
UW: 25.0% down · 7.5% · 30yr · 1.5% tax · 5.0% vac · 8.0% maint · 8.0% mgmt
Financing live
Cash to close
- Down payment
- $231,225
- Closing costs
- $27,747
- Reserves months
- —
- Total cash needed
- —
Loan-product check · same deal, 3 products live
Conventional
25% down · 7.5% · 30yr
- Down + closing
- —
- Monthly P&I
- —
- Monthly cashflow
- —
- DSCR
- —
- Eligible?
- —
Personal DTI + credit; lowest rate.
DSCR
20% down · 8.5% · 30yr
- Down + closing
- —
- Monthly P&I
- —
- Monthly cashflow
- —
- DSCR
- —
- Eligible?
- —
No personal income docs; deal must DSCR.
Hard money
10% down · 12.0% · 12mo
- Down + closing
- —
- Monthly P&I
- —
- Monthly cashflow
- —
- DSCR
- —
- Eligible?
- —
Short-term bridge; refi at stabilization.
Listing history 30 events
-
2026-06-18pricedays on market $924,900 Active 71 DOM
-
2026-06-17days on market $999,000 Active 70 DOM
-
2026-06-16days on market $999,000 Active 69 DOM
-
2026-06-15days on market $999,000 Active 68 DOM
-
2026-06-13days on market $999,000 Active 66 DOM
-
2026-06-13days on market $999,000 Active 65 DOM
-
2026-06-09days on market $999,000 Active 62 DOM
-
2026-06-08days on market $999,000 Active 61 DOM
-
2026-06-07days on market $999,000 Active 60 DOM
-
2026-06-04days on market $999,000 Active 57 DOM
-
2026-06-03days on market $999,000 Active 56 DOM
-
2026-06-02days on market $999,000 Active 55 DOM
-
2026-06-01days on market $999,000 Active 54 DOM
-
2026-05-31days on market $999,000 Active 53 DOM
-
2026-04-08$999,000 Active 614-char remark
Show marketing remark (614 chars)
This five unit multifamily property has undergone a complete renovation, effectively creating a brand-new building inside a classic shell. No expense was spared in the recent renovation as every major system has been replaced to ensure safety, efficiency, and tenant satisfaction. Highlights include a newly installed, state-of-the-art fire alarm and sprinkler system, electrical, plumbing and mini-split systems for heating and cooling. This property makes a great investment with a gross income of $101,340 and Rochester continues to see strong appreciation and rental demand as a key hub in the Seacoast region.
-
2026-01-03historical $1,825
-
2025-12-19price $1,825
-
2025-12-10price $1,850
-
2025-12-02$1,895
-
2025-10-24historical $1,625
-
2025-09-26price $1,625
-
2025-09-04$1,695
-
2025-08-06historical $1,995
-
2025-07-09$1,995
-
2024-11-23historical $1,900
-
2024-11-17$1,900
-
2024-11-11historical $1,900
-
2024-11-08price $1,900
-
2024-10-31price $2,000
-
2024-10-25$2,100
ⓘ Source: listings_history table (triggers on properties + properties_extension) + one-shot
backfill from property_details.listing_events for pre-trigger history.
Tax reassessment forecast NH · Partial reset (capped growth)
- Current annual tax
- $7,711 · $643/mo
- Projected year-2 tax
- $13,937 · $1,161/mo
- Expected delta
- +$6,226/yr (+$519/mo · 80.7%)
ⓘ Screening estimate from a state-policy table — verify with the county assessor before closing.
Nearby sold comps map
Loading sold comps map…
Walkable amenities ~0.75 mi
Loading nearby amenities…
Taxation est. · year 1
- Rental income
- $147,888
- − Mortgage interest
- −$51,809
- − Property taxes
- −$7,711
- − Insurance
- −$4,624
- − Repairs & maintenance
- −$11,831
- − Management
- −$11,831
- − Depreciation
- −$26,906
- Taxable income
- $33,175
- Est. tax owed @ 24.0%
- −$7,962
- After-tax cash flow
- $38,331/yr
For passive investors: Depreciation is non-cash, so a rental often shows a tax loss while cash-flowing — sheltering income. Rental losses are passive: they offset passive income freely, and up to $25,000/yr can offset ordinary (W-2) income if you actively participate and your MAGI is under $100k (phasing out to $0 by $150k); unused losses carry forward. On sale, claimed depreciation is recaptured at up to 25%, and gains may owe capital-gains tax (a 1031 exchange can defer both). Figures are a year-1 estimate at your 24.0% rate — not tax advice; consult a CPA.
Condition & rehab AI · 11 photos
This five-unit multifamily property has undergone a complete renovation, making it move-in ready and highly desirable for investors. The home is in excellent condition with no visible repairs needed, and the upgrades and improvements can further enhance its value.
Value-add opportunities
- Both Landscaping improvements — Enhances curb appeal and adds value to the property.
- Both Painting exterior and interior walls — Fresh paint can make a significant difference in the home's appearance and value.
- Both Upgrading light fixtures — Modern light fixtures can improve the home's curb appeal and functionality.
Renovation cost estimate screening
Value-add ROI direction
- Both Landscaping improvements — Enhances curb appeal and adds value to the property. ↑
- Both Painting exterior and interior walls — Fresh paint can make a significant difference in the home's appearance and value. ↑
- Both Upgrading light fixtures — Modern light fixtures can improve the home's curb appeal and functionality. ↑
ⓘ Cost ranges are severity-bucket heuristics (US national rule-of-thumb). Get contractor quotes + a written scope before underwriting a rehab budget.
Schools (NCES district)
- District
- Rochester School District
- NCES district ID
- 3305940
- Math proficiency
- 27% ▼ -15.00%
- Reading proficiency
- 35% ▼ -14.00%
- Median HH income
- $51,080
- Composite
- 27.11/100
- National rank
- #7039
- State rank
- #83 of 98 in NH
Livability — Rochester
- Score
- 84/100
- State rank
- #8
- US rank
- #698
Category grades
Schools grade is shown separately in the Schools card above.
Census & demographics
- Census place
- Rochester, NH
- County
- Strafford County · 75,181 people
- City population
- 22,732
- Metro
- Boston-Cambridge-Newton, MA-NH
- Population (ZIP)
- 22,732
- Household income
- $78,674
- Rent vs Own
- Severe rent burden
- 663.0
Population outlook (Strafford County) Hauer SSP2
- Today (2025)
- 132,503 people
- By 2030
- 135,377 · +2.2%
- By 2040
- 139,609 · +5.4%
- By 2050
- 141,803 · +7.0%
- By 2075
- 149,280 · +12.7%
- By 2100
- 148,667 · +12.2%
Race, ethnicity, and origin ACS 2023
- Neighborhood character
- Predominantly White (93%)
- Race & ethnicity
- White 93% Two or more races 4% Hispanic / Latino 2% Asian 1%
- Common ancestry
- Lithuanian 12% Romanian 2% Serbian 2%
- Foreign-born
- 3% · Canada
- Languages at home
- 96% English-only · Spanish 1% French/Haitian/Cajun 1%
Political lean MEDSL · Strafford
- 2024 margin
- D (+12.1) · D 55.5% · R 43.5% · Other 1.0%
- 2008→2024 swing
- -8.3pp toward R · 2008: 20.4pp · 2024: 12.1pp
- All cycles
- 2024: D+12.1 2020: D+15.2 2016: D+8.6 2012: D+14.5 2008: D+20.4
Not yet ingested
- Civics
- —
Market trends
- HPI YoY
- ▼ -107.34%
- Current HPI
- 379.5755
- Rent YoY
- ▲ 4.22%
- Metro
- Boston-Cambridge-Newton, MA-NH
- State GDP YoY
- —
- F500 in state
- 0
Price history
+47471.4% since first listed16 events — show timeline
- 2026-04-08 Listed $999,000 PrimeMLS
- 2026-01-03 Rental Removed $1,825 APPFOLIO
- 2025-12-19 Price Changed $1,825 APPFOLIO
- 2025-12-10 Price Changed $1,850 APPFOLIO
- 2025-12-02 Listed for Rent $1,895 APPFOLIO
- 2025-10-24 Rental Removed $1,625 APPFOLIO
- 2025-09-26 Price Changed $1,625 APPFOLIO
- 2025-09-04 Listed for Rent $1,695 APPFOLIO
- 2025-08-06 Rental Removed $1,995 APPFOLIO
- 2025-07-09 Listed for Rent $1,995 APPFOLIO
- 2024-11-23 Rental Removed $1,900 APPFOLIO
- 2024-11-17 Listed for Rent $1,900 APPFOLIO
- 2024-11-11 Rental Removed $1,900 APPFOLIO
- 2024-11-08 Price Changed $1,900 APPFOLIO
- 2024-10-31 Price Changed $2,000 APPFOLIO
- 2024-10-25 Listed for Rent $2,100 APPFOLIO
Property tax history
+3.0%/yrLatest (2025): $7,711 · +3.0% YoY. Source: county tax records.
Cash-flow waterfall
monthlySold comps — $/sqft
last 12 mo · ≤1 miLoading sold comps…