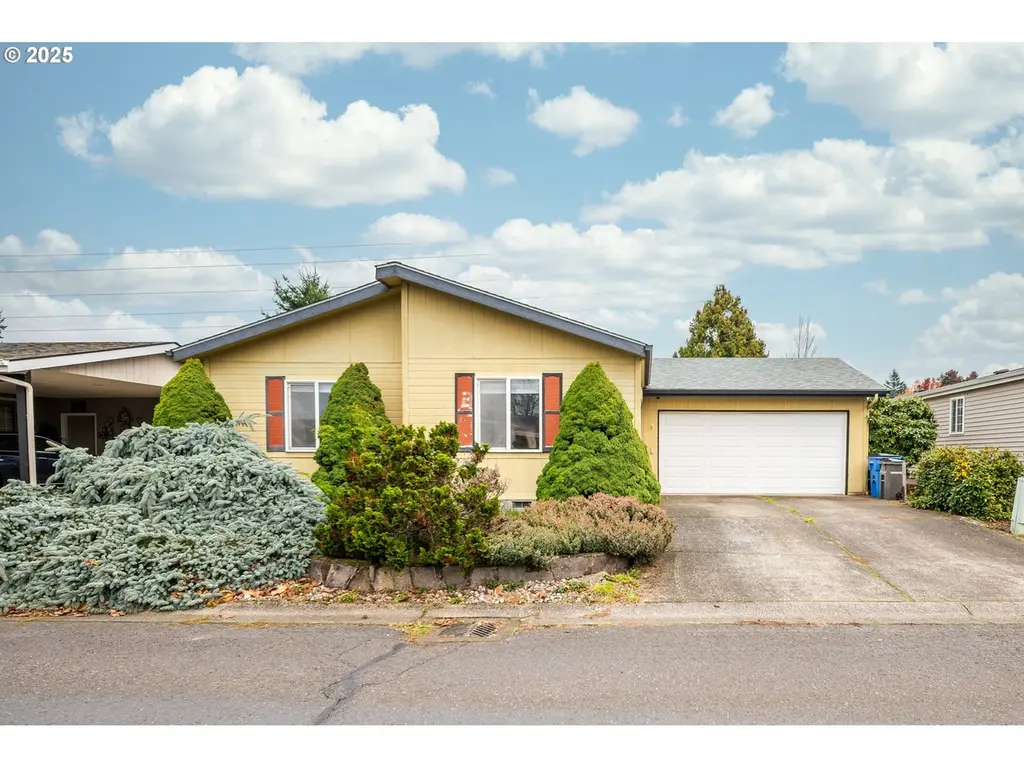
16500 SE 1st St #22 · Vancouver, WA
Flood risk No data
- FEMA flood zone
- —
- Chance of flooding over 30 yrs
- —
- Est. flood insurance / yr
- —
Fire risk No data
- Est. fire insurance / yr
- —
Heat risk No data
- Hot days now (above threshold)
- —
- Hot days in 30 yrs
- —
Wind risk No data
- Chance of severe wind over 30 yrs
- —
Air-quality risk No data
- Unhealthy air days now
- —
- Unhealthy air days in 30 yrs
- —
Risk factors via First Street. Map © Google.
Why this score? — see what drove the B grade
The composite is a weighted blend of 9 inputs, each scored 0–100. Each bar is that input's sub-score; the figure is the points it added to the 100-point composite (weight × sub-score).
- Cash flow +30.0/30.0
- ARV discount +10.4/15.0
- 1% rule +10.0/10.0
- DSCR +10.0/10.0
- Schools +4.3/10.0
- Livability +4.1/5.0
- Rent growth +2.8/5.0
- Condition / age +2.5/5.0
- Appreciation +0.0/10.0
$140,000
🖨 Deal sheet 📄 Offer letter ✓ Due diligence
Listing remarks MLS
Discover this charming 3 bedroom, 2 bath gem in an amazing 55+ gated community at Cascade Park Estates. With 1301 sqft of thoughtfully designed space, enjoy an open concept layout enhanced by vaulted ceilings and bright skylights providing extra natural light. The fenced back yard with covered deck have the potential to be your own private retreat! Multiple dining and shopping options within a 2 miles radius make this an ideal location in town. Come tour this home today!
Key facts
- Gated community
- Covered deck
- Bright skylights
Tags
Neighborhood map
What this means for you Summary
Snapshot
- This is a 3-bed/2.0-bath manufactured listed at $140k.
Deal economics
- At list price, monthly cash flow is $875 ($10k/yr) — positive.
- The deal already cash-flows at list — no discount required.
- Meets the 1% rule at list price ($2k rent vs $140k).
- Recommended offer: $123k (12.0% below list) — sets the bar for market timing.
- Cap rate 13.8% vs local median 2.7% in Vancouver — top-decile yield for the area; either an underpriced asset or a hidden risk that comps aren't pricing in. Stress-test before assuming the spread holds.
Location & tenants
- Location reads 82/100 on livability (#62 in WA, #1,133 nationally) — a professional / high-income tenant draw. Strengths: amenities A+, commute A+, housing A+; Watch: crime F, cost of living D-.
- Evergreen School District (Clark) (urban): math 41% / reading 51% proficiency, ranked #164 of 291 in WA (top 56%) — families likely to look elsewhere, expect single-tenant / working-renter base with shorter leases.
- Market conditions: Rents rising (+1.2%/yr); 299 active listings in the ZIP; 38 comparable units currently listed for rent nearby; rentals at typical pace (median 16d on market — plan ~3-4 weeks tenant-placement turnaround); solid renter incomes; 3,547 units permitted in Clark County in 2024 (1,361 in 5+ unit buildings).
- This rent runs 31% of the median local income ($91k/yr) — at the standard rent-burdened threshold; future hikes will face affordability resistance.
Forward outlook
- Local home prices are declining (-3.0%/yr); year-one equity from $968 of loan paydown is wiped out by about $4k of value loss. Plan a longer hold.
- Clark County population projected at +29% by 2050 — long-run rental-demand tailwind backs the buy-and-hold thesis.
- At projected returns (-3.0% appreciation + 1.2% rent growth), your $39k cash investment doubles in ~5 years — after that, you're playing with house money.
Negotiation context
- It's been on market 189 days — a 12% lower offer ($123k) is reasonable based on typical stale-listing flexibility.
- 5 sale attempts since 25y ago; this cycle's ask has dropped $10k (7%) from the opening price — seller is motivated, your offer sets the floor, not the list.
Questions for the listing agent
- It's been on market 189 days. Have you received any prior offers? Is the seller open to a 12% concession, seller financing, or rate buy-down credit?
- Why hasn't it sold? Are there any deal-killer items the seller is aware of (foundation, flood, title, zoning, code violations)?
- Is there a deadline driving the sale (1031 exchange, divorce, estate, relocation)? That informs how much negotiation room exists.
- Crime grade is F in this area — have there been break-ins, vandalism, or insurance claims at this property in the last 3 years? What carrier currently insures it and at what premium?
- What's the average days-on-market for RENTAL listings here right now (not sales)? A rising rental-DOM trend means longer vacancies and softer asking-rent achievability than the comps imply.
- What's the recent tenant-quality profile in this submarket — average credit score on applications, eviction rate, late-payment / NSF rate, and stable-employment percentage? A property-management company in the area should have these aggregated.
- How much new for-sale + rental construction is in the pipeline within 1–3 miles? Heavy new supply typically softens prices + rents 12–24 months out; constrained supply supports both.
Investment metrics
- 1% rule
- 1.65% ✓
- Cap rate
- 13.79%
- Cash-on-cash
- 26.78%
- DSCR
- 2.19
- GRM
- 5.1
CMA / ARV
- ARV (median comp)
- $149,750
- List price
- $140,000
- Delta
- -6.51%
- Verdict
- FAIR
- Comps
- 14 within 1.0 mi
Show comp detail 12 sales within ~0.75 mi
| Address | Dist | Beds/Ba | Sqft | Sold | Price | $/sf | Match |
|---|---|---|---|---|---|---|---|
| 16500 SE 1st St #19 | 0.00mi | 3/2.0 | 1,309 (+0%) | 2mo | $117,000 | $89 | 98 |
| 16500 SE 1st St #170 | 0.00mi | 2/2.0 (-1) | 1,355 (+4%) | 1mo | $155,000 | $114 | 87 |
| 16500 SE 1st St | 0.00mi | 3/2.0 | 1,392 (+7%) | 2mo | $115,000 | $83 | 86 |
| 16500 SE 1st St #98 | 0.00mi | 3/2.0 | 1,392 (+7%) | 2mo | $115,000 | $83 | 86 |
| 16500 SE 1st St #56 | 0.00mi | 2/2.0 (-1) | 1,263 (-3%) | 8mo | $112,000 | $89 | 83 |
| 16812 SE 1st St #71 | 0.19mi | 3/2.0 | 1,325 (+2%) | 7mo | $155,000 | $117 | 82 |
| 16812 SE 1st St #84 | 0.19mi | 3/2.0 | 1,248 (-4%) | 8mo | $124,600 | $100 | 78 |
| 16812 SE 1st St #112 | 0.19mi | 3/2.0 | 1,188 (-9%) | 4mo | $156,000 | $131 | 73 |
| 16500 SE 1st St #14 | 0.07mi | 2/2.0 (-1) | 1,188 (-9%) | 6mo | $137,900 | $116 | 72 |
| 16500 SE 1st St #10 | 0.00mi | 3/2.0 | 1,139 (-12%) | 9mo | $155,500 | $137 | 71 |
| 16500 SE 1st St #71 | 0.00mi | 2/2.0 (-1) | 1,418 (+9%) | 12mo | $160,000 | $113 | 70 |
| 16812 SE 1st St #69 | 0.19mi | 4/2.0 (+1) | 1,440 (+11%) | 9mo | $206,000 | $143 | 61 |
Match score weights: distance 35% · size 25% · config 20% · recency 20%. Top-matched comps best support the ARV.
Projected returns pro-forma
-3.0% appreciation · 1.16% rent growth · sell at horizon
- IRR
- 18.6%
- Equity multiple
- 1.74×
- Total profit
- $28,858
- Equity at exit
- $20,874
- IRR
- 25.7%
- Equity multiple
- 3.05×
- Total profit
- $80,384
- Equity at exit
- $12,105
Cash invested: $39,200 (down + closing). Projections, not guarantees.
Landlord ↔ Tenant lean methodology
- Overall (STATE)
- 28 Tenant-Leaning
- State Washington
- 28 Tenant-Leaning · D+8
- County
- — inherits STATE
- City
- — inherits STATE
ZIP-level market 98684
- Rents YoY
- 1.2%
- Active inventory
- 299
- Price-to-rent
- 5.1×
Monthly cashflow live
- Estimated rent
- $2,305 high interval (Pro) →
- Mortgage (P&I)
- −$734
- Tax from tax record
- −$154 /mo · $1,849/yr
- Insurance
- −$58
- HOA
- −$0
- Vacancy / Maint / Mgmt
- −$484
- Net cashflow
- $875
Break-even live
UW: 25.0% down · 7.5% · 30yr · 1.5% tax · 5.0% vac · 8.0% maint · 8.0% mgmt
Financing live
Cash to close
- Down payment
- $35,000
- Closing costs
- $4,200
- Reserves months
- —
- Total cash needed
- —
Loan-product check · same deal, 3 products live
Conventional
25% down · 7.5% · 30yr
- Down + closing
- —
- Monthly P&I
- —
- Monthly cashflow
- —
- DSCR
- —
- Eligible?
- —
Personal DTI + credit; lowest rate.
DSCR
20% down · 8.5% · 30yr
- Down + closing
- —
- Monthly P&I
- —
- Monthly cashflow
- —
- DSCR
- —
- Eligible?
- —
No personal income docs; deal must DSCR.
Hard money
10% down · 12.0% · 12mo
- Down + closing
- —
- Monthly P&I
- —
- Monthly cashflow
- —
- DSCR
- —
- Eligible?
- —
Short-term bridge; refi at stabilization.
Rent comps 38 comps
| Address | Beds | Baths | Sqft | Rent | $/sqft | DOM | Units | Dist |
|---|---|---|---|---|---|---|---|---|
| 16202 NE 8th St Unit B Vancouver, WA | 2.0 | 2.5 | 1500 | $2,150 | $1.43 | 43d | 1 | 0.25mi |
| 301 SE 166th Ave Vancouver, WA | 3.0 | 1.0–2.0 | 883 | $2,080 | $2.36 | 7d | 15 | 0.35mi |
| 16801 SE 1st St Vancouver, WA | 2.0 | 1.0 | 960 | $1,608 | $1.68 | 23d | 1 | 0.37mi |
| 16312 NE 12th St Unit 2 Vancouver, WA | 3.0 | 2.0 | 1616 | $2,059 | $1.27 | 43d | 1 | 0.41mi |
| 1207 NE 166th Ave Vancouver, WA | 3.0 | 2.0 | 1533 | $6,000 | $3.91 | 1d | 1 | 0.42mi |
| 621 SE 168th Ave Vancouver, WA | 3.0 | 1.0–2.0 | 869 | $2,294 | $2.64 | 14d | 7 | 0.52mi |
| 621 SE 168th Ave Vancouver, WA | 2.0–3.0 | 1.0–2.0 | 1125 | $2,274 | $2.02 | 2d | 9 | 0.52mi |
| 112 SE 158th Ave Vancouver, WA | 3.0 | 2.0 | 1174 | $1,995 | $1.70 | 23d | 1 | 0.53mi |
| 15501 NE 2nd St Vancouver, WA | 3.0 | 2.0 | 1264 | $2,750 | $2.18 | 1d | 1 | 0.60mi |
| 600 SE 177th Ave Vancouver, WA | 1.0–3.0 | 1.0–2.0 | 931 | $2,535 | $2.72 | 1d | 20 | 0.70mi |
| 510 SE 157th Ave #35 Vancouver, WA | 2.0 | 2.0 | 1060 | $1,895 | $1.79 | 23d | 1 | 0.71mi |
| 1000 SE 160th Ave Apt M104 Vancouver, WA | 2.0 | 2.0 | 906 | $1,600 | $1.77 | 7d | 1 | 0.81mi |
| 1000 SE 160th Ave Apt DD238 Vancouver, WA | 2.0 | 2.0 | 906 | $1,600 | $1.77 | 43d | 1 | 0.81mi |
| 1000 SE 160th Ave Apt FF257 Vancouver, WA | 3.0 | 2.0 | 1050 | $1,950 | $1.86 | 43d | 1 | 0.81mi |
| 1000 SE 160th Ave Apt N116 Vancouver, WA | 2.0 | 2.0 | 906 | $1,600 | $1.77 | 17d | 1 | 0.81mi |
| 1000 SE 160th Ave Unit RR-342 Vancouver, WA | 2.0 | 2.0 | 906 | $1,600 | $1.77 | 23d | 1 | 0.81mi |
| 1000 SE 160th Ave Unit RR-336 Vancouver, WA | 2.0 | 2.0 | 906 | $1,600 | $1.77 | 16d | 1 | 0.81mi |
| 16334 NE 20th St Vancouver, WA | 3.0 | 2.5 | 1432 | $2,695 | $1.88 | 4d | 1 | 0.88mi |
| 17775 SE Mill Plain Blvd Vancouver, WA | 1.0–2.0 | 1.0–2.0 | 732 | $2,353 | $3.21 | 4d | 1 | 0.89mi |
| 16332 NE 21st St Vancouver, WA | 3.0 | 2.5 | 1541 | $2,595 | $1.68 | 23d | 1 | 0.92mi |
| 2119 NE 163rd Ave Vancouver, WA | 3.0 | 2.5 | 1657 | $2,515 | $1.52 | 43d | 1 | 0.95mi |
| 17003 NE 22nd St Vancouver, WA | 3.0 | 2.0 | 1448 | $2,575 | $1.78 | 4d | 1 | 0.96mi |
| 14616 SE 1st St Vancouver, WA | 3.0 | 1.5 | 1200 | $1,975 | $1.65 | 43d | 1 | 0.99mi |
| 505 SE 184th Ave Vancouver, WA | 1.0–3.0 | 1.0–2.0 | 928 | $2,695 | $2.90 | 1d | 24 | 1.01mi |
| 14913 SE Mill Plain Blvd Vancouver, WA | 1.0–2.0 | 1.0–2.0 | 939 | $2,000 | $2.13 | 2d | 4 | 1.03mi |
| 1302 SE 155th Ave Vancouver, WA | 3.0 | 2.0 | 1558 | $2,495 | $1.60 | 44d | 1 | 1.04mi |
| 1600 SE 168th Ave Vancouver, WA | 3.0 | 1.5 | 1210 | $2,350 | $1.94 | 4d | 1 | 1.07mi |
| 2419 NE 164th Ave Vancouver, WA | 3.0 | 2.0 | 1386 | $2,809 | $2.03 | 2d | 1 | 1.07mi |
| 1603 SE 171st Pl Vancouver, WA | 4.0 | 2.5 | 1771 | $6,300 | $3.56 | 17d | 1 | 1.12mi |
| 14600 SE 7th Way Vancouver, WA | 3.0 | 2.5 | 1476 | $2,345 | $1.59 | 43d | 1 | 1.19mi |
| 2712 NE 164th Pl Vancouver, WA | 3.0 | 2.0 | 1380 | $2,495 | $1.81 | 23d | 1 | 1.22mi |
| 1203 NE Keyes Rd Vancouver, WA | 3.0 | 2.0 | 1400 | $2,199 | $1.57 | 43d | 1 | 1.28mi |
| Chase LNDG Gresham, OR | 3.0 | 2.5 | 1389 | $2,200 | $1.58 | 12d | 3 | 1.31mi |
| 14111 SE 6th St Vancouver, WA | 2.0 | 1.5 | 1201 | $2,104 | $1.75 | 23d | 1 | 1.35mi |
| 1418 NE 140th Ave Vancouver, WA | 2.0 | 1.5 | 904 | $1,895 | $2.10 | 14d | 1 | 1.42mi |
| 701 SE 139th Ave Vancouver, WA | 1.0–2.0 | 1.0 | 806 | $1,600 | $1.99 | 2d | 6 | 1.46mi |
| 19600 NE 3rd St Camas, WA | 1.0–3.0 | 1.0–2.0 | 952 | $2,825 | $2.97 | 1d | 20 | 1.48mi |
| 3402 NE 165th Ave Vancouver, WA | 4.0 | 2.5 | 1777 | $3,119 | $1.76 | 7d | 1 | 1.49mi |
Listing history 29 events
-
2026-06-18days on market $140,000 Active 189 DOM
-
2026-06-17days on market $140,000 Active 188 DOM
-
2026-06-16days on market $140,000 Active 187 DOM
-
2026-06-15days on market $140,000 Active 186 DOM
-
2026-06-13days on market $140,000 Active 184 DOM
-
2026-06-13days on market $140,000 Active 183 DOM
-
2026-06-09days on market $140,000 Active 180 DOM
-
2026-06-08days on market $140,000 Active 179 DOM
-
2026-06-07days on market $140,000 Active 178 DOM
-
2026-06-03days on market $140,000 Active 174 DOM
-
2026-06-02days on market $140,000 Active 173 DOM
-
2026-06-01days on market $140,000 Active 172 DOM
-
2026-05-31days on market $140,000 Active 171 DOM
-
2026-03-14price $140,000 475-char remark
Show marketing remark (475 chars)
Discover this charming 3 bedroom, 2 bath gem in an amazing 55+ gated community at Cascade Park Estates. With 1301 sqft of thoughtfully designed space, enjoy an open concept layout enhanced by vaulted ceilings and bright skylights providing extra natural light. The fenced back yard with covered deck have the potential to be your own private retreat! Multiple dining and shopping options within a 2 miles radius make this an ideal location in town. Come tour this home today!
-
2025-12-11$150,000 Active 475-char remark
Show marketing remark (475 chars)
Discover this charming 3 bedroom, 2 bath gem in an amazing 55+ gated community at Cascade Park Estates. With 1301 sqft of thoughtfully designed space, enjoy an open concept layout enhanced by vaulted ceilings and bright skylights providing extra natural light. The fenced back yard with covered deck have the potential to be your own private retreat! Multiple dining and shopping options within a 2 miles radius make this an ideal location in town. Come tour this home today!
-
2021-01-29soldstatus $132,000 Sold 400-char remark
Show marketing remark (400 chars)
Close before 2020 and sellers will pay your park fees for all of 2021 That is a credit of $10,200 ($850x12months) True one-level Manufactured homes~Simply the best Manufactured Home Park 55+. *3 bedroom *2 bath *5 year new roof *Newer Heat Pump *Large 2 car garage with workshop *Covered patio *back gate leads to neighborhood RV parking *Friendly neighborhood....come meet your new friends today!!
-
2020-12-19status Pending 400-char remark
Show marketing remark (400 chars)
Close before 2020 and sellers will pay your park fees for all of 2021 That is a credit of $10,200 ($850x12months) True one-level Manufactured homes~Simply the best Manufactured Home Park 55+. *3 bedroom *2 bath *5 year new roof *Newer Heat Pump *Large 2 car garage with workshop *Covered patio *back gate leads to neighborhood RV parking *Friendly neighborhood....come meet your new friends today!!
-
2020-12-03price $132,000 400-char remark
Show marketing remark (400 chars)
Close before 2020 and sellers will pay your park fees for all of 2021 That is a credit of $10,200 ($850x12months) True one-level Manufactured homes~Simply the best Manufactured Home Park 55+. *3 bedroom *2 bath *5 year new roof *Newer Heat Pump *Large 2 car garage with workshop *Covered patio *back gate leads to neighborhood RV parking *Friendly neighborhood....come meet your new friends today!!
-
2020-10-27price $133,000 400-char remark
Show marketing remark (400 chars)
Close before 2020 and sellers will pay your park fees for all of 2021 That is a credit of $10,200 ($850x12months) True one-level Manufactured homes~Simply the best Manufactured Home Park 55+. *3 bedroom *2 bath *5 year new roof *Newer Heat Pump *Large 2 car garage with workshop *Covered patio *back gate leads to neighborhood RV parking *Friendly neighborhood....come meet your new friends today!!
-
2020-10-20price $139,900 400-char remark
Show marketing remark (400 chars)
Close before 2020 and sellers will pay your park fees for all of 2021 That is a credit of $10,200 ($850x12months) True one-level Manufactured homes~Simply the best Manufactured Home Park 55+. *3 bedroom *2 bath *5 year new roof *Newer Heat Pump *Large 2 car garage with workshop *Covered patio *back gate leads to neighborhood RV parking *Friendly neighborhood....come meet your new friends today!!
-
2020-10-09$142,000 Active 400-char remark
Show marketing remark (400 chars)
Close before 2020 and sellers will pay your park fees for all of 2021 That is a credit of $10,200 ($850x12months) True one-level Manufactured homes~Simply the best Manufactured Home Park 55+. *3 bedroom *2 bath *5 year new roof *Newer Heat Pump *Large 2 car garage with workshop *Covered patio *back gate leads to neighborhood RV parking *Friendly neighborhood....come meet your new friends today!!
-
2019-04-30soldstatus $128,000 Sold
-
2019-04-19status Pending
-
2019-04-13$131,900 Active
-
2004-11-10soldstatus $80,000
-
2004-10-21historical
-
2004-10-06$84,900
-
2002-10-11soldstatus $79,800
-
2001-09-28$79,800
ⓘ Source: listings_history table (triggers on properties + properties_extension) + one-shot
backfill from property_details.listing_events for pre-trigger history.
Tax reassessment forecast WA · Resets to sale price
- Current annual tax
- $1,849 · $154/mo
- Projected year-2 tax
- $1,849 · $154/mo
- Expected delta
- $0/yr ($0/mo · 0.0%)
ⓘ Screening estimate from a state-policy table — verify with the county assessor before closing.
Nearby sold comps map
Loading sold comps map…
Walkable amenities ~0.75 mi
Loading nearby amenities…
Taxation est. · year 1
- Rental income
- $27,666
- − Mortgage interest
- −$7,842
- − Property taxes
- −$1,849
- − Insurance
- −$700
- − Repairs & maintenance
- −$2,213
- − Management
- −$2,213
- − Depreciation
- −$4,073
- Taxable income
- $8,776
- Est. tax owed @ 24.0%
- −$2,106
- After-tax cash flow
- $8,391/yr
For passive investors: Depreciation is non-cash, so a rental often shows a tax loss while cash-flowing — sheltering income. Rental losses are passive: they offset passive income freely, and up to $25,000/yr can offset ordinary (W-2) income if you actively participate and your MAGI is under $100k (phasing out to $0 by $150k); unused losses carry forward. On sale, claimed depreciation is recaptured at up to 25%, and gains may owe capital-gains tax (a 1031 exchange can defer both). Figures are a year-1 estimate at your 24.0% rate — not tax advice; consult a CPA.
Schools (NCES district)
- District
- Evergreen School District (Clark)
- NCES district ID
- 5302700
- Math proficiency
- 41% ▼ -3.00%
- Reading proficiency
- 51% ▼ -3.00%
- Median HH income
- $59,418
- Composite
- 42.53/100
- National rank
- #6859
- State rank
- #164 of 291 in WA
Livability — Vancouver
- Score
- 82/100
- State rank
- #62
- US rank
- #1133
Category grades
Schools grade is shown separately in the Schools card above.
Census & demographics
- County
- Clark County · 513,189 people
- City population
- 360,195
- Metro
- Portland-Vancouver-Hillsboro, OR-WA
- Population (ZIP)
- 37,298
- Household income
- $90,620
- Rent vs Own
- Severe rent burden
- 1481.0
Population outlook (Clark County) Hauer SSP2
- Today (2025)
- 529,610 people
- By 2030
- 563,242 · +6.4%
- By 2040
- 625,905 · +18.2%
- By 2050
- 681,558 · +28.7%
- By 2075
- 805,967 · +52.2%
- By 2100
- 877,450 · +65.7%
Race, ethnicity, and origin ACS 2023
- Neighborhood character
- Diverse neighborhood (Simpson 0.56)
- Race & ethnicity
- White 64% Hispanic / Latino 17% Two or more races 14% Asian 6% Pacific Islander 3% Black 2%
- Hispanic origin (detail)
- Mexican 12%
- Common ancestry
- Portuguese 4% Slovak 3% Iranian 2%
- Foreign-born
- 16% · Canada, China, Vietnam
- Languages at home
- 77% English-only · Spanish 10% Other Asian/Pacific 3% Russian/Polish/Slavic 3%
Political lean MEDSL · Clark
- 2024 margin
- Lean D (+7.0) · D 52.1% · R 45.1% · Other 2.8%
- 2008→2024 swing
- +0.9pp no change · 2008: 6.1pp · 2024: 7.0pp
- All cycles
- 2024: D+7.0 2020: D+5.1 2016: D+0.1 2012: D+0.1 2008: D+6.1
Not yet ingested
- Civics
- —
Market trends
- HPI YoY
- ▼ -237.93%
- Current HPI
- 290.416
- Rent YoY
- ▲ 1.16%
- Metro
- Portland-Vancouver-Hillsboro, OR-WA
- State GDP YoY
- ▲ 4.65%
- F500 in state
- 22
Industry mix (Fortune 500 HQ in WA)
| Industry | F500 HQs | Revenue |
|---|---|---|
| Retail | 2 | $269B |
|
||
| Technology / Retail | 1 | $638B |
|
||
| Technology | 1 | $245B |
|
||
| Telecommunications | 1 | $38B |
|
||
| Food / Beverage | 1 | $36B |
|
||
| Automotive / Trucks | 1 | $34B |
|
||
Price history
+75.4% since first listed16 events — show timeline
- 2026-03-14 Price Changed $140,000 RMLS
- 2025-12-11 Listed $150,000 RMLS
- 2021-01-29 Sold (MLS) $132,000 RMLS
- 2020-12-19 Pending — RMLS
- 2020-12-03 Price Changed $132,000 RMLS
- 2020-10-27 Price Changed $133,000 RMLS
- 2020-10-20 Price Changed $139,900 RMLS
- 2020-10-09 Listed $142,000 RMLS
- 2019-04-30 Sold (MLS) $128,000 RMLS
- 2019-04-19 Pending — RMLS
- 2019-04-13 Listed $131,900 RMLS
- 2004-11-10 Sold (MLS) $80,000 RMLS
- 2004-10-21 Delisted — RMLS
- 2004-10-06 Listed $84,900 RMLS
- 2002-10-11 Sold (MLS) $79,800 RMLS
- 2001-09-28 Listed $79,800 RMLS
Property tax history
+5.1%/yrLatest (2026): $1,849 · +117.3% YoY. Source: county tax records.
Cash-flow waterfall
monthlySold comps — $/sqft
last 12 mo · ≤1 miLoading sold comps…