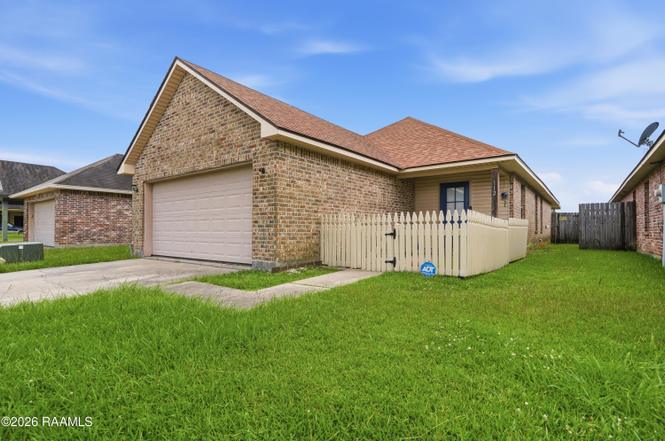
112 Smalley Rd · Carencro, LA
Flood risk 1/10 · Minimal
- FEMA flood zone
- A
- Chance of flooding over 30 yrs
- 0.0%
- Est. flood insurance / yr
- $1,009 – $1,996
Fire risk 3/10 · Minor
- Est. fire insurance / yr
- $1,269 – $2,357
Heat risk 8/10 · Major
- Hot days now (above 109°F)
- 7 days/yr
- Hot days in 30 yrs
- 20 days/yr
Wind risk 9/10 · Severe
- Chance of severe wind over 30 yrs
- 99.0%
Air-quality risk 2/10 · Minimal
- Unhealthy air days now
- 1 days/yr
- Unhealthy air days in 30 yrs
- 1 days/yr
Risk factors via First Street. Map © Google.
Why this score? — see what drove the D grade
The composite is a weighted blend of 9 inputs, each scored 0–100. Each bar is that input's sub-score; the figure is the points it added to the 100-point composite (weight × sub-score).
- Cash flow +16.2/30.0
- ARV discount +6.8/15.0
- DSCR +5.0/10.0
- 1% rule +3.7/10.0
- Schools +3.6/10.0
- Livability +3.5/5.0
- Rent growth +2.5/5.0
- Condition / age +2.5/5.0
- Appreciation +0.0/10.0
$182,000
🖨 Deal sheet 📄 Offer letter ✓ Due diligence
Listing remarks MLS
Adorable all brick exterior newer home ready for its new owner! Open floor plan flows from front to back with stacked living, dining and kitchen- the perfect spaces to enjoy and entertain. All appliances are included! Ceramic tile through living spaces and into master suite. Split floor plan with master suite in the rear and remaining two beds and bath off front hallway. Laundry closet between master and kitchen with washer and dryer to remain (with acceptable offer)! Freshly painted throughout! Rear patio has and extended patio cover with roll shade which will also remain for use in the evenings while you enjoy the fenced back yard. 2 car garage completes the home! Front fenced area makes this one such a cute place to call HOME! Not in a flood zone.
Key facts
- 6,534 sq ft lot
- 2 garage spots
- Built 2011
Property features AI
Finance
- HOA & community: No association fee
Exterior
- Parking: Attached garage with 2 covered parking spaces; Total 2 parking spaces
- Utilities: Public sewer; Electric service: SLEMCO
- Home design: Single family residence; Located on a city paved street; Residential zoning
- Construction: Brick veneer and vinyl siding with frame construction; Composition roof
- Exterior features: Covered porch; Lighting
Interior
- Kitchen: Dishwasher; Disposal; Microwave; Refrigerator; Electric stove/oven
- Bedrooms: Bedrooms with walk-in closets
- Flooring: Carpet; Tile
- Bathrooms: 2 full bathrooms
- Heating & cooling: Central heating; Central air conditioning
- Interior features: Cathedral ceilings; Walk-in closets; Dining room; Living room; Tile countertops; Lighting (exterior lighting listed under exterior)
- Laundry & utility: Washer hookup; Electric dryer hookup; Washer and dryer included
Neighborhood map
What this means for you Summary
Snapshot
- This is a 3-bed/2.0-bath single-family listed at $182k.
Deal economics
- At list price, monthly cash flow is $-30 ($-358/yr) — negative.
- To cash-flow at today's rent, offer at most $177k (2.9% below list).
- To meet the 1% rule (rent ≥ 1% of price), the offer needs to be $157k (13.5% below list).
- Recommended offer: $157k (13.5% below list) — sets the bar for 1% rule.
- Cap rate 6.9% vs local median 5.3% in Carencro — top-decile yield for the area; either an underpriced asset or a hidden risk that comps aren't pricing in. Stress-test before assuming the spread holds.
Location & tenants
- Location reads 69/100 on livability (#65 in LA) — a middle-class / working-renter tenant base. Strengths: cost of living A+, housing A+, health & safety A+; Watch: employment C-, crime D, amenities F.
- Lafayette Parish (urban): math 38% / reading 46% proficiency, ranked #19 of 98 in LA (top 19%) — families likely to look elsewhere, expect single-tenant / working-renter base with shorter leases.
- Zoned schools: Live Oak Elementary School (math 21% / reading 27%, grade F, #402 of 646 statewide, top 63%, 602 students, 82% FRL); Carencro Middle School (math 18% / reading 28%, grade F, #145 of 218 statewide, top 69%, 665 students, 75% FRL); Carencro High School (math 30% / reading 29%, grade F, #127 of 265 statewide, top 49%, 1,096 students, 69% FRL) — zoned schools average 75% FRL vs 56% district-wide (19 pts higher); higher-poverty schools than district average — tighter screening recommended.
- Zoned-school proficiency averages 26% at this address vs 42% district-wide (-16 pts) — the specific schools serving this property underperform the Lafayette Parish average; the district grade overstates school quality for this exact location.
- Market conditions: 324 active listings in the ZIP; 4 comparable units currently listed for rent nearby; rentals lingering (median 44d on market — plan ~5-8 weeks vacancy on turnover, expect pricing pressure); 50% of comp listings sitting > 30 days — soft ceiling on asking rent; 1,585 units permitted in Lafayette Parish in 2024 (10 in 5+ unit buildings).
Forward outlook
- Local home prices are declining (-3.0%/yr); year-one equity from $1k of loan paydown is wiped out by about $5k of value loss. Plan a longer hold.
- Lafayette County population projected at +34% by 2050 — long-run rental-demand tailwind backs the buy-and-hold thesis.
Negotiation context
- Only 4 days on market — expect competitive offers; lowballing is unlikely to land.
- 6 sale attempts since 17y ago with the ask held roughly flat each time — persistent listings suggest the price (not the market) is what's stuck; bring a comps-based counter.
- Current owner paid $144k; 26% above their basis — modest negotiation headroom, anchor on the comps not their cost.
Risks & watch-outs
- Watch-outs: flood insurance adds $125/mo.
- Climate carrying-cost: in FEMA flood zone A (mandatory federal flood insurance); severe wind risk, 99% chance of damaging wind over 30y; extreme-heat days projected 7→20/yr by 2055 (HVAC capex compounding) — expect insurance premiums to compound above CPI over the hold.
Questions for the listing agent
- What do current leases actually rent for vs. the listed asking? Can we see a recent rent roll and the last 12 months of T-12 income?
- What's the actual annual flood-insurance premium (NFIP or private), and is the property in a SFHA with mandatory coverage?
- Is there a deadline driving the sale (1031 exchange, divorce, estate, relocation)? That informs how much negotiation room exists.
- Crime grade is D in this area — have there been break-ins, vandalism, or insurance claims at this property in the last 3 years? What carrier currently insures it and at what premium?
- The area grade is low — what's the realistic commute time and amenity access for the typical tenant pool here? Any planned neighborhood developments (good or bad) we should know about?
- What's the average days-on-market for RENTAL listings here right now (not sales)? A rising rental-DOM trend means longer vacancies and softer asking-rent achievability than the comps imply.
- What's the recent tenant-quality profile in this submarket — average credit score on applications, eviction rate, late-payment / NSF rate, and stable-employment percentage? A property-management company in the area should have these aggregated.
- How much new for-sale + rental construction is in the pipeline within 1–3 miles? Heavy new supply typically softens prices + rents 12–24 months out; constrained supply supports both.
Investment metrics
- 1% rule
- 0.87% ✗
- Cap rate
- 6.92%
- Cash-on-cash
- 2.24%
- DSCR
- 1.10
- GRM
- 9.6
CMA / ARV
- ARV (on-the-fly)
- $179,077
- Comps found
- 12
Show comp detail 12 sales within ~0.75 mi
| Address | Dist | Beds/Ba | Sqft | Sold | Price | $/sf | Match |
|---|---|---|---|---|---|---|---|
| 400 Summerfest Dr | 0.15mi | 3/2.0 | 1,400 (+2%) | 6mo | $195,000 | $139 | 84 |
| 201 Pavilion St | 0.13mi | 3/2.0 | 1,410 (+3%) | 7mo | $185,000 | $131 | 83 |
| 704 Breaux Rd | 0.32mi | 3/2.0 | 1,461 (+7%) | 2mo | $190,000 | $130 | 72 |
| 408 Breaux Rd | 0.15mi | 3/2.0 | 1,500 (+10%) | 6mo | $209,000 | $139 | 72 |
| 702 Breaux Rd | 0.31mi | 3/2.0 | 1,431 (+5%) | 9mo | $185,000 | $129 | 70 |
| 305 Pavilion St | 0.22mi | 3/2.0 | 1,488 (+9%) | 8mo | $149,900 | $101 | 68 |
| 211 Saddle Crest Dr | 0.36mi | 3/2.0 | 1,517 (+11%) | 0mo | $215,500 | $142 | 65 |
| 105 Fanfare Ln | 0.14mi | 3/2.0 | 1,510 (+10%) | 21mo | $200,000 | $132 | 59 |
| 203 Summerfest Dr | 0.24mi | 3/2.0 | 1,570 (+15%) | 16mo | $211,500 | $135 | 51 |
| 102 Raceway St | 0.73mi | 3/1.0 | 1,309 (-4%) | 15mo | $122,000 | $93 | 42 |
| 304 Rampart St | 0.71mi | 4/2.0 (+1) | 1,571 (+15%) | 1mo | $140,000 | $89 | 36 |
| 114 Kentwood Dr | 0.74mi | 3/1.5 | 1,287 (-6%) | 24mo | $140,461 | $109 | 34 |
Match score weights: distance 35% · size 25% · config 20% · recency 20%. Top-matched comps best support the ARV.
Projected returns pro-forma
-3.0% appreciation · 3.0% rent growth · sell at horizon
- IRR
- -17.4%
- Equity multiple
- 0.38×
- Total profit
- $-31,361
- Equity at exit
- $27,137
- IRR
- -9.4%
- Equity multiple
- 0.42×
- Total profit
- $-29,622
- Equity at exit
- $15,736
Cash invested: $50,960 (down + closing). Projections, not guarantees.
Landlord ↔ Tenant lean methodology
- Overall (STATE)
- 90 Strongly Landlord-Friendly
- State Louisiana
- 90 Strongly Landlord-Friendly · R+12
- County
- — inherits STATE
- City
- — inherits STATE
ZIP-level market 70507
- Home prices YoY
- -20.6%
- Active inventory
- 324
- Price-to-rent
- 9.6×
Monthly cashflow live
- Estimated rent
- $1,574 medium interval (Pro) →
- Mortgage (P&I)
- −$954
- Tax from tax record
- −$118 /mo · $1,418/yr
- Insurance
- −$76
- Flood insurance flood zone
- −$125 /mo · $1,502/yr
- HOA
- −$0
- Vacancy / Maint / Mgmt
- −$331
- Net cashflow
- $-30
Break-even live
UW: 25.0% down · 7.5% · 30yr · 1.5% tax · 5.0% vac · 8.0% maint · 8.0% mgmt
Financing live
Cash to close
- Down payment
- $45,500
- Closing costs
- $5,460
- Reserves months
- —
- Total cash needed
- —
Loan-product check · same deal, 3 products live
Conventional
25% down · 7.5% · 30yr
- Down + closing
- —
- Monthly P&I
- —
- Monthly cashflow
- —
- DSCR
- —
- Eligible?
- —
Personal DTI + credit; lowest rate.
DSCR
20% down · 8.5% · 30yr
- Down + closing
- —
- Monthly P&I
- —
- Monthly cashflow
- —
- DSCR
- —
- Eligible?
- —
No personal income docs; deal must DSCR.
Hard money
10% down · 12.0% · 12mo
- Down + closing
- —
- Monthly P&I
- —
- Monthly cashflow
- —
- DSCR
- —
- Eligible?
- —
Short-term bridge; refi at stabilization.
Rent comps 4 comps
| Address | Beds | Baths | Sqft | Rent | $/sqft | DOM | Units | Dist |
|---|---|---|---|---|---|---|---|---|
| 202 Cantal Dr Unit D Lafayette, LA | 2.0 | 1.5 | 900 | $825 | $0.92 | 13d | 1 | 0.66mi |
| 417 Elwick Dr Lafayette, LA | 3.0 | 2.0 | 1463 | $1,650 | $1.13 | 21d | 1 | 1.18mi |
| 115 Northpointe Dr Carencro, LA | 3.0 | 2.0 | 1696 | $1,650 | $0.97 | 44d | 1 | 1.29mi |
| 219 Oak Path Dr Carencro, LA | 3.0 | 2.0 | 1615 | $1,900 | $1.18 | 44d | 1 | 1.37mi |
Listing history 5 events
-
2026-06-18days on market $182,000 Active 4 DOM
-
2026-06-17days on market $182,000 Active 3 DOM
-
2026-06-16days on market $182,000 Active 2 DOM
-
2026-06-15remarks 544-char remark
-
2026-06-15$182,000 Active 1 DOM
ⓘ Source: listings_history table (triggers on properties + properties_extension) + one-shot
backfill from property_details.listing_events for pre-trigger history.
Tax reassessment forecast LA · Resets to sale price
- Current annual tax
- $1,418 · $118/mo
- Projected year-2 tax
- $1,418 · $118/mo
- Expected delta
- $0/yr ($0/mo · 0.0%)
ⓘ Screening estimate from a state-policy table — verify with the county assessor before closing.
Climate risk First Street
- Flood 1/10 Low FEMA zone A · 0% chance over 30 yrs
- Wildfire 3/10 Moderate
- Heat 8/10 Severe 7 d/yr ≥109°F today · 20 d/yr by 30 yrs out
- Wind 9/10 Extreme 99% chance of damaging wind over 30 yrs
- Air quality 2/10 Low 1 unhealthy d/yr today · 1 by 30 yrs out
Nearby sold comps map
Loading sold comps map…
Walkable amenities ~0.75 mi
Loading nearby amenities…
Taxation est. · year 1
- Rental income
- $18,892
- − Mortgage interest
- −$10,195
- − Property taxes
- −$1,418
- − Insurance
- −$2,412
- − Repairs & maintenance
- −$1,511
- − Management
- −$1,511
- − Depreciation
- −$5,295
- Taxable loss
- −$3,450
- Est. tax savings @ 24.0%
- +$828
- After-tax cash flow
- $470/yr
For passive investors: Depreciation is non-cash, so a rental often shows a tax loss while cash-flowing — sheltering income. Rental losses are passive: they offset passive income freely, and up to $25,000/yr can offset ordinary (W-2) income if you actively participate and your MAGI is under $100k (phasing out to $0 by $150k); unused losses carry forward. On sale, claimed depreciation is recaptured at up to 25%, and gains may owe capital-gains tax (a 1031 exchange can defer both). Figures are a year-1 estimate at your 24.0% rate — not tax advice; consult a CPA.
Schools (NCES district)
- District
- Lafayette Parish
- NCES district ID
- 2200870
- Math proficiency
- 38% ▼ -32.00%
- Reading proficiency
- 46% ▼ -24.00%
- Median HH income
- $50,238
- Composite
- 36.15/100
- National rank
- #4741
- State rank
- #19 of 98 in LA
Livability — Carencro
- Score
- 69/100
- State rank
- #65
- US rank
- #8277
Category grades
Schools grade is shown separately in the Schools card above.
Census & demographics
- Census place
- Carencro, LA
- County
- Lafayette Parish · 207,544 people
- City population
- 20,134
- Metro
- Lafayette, LA
- Population (ZIP)
- 20,096
- Household income
- $64,049
- Rent vs Own
- Severe rent burden
- 503.0
Population outlook (Lafayette County) Hauer SSP2
- Today (2025)
- 280,930 people
- By 2030
- 301,092 · +7.2%
- By 2040
- 339,456 · +20.8%
- By 2050
- 375,156 · +33.5%
- By 2075
- 451,672 · +60.8%
- By 2100
- 497,203 · +77.0%
Race, ethnicity, and origin ACS 2023
- Neighborhood character
- Diverse neighborhood (Simpson 0.57)
- Race & ethnicity
- Black 47% White 45% Two or more races 6% Hispanic / Latino 3%
- Common ancestry
- Lithuanian 15%
- Foreign-born
- 2% · Canada
- Languages at home
- 94% English-only · French/Haitian/Cajun 4% Spanish 2%
Political lean MEDSL · Lafayette
- 2024 margin
- Solid R (+31.4) · D 33.5% · R 64.8% · Other 1.7%
- 2008→2024 swing
- -0.1pp no change · 2008: -31.3pp · 2024: -31.4pp
- All cycles
- 2024: R+31.4 2020: R+28.7 2016: R+33.6 2012: R+33.7 2008: R+31.3
Not yet ingested
- Civics
- —
Market trends
- HPI YoY
- ▼ -40.84%
- Current HPI
- 156.889
- Rent YoY
- —
- Metro
- Lafayette, LA
- State GDP YoY
- ▲ 3.29%
- F500 in state
- 10
Industry mix (Fortune 500 HQ in LA)
| Industry | F500 HQs | Revenue |
|---|---|---|
| Telecommunications | 2 | $23B |
|
||
| Utilities | 1 | $12B |
|
||
| Wholesale / Distribution | 1 | $5B |
|
||
| Advertising | 1 | $2B |
|
||
Price history
+746.5% since first listed12 events — show timeline
- 2026-06-11 Listed $182,000 AcadianaMLS
- 2020-07-15 Sold (Public Records) $144,500 Public Records
- 2020-07-14 Sold (MLS) $144,500 AcadianaMLS
- 2020-06-11 Listed $144,500 AcadianaMLS
- 2016-12-05 Sold (Public Records) $139,900 Public Records
- 2016-12-02 Sold (MLS) $139,900 AcadianaMLS
- 2016-06-28 Listed $139,900 AcadianaMLS
- 2011-09-19 Sold (MLS) $121,600 AcadianaMLS
- 2010-09-13 Sold (MLS) $20,000 AcadianaMLS
- 2010-09-10 Listed $119,900 AcadianaMLS
- 2010-05-12 Listed $19,900 AcadianaMLS
- 2009-04-14 Listed $21,500 AcadianaMLS
Property tax history
+2.8%/yrLatest (2025): $1,418 · -1.3% YoY. Source: county tax records.
Cash-flow waterfall
monthlySold comps — $/sqft
last 12 mo · ≤1 miLoading sold comps…